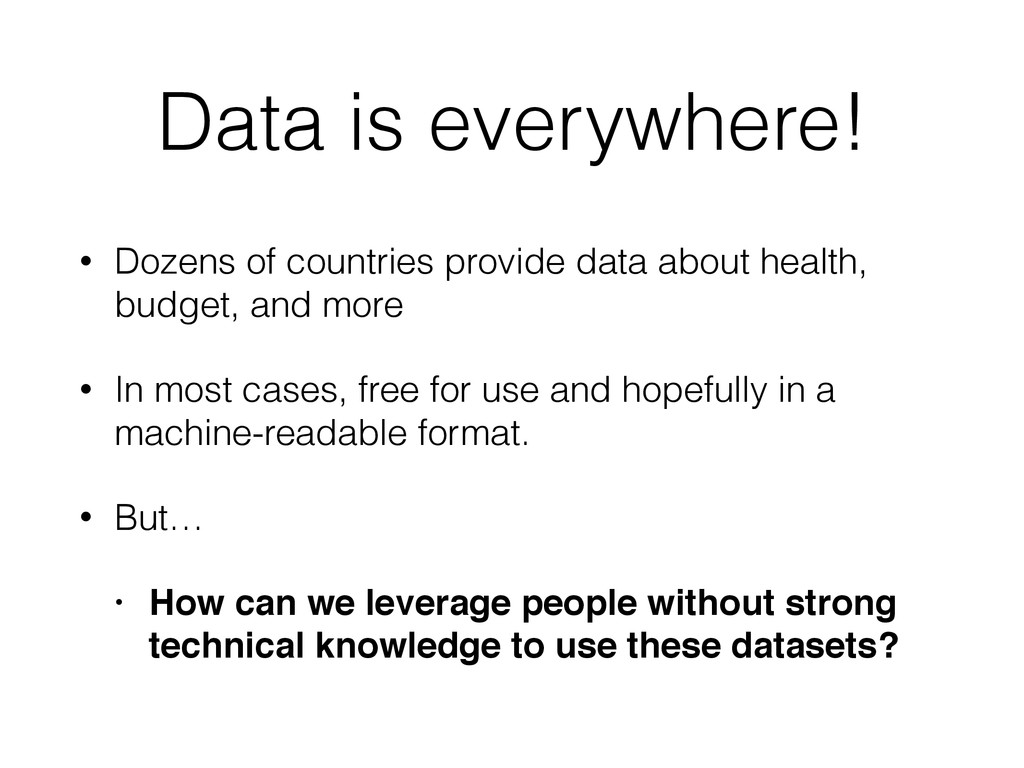
health, budget, and more • In most cases, free for use and hopefully in a machine-readable format. • But… • How can we leverage people without strong technical knowledge to use these datasets?
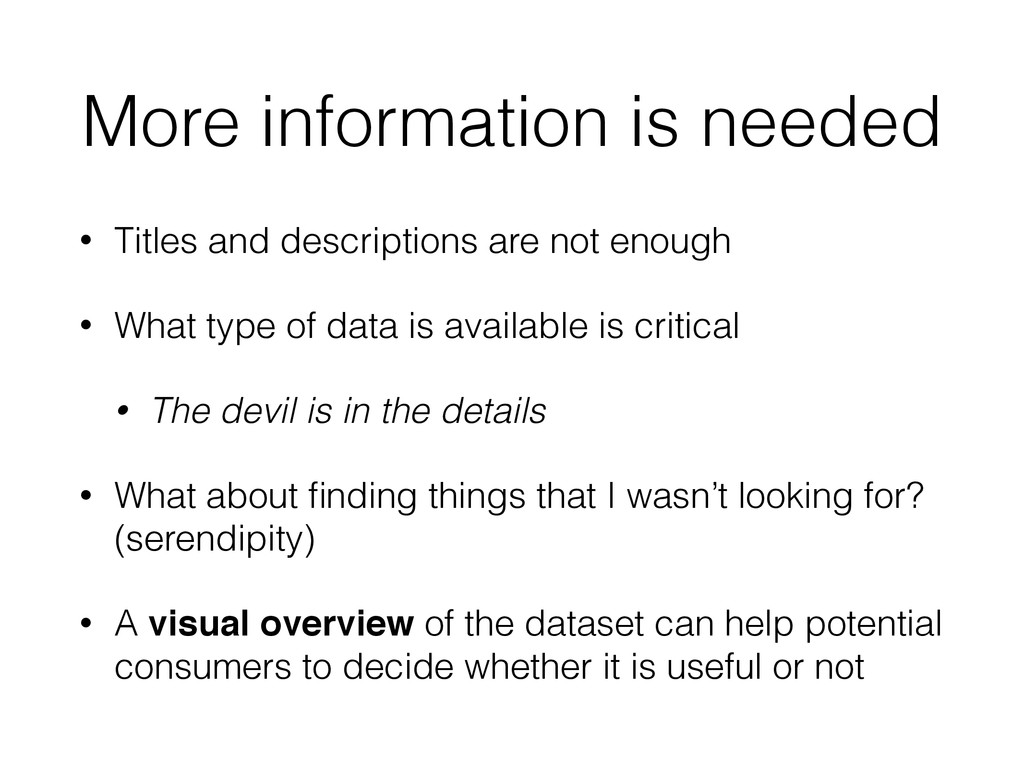
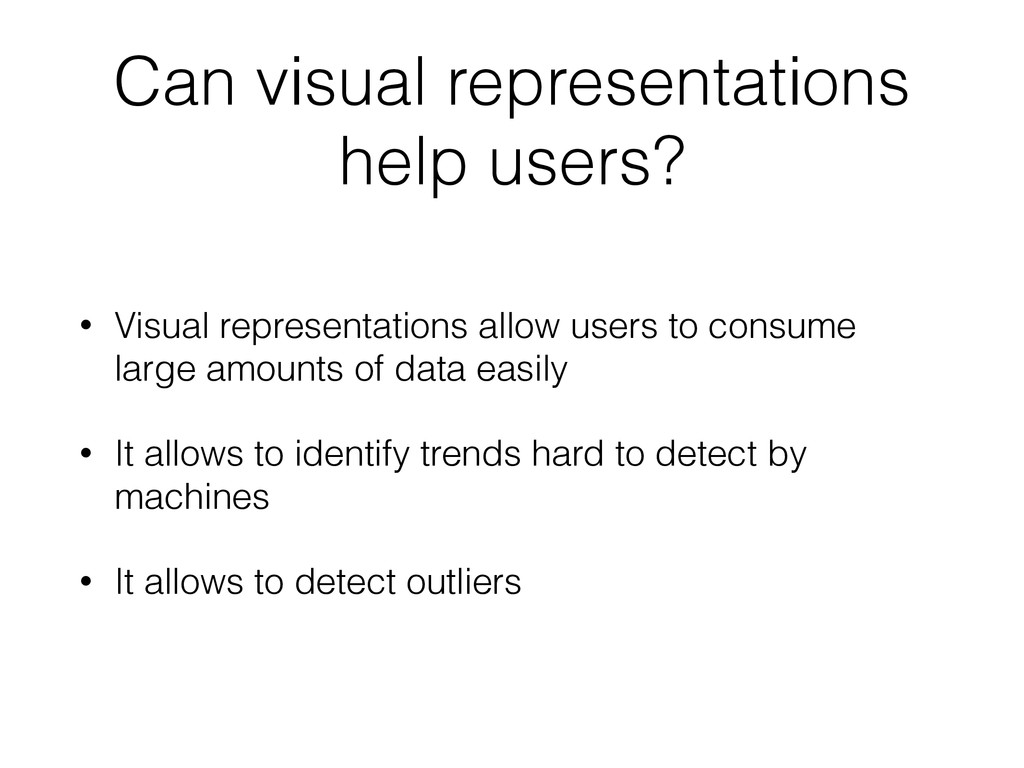
enough • What type of data is available is critical • The devil is in the details • What about finding things that I wasn’t looking for? (serendipity) • A visual overview of the dataset can help potential consumers to decide whether it is useful or not
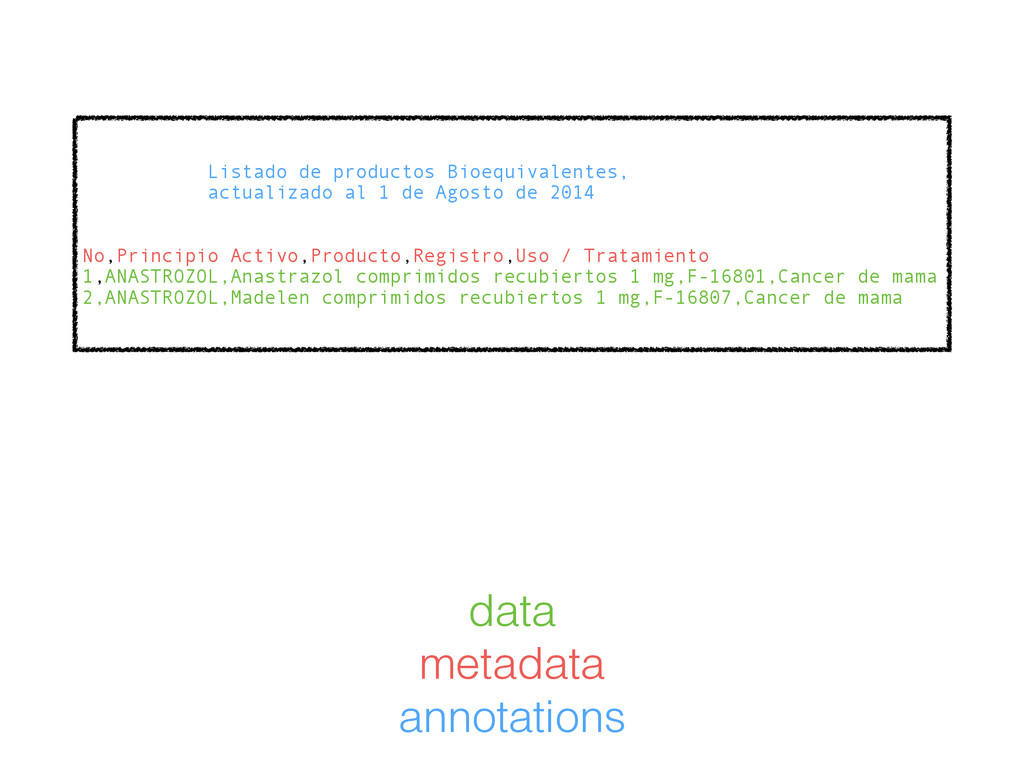
de Agosto de 2014 ! ! No,Principio Activo,Producto,Registro,Uso / Tratamiento 1,ANASTROZOL,Anastrazol comprimidos recubiertos 1 mg,F-16801,Cancer de mama 2,ANASTROZOL,Madelen comprimidos recubiertos 1 mg,F-16807,Cancer de mama
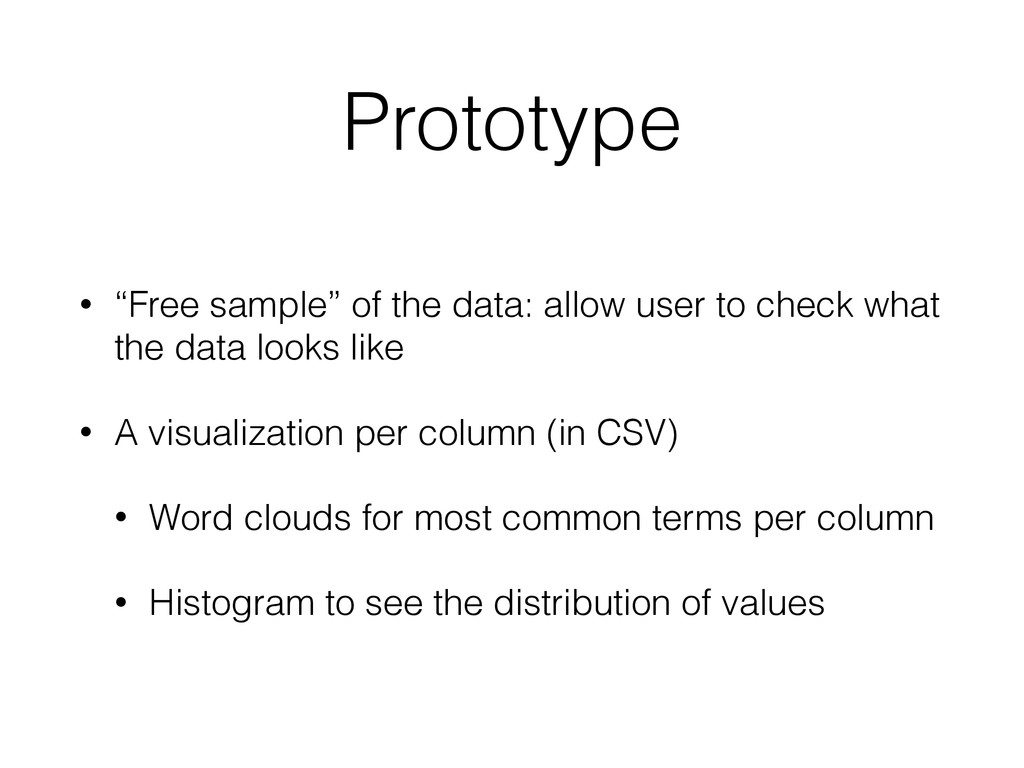
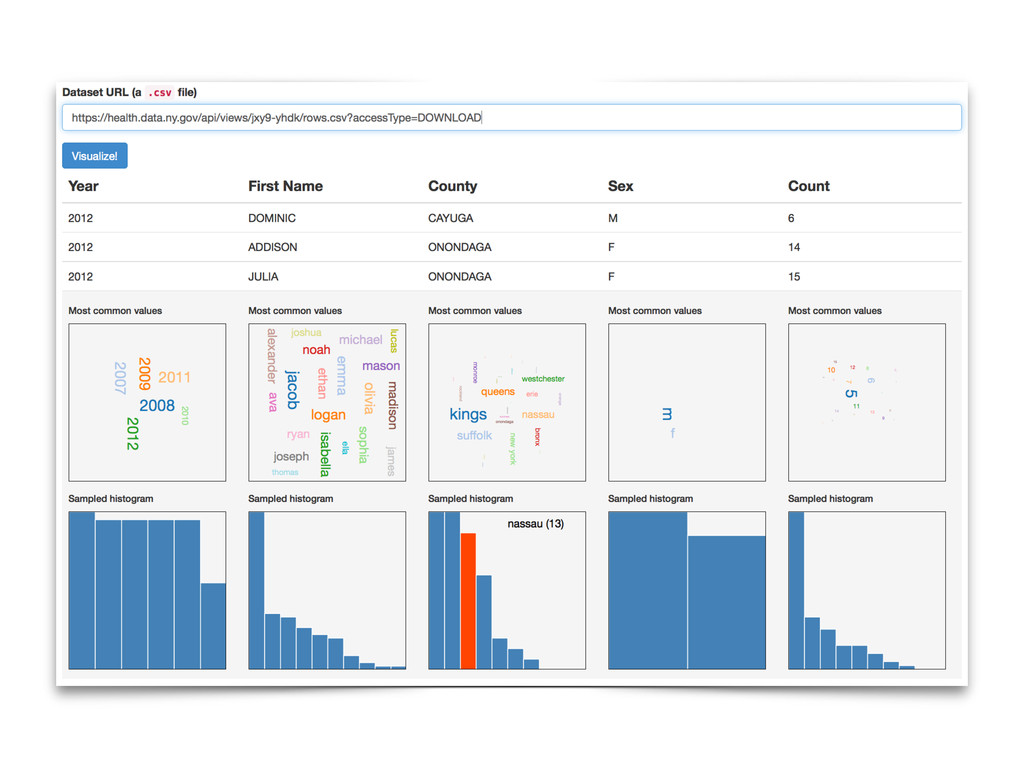
check what the data looks like • A visualization per column (in CSV) • Word clouds for most common terms per column • Histogram to see the distribution of values
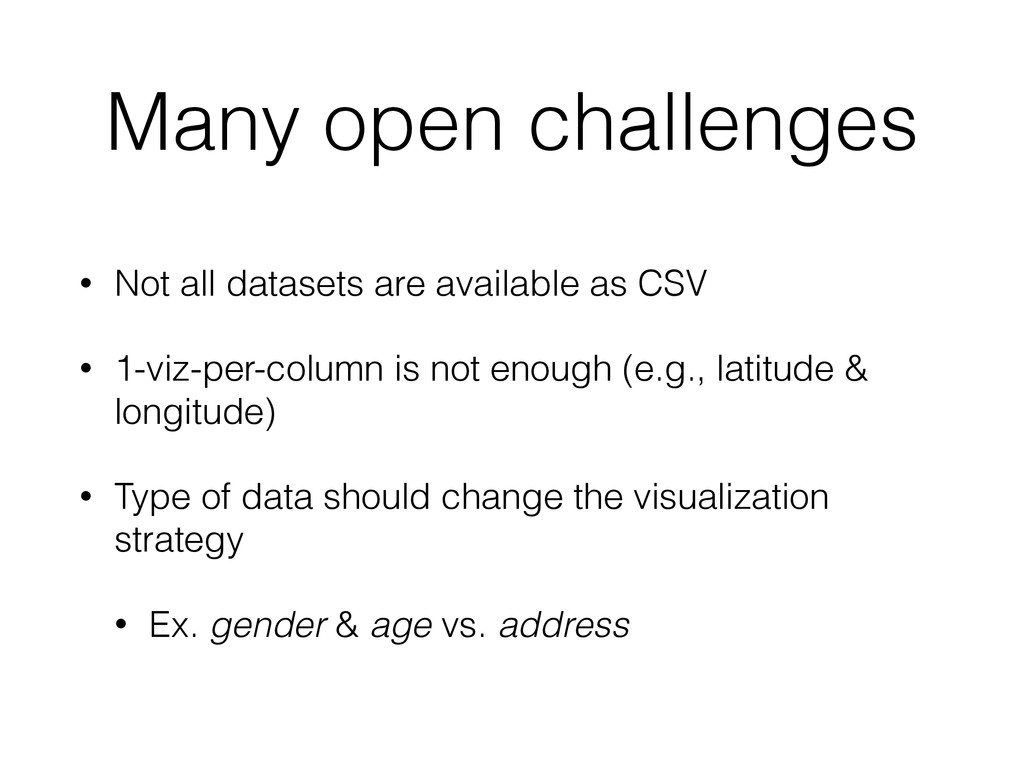
CSV • 1-viz-per-column is not enough (e.g., latitude & longitude) • Type of data should change the visualization strategy • Ex. gender & age vs. address
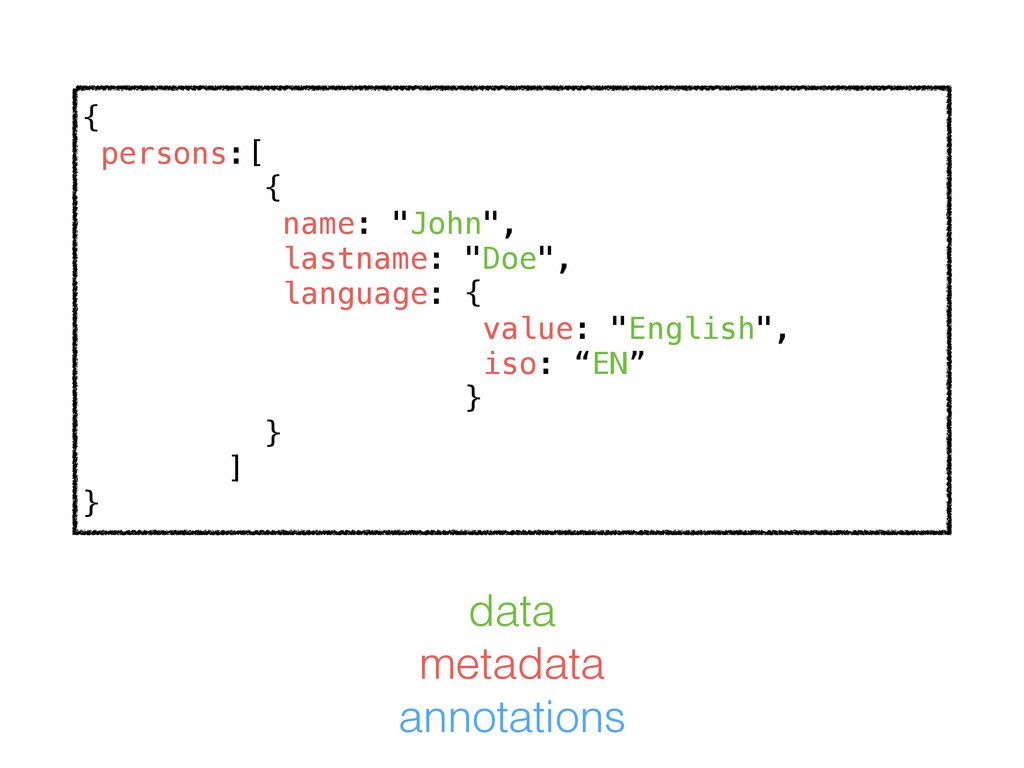
of data, metadata and annotations in order to create visual overviews • Smarter mechanisms are needed to create VO, easy to share and embed • Comparative visual overviews over multiple datasets? • We need to run different tests to validate different approaches
![Towards Visual Overviews for Open Government Data Alvaro Graves [email protected],](https://files.speakerdeck.com/presentations/1cb2e480141a0132254d266df763699e/slide_0.jpg)