This is just an exercise to explain "Static Data vs Dynamic Data". I've been hearing about the "Anthropocene", I looked and found the article, after several minutes of reading and counting 8 times the word "phosphorus" in the same paragraph I decided that this Ricardo Rodriguez Erdmenger Business optimization Follow
it will save the planet...and is telling us the same as my mother told me in the 70's, "Eat your vegetables!". So I decided to use a simple technique to visualize the content and references used on the article. This is the result. Here i applied an algorithm using R to create a "word-cloud" to synthesize the content. wordcloud(words = d$word, freq = d$freq, min.freq = 10, max.words = 400, random.order = FALSE, rot.per = 0.35, colors = brewer.pal(8,"Dark2")) COPY-PASTE here the code from another project.
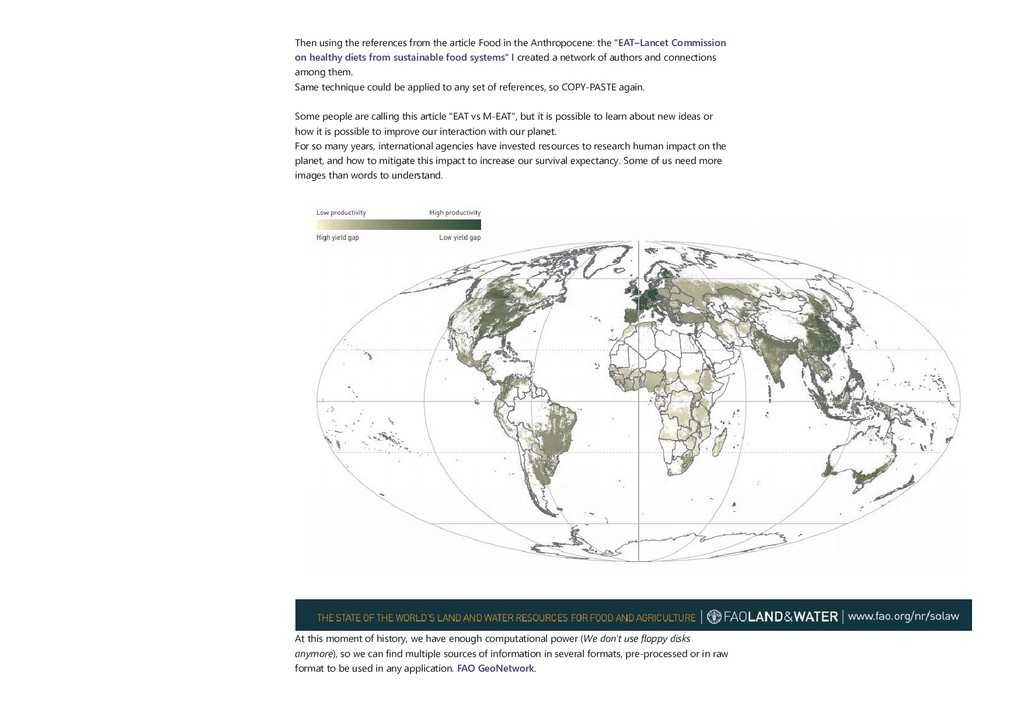
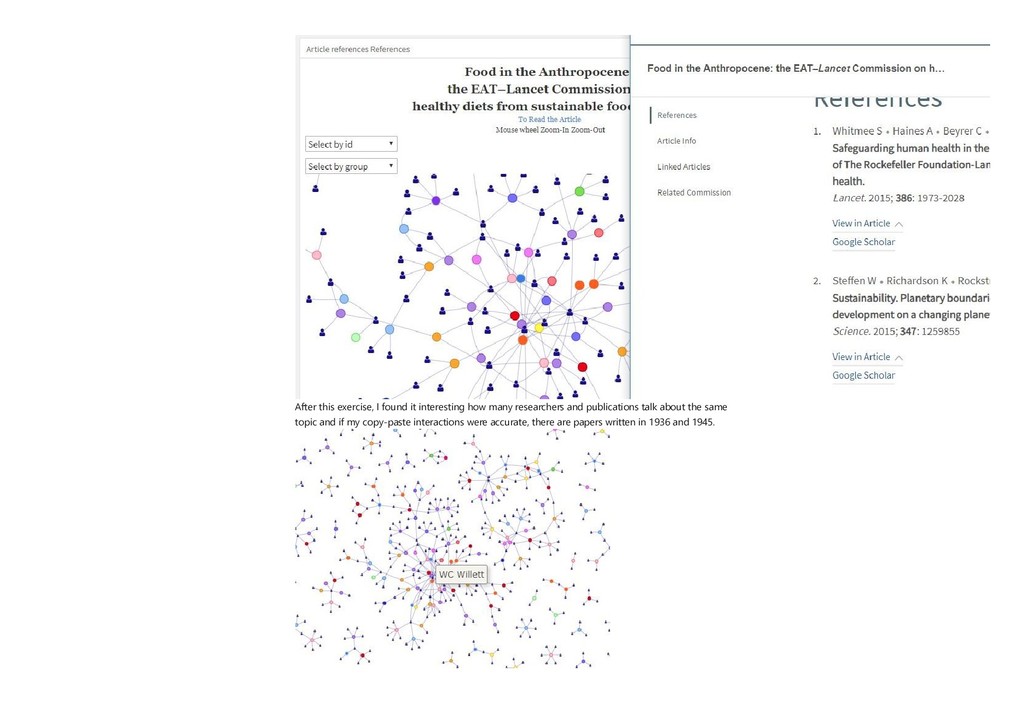
Anthropocene: the "EAT–Lancet Commission on healthy diets from sustainable food systems" I created a network of authors and connections among them. Same technique could be applied to any set of references, so COPY-PASTE again. Some people are calling this article "EAT vs M-EAT", but it is possible to learn about new ideas or how it is possible to improve our interaction with our planet. For so many years, international agencies have invested resources to research human impact on the planet, and how to mitigate this impact to increase our survival expectancy. Some of us need more images than words to understand. At this moment of history, we have enough computational power (We don't use floppy disks anymore), so we can find multiple sources of information in several formats, pre-processed or in raw format to be used in any application. FAO GeoNetwork.
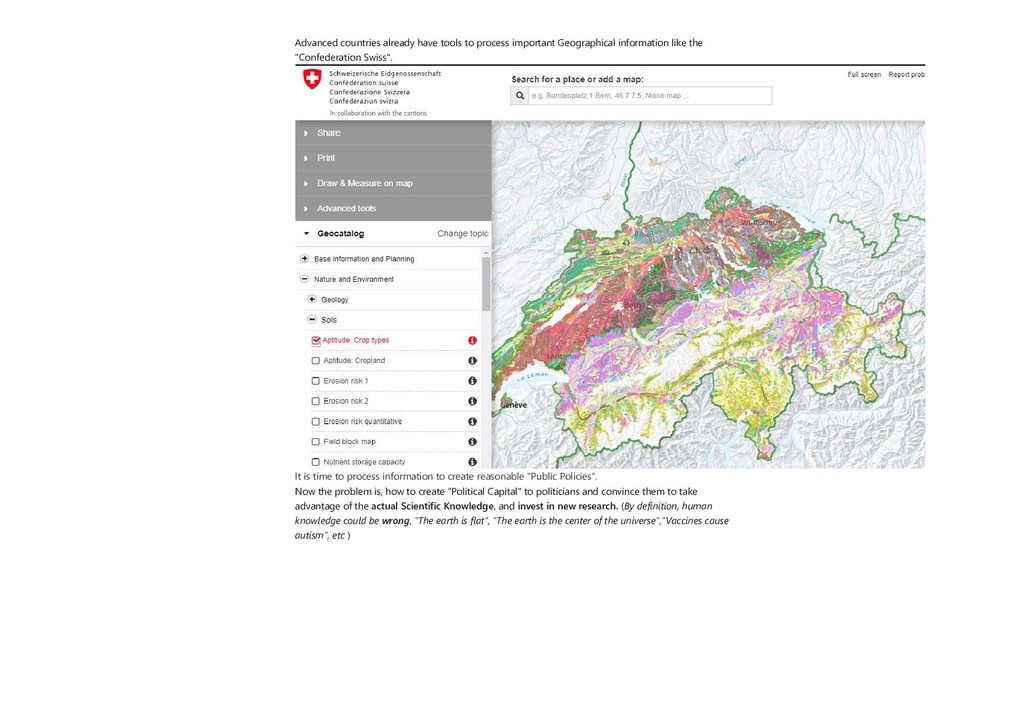
like the "Confederation Swiss". It is time to process information to create reasonable "Public Policies". Now the problem is, how to create "Political Capital" to politicians and convince them to take advantage of the actual Scientific Knowledge, and invest in new research. (By definition, human knowledge could be wrong, "The earth is flat", "The earth is the center of the universe","Vaccines cause autism", etc )
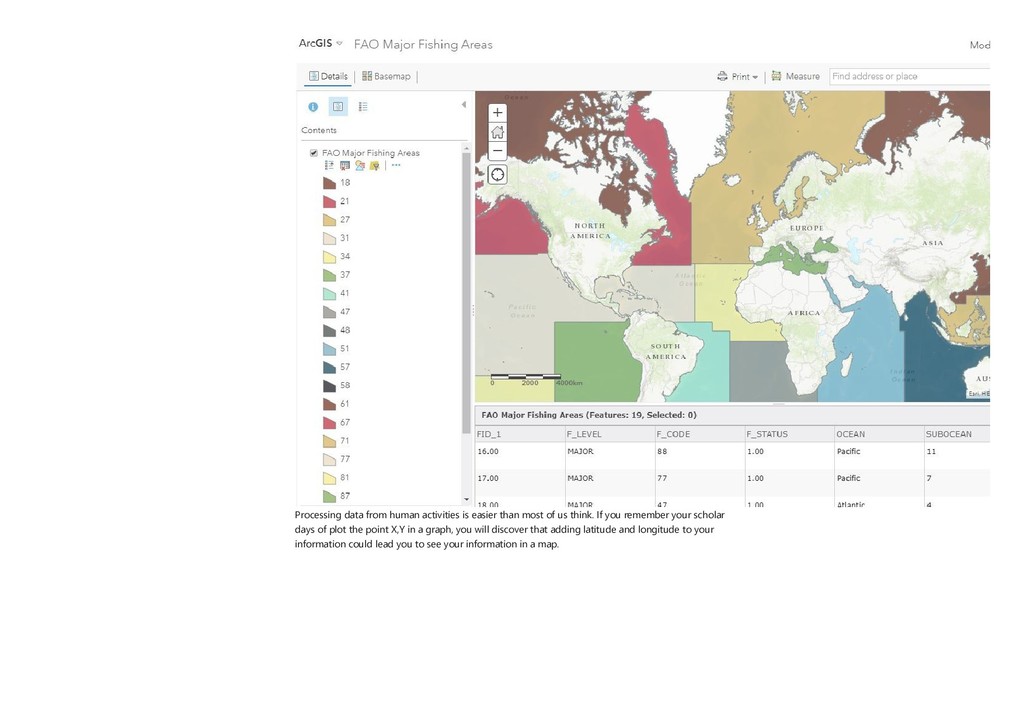
us think. If you remember your scholar days of plot the point X,Y in a graph, you will discover that adding latitude and longitude to your information could lead you to see your information in a map.
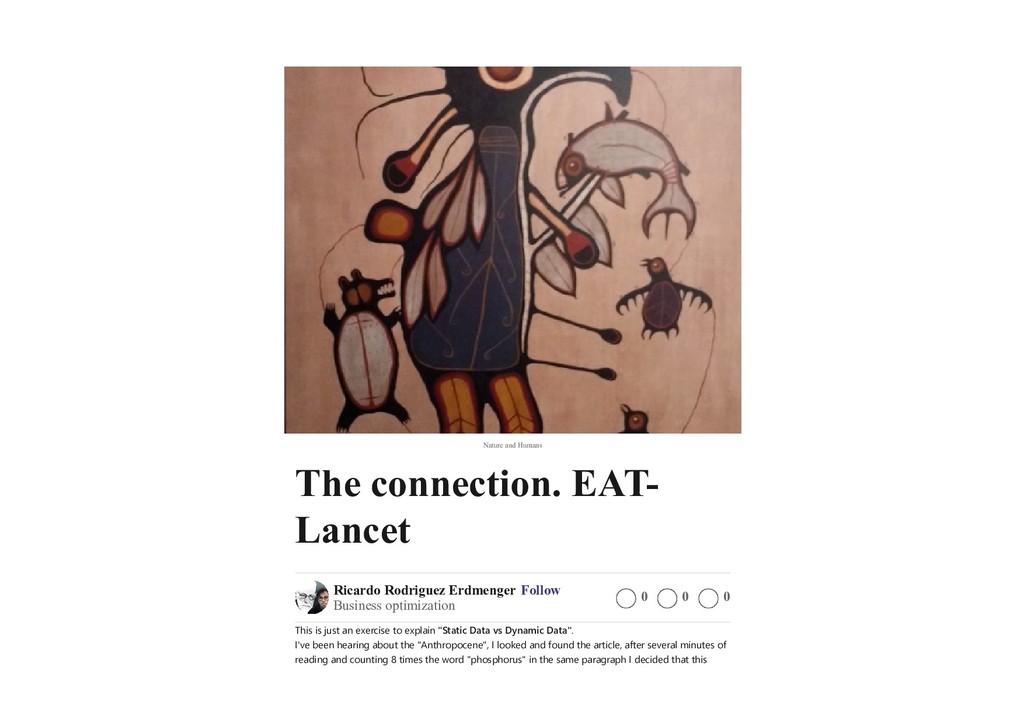
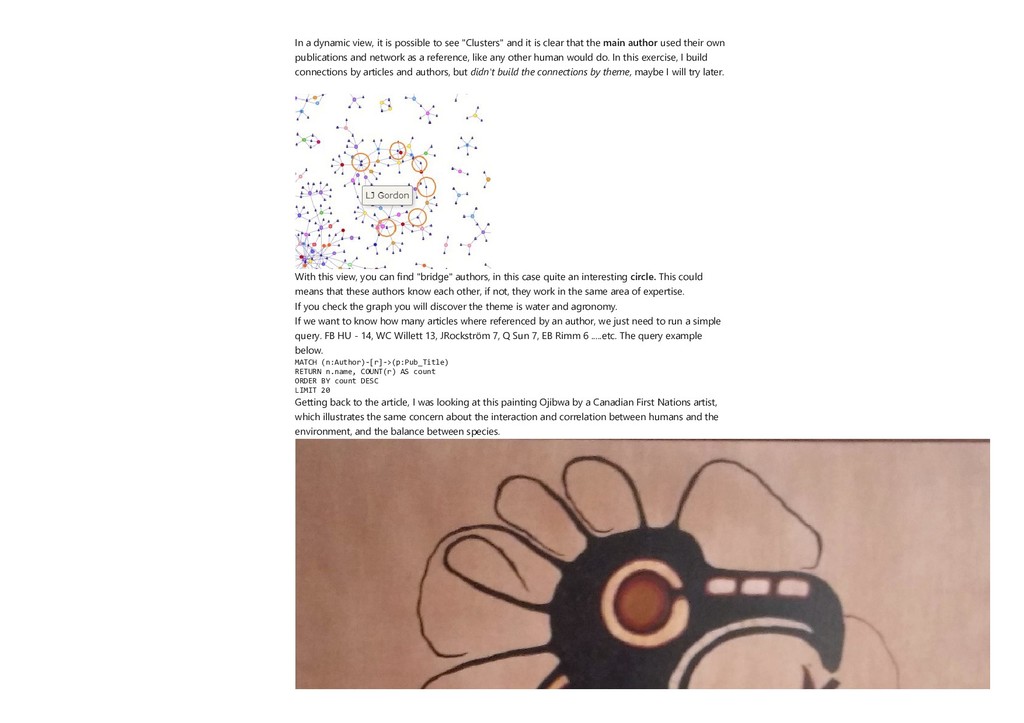
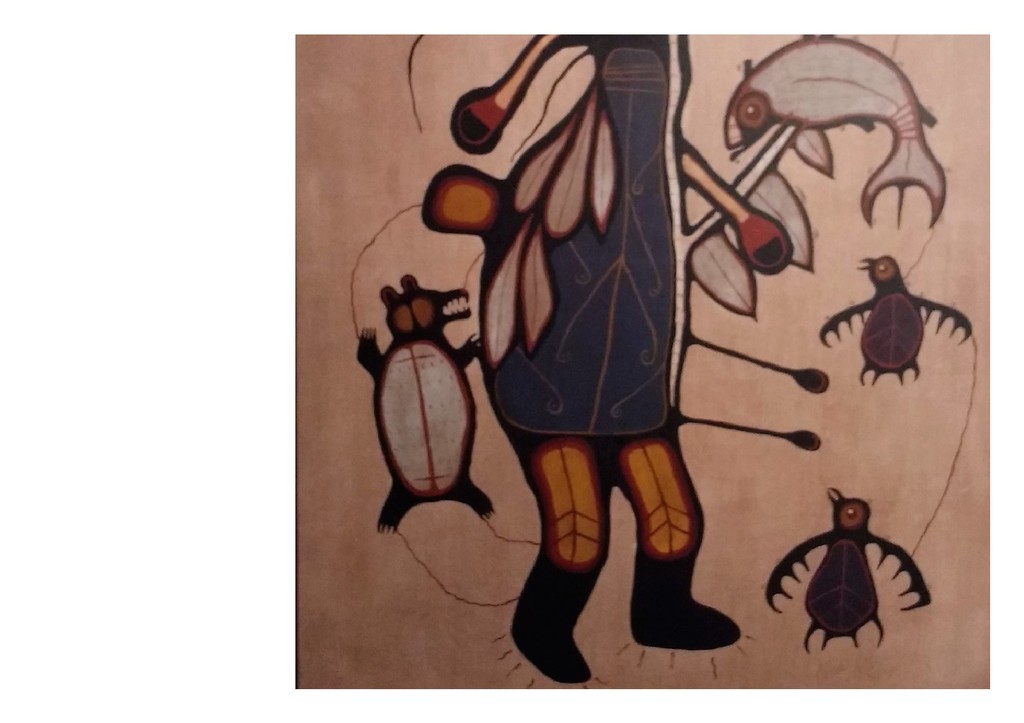
and it is clear that the main author used their own publications and network as a reference, like any other human would do. In this exercise, I build connections by articles and authors, but didn't build the connections by theme, maybe I will try later. With this view, you can find "bridge" authors, in this case quite an interesting circle. This could means that these authors know each other, if not, they work in the same area of expertise. If you check the graph you will discover the theme is water and agronomy. If we want to know how many articles where referenced by an author, we just need to run a simple query. FB HU - 14, WC Willett 13, JRockström 7, Q Sun 7, EB Rimm 6 .....etc. The query example below. MATCH (n:Author)-[r]->(p:Pub_Title) RETURN n.name, COUNT(r) AS count ORDER BY count DESC LIMIT 20 Getting back to the article, I was looking at this painting Ojibwa by a Canadian First Nations artist, which illustrates the same concern about the interaction and correlation between humans and the environment, and the balance between species.
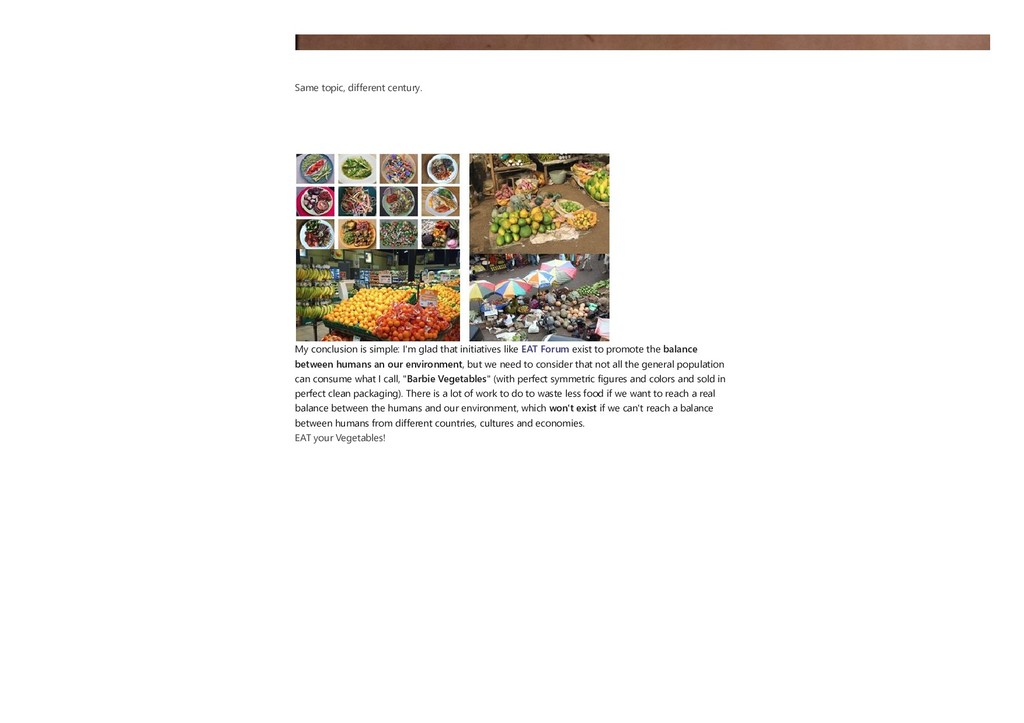
that initiatives like EAT Forum exist to promote the balance between humans an our environment, but we need to consider that not all the general population can consume what I call, "Barbie Vegetables" (with perfect symmetric figures and colors and sold in perfect clean packaging). There is a lot of work to do to waste less food if we want to reach a real balance between the humans and our environment, which won't exist if we can't reach a balance between humans from different countries, cultures and economies. EAT your Vegetables!