Upgrade to Pro — share decks privately, control downloads, hide ads and more …

Standardizing +113 million Merchant Names in Financial Services with GP Hadoop

Standardizing +113 million Merchant Names in Financial Services with GP Hadoop

Talk by Ian Andrews & Mike Goddard @Greenplum at Data Science London 28/11/2012. A financial services case on how to standardize merchant names with regex & fuzzy matching

Data Science London

November 28, 2012
Tweet

More Decks by Data Science London

Other Decks in Technology

Transcript

  1. 1 © Copyright 2012 EMC Corporation. All rights reserved. Data

    Computing Division Applied Analytics with Greenplum Hadoop: Standardizing +113 million Merchant Names with RegEx and Fuzzy Matching Ian Andrews Mike Goddard
  2. 2 © Copyright 2012 EMC Corporation. All rights reserved. Data

    Computing Division Greenplum, A Division of EMC •  10 years of experience building and supporting enterprise-class massively parallel data processing software based on open source technology •  Silicon-valley based core engineering talent from Yahoo!, Teradata, Oracle, Amazon, Microsoft, IBM, etc •  1,000 (and growing) personnel focused on Greenplum’s Big Data Platform –  Greenplum Database –  Greenplum HD (Hadoop) –  Chorus –  Data Computing Appliances –  Data Scientists –  Pivotal Labs •  Fully integrated with EMC’s award-winning global support infrastructure. •  500+ customers in production globally across all industry segments. •  Established relationships with ecosystems partners: Informatica, SAS, Talend, Pentaho, Microstrategy, etc. •  Strategic development relationship with VMware around virtual big data platforms
  3. 3 © Copyright 2012 EMC Corporation. All rights reserved. Data

    Computing Division Greenplum Unified Analytic Platform
  4. 4 © Copyright 2012 EMC Corporation. All rights reserved. Data

    Computing Division Transaction Data - Merchant Name Standardization System
  5. 5 © Copyright 2012 EMC Corporation. All rights reserved. Data

    Computing Division Overview of Findings •  Transaction data is difficult to analyze as merchants names found in credit and debit data are unstructured and non-standardized across single business entities •  We created a system for cleaning and standardizing merchant names –  Stage 1: feature extraction –  Stage 2: automated cleanup using regular expressions –  Stage 3: fuzzy matching algorithm –  Stage 4: application of manual rules •  This is an open system, easy to use, extend and modify •  We used the results to do some preliminary analysis on the transaction data
  6. 6 © Copyright 2012 EMC Corporation. All rights reserved. Data

    Computing Division 85.38% 14.62% Debit Credit Background Information - Credit and Debit Data Overview Credit Transactions1 •  1,396,344 distinct merchant names •  16,554,889 credit transactions ($1,979,801,143.50) •  161,931 households with credit transaction •  Min: -$32,585 •  Max: $99,000 •  Average: $120 •  Std. Deviation: $496 1 Excludes 13 Sic Codes in depository institution activity group Debit Transactions •  2,598,462 distinct merchant names •  96,658,020 debit transactions ($3,471,084,518.72) •  435,615 households with debit transaction •  Min: $0.01 •  Max: $39,404 •  Average: $36 •  Std. Deviation: $89 % # transactions % sum transactions 63.68% 36.32% Debit Credit
  7. 7 © Copyright 2012 EMC Corporation. All rights reserved. Data

    Computing Division Why standardize merchant names? •  Due to multiple names of same businesses across locations a single business entity appears as many in the database •  Examples PAYPAL PAYPAL *SACCAR.COM PAYPAL *BRICKSUPPLY PAYPAL *BRETT2010FL PAYPAL *UNITED PAYPAL *TL5354 PAYPAL *CAR-KIT.COM WAL-MART WALMART PORTRAITS 23093 WAL-MART #2366 SE2 WAL-MART STORE#1041 WAL-MART SUPERCENTER 20 WAL MART LINCOLN WALMART.COM RELOAD STARBUCKS STARBUCKSSTORE.COM-USD STARBUCKS CORP00034488 SS-STARBUCKS T1 STARBUCKS J10431542 STARBUCKS C #112201505 STARBUCKS WEST30081525
  8. 8 © Copyright 2012 EMC Corporation. All rights reserved. Data

    Computing Division Examples of name passing thru merchant name standardization system Original: GIANT FOOD #089 Features: Length: 14 1st White Space: 6 1st Special Characters: 12 1st Digit: 13 Regex: [^(?-i)a-z] Remove all numbers (0-9), white space, & special characters Fuzzy Matching: 1016 (count of GIANTFOOD matches) Manual Override: None Final Results: GIANTFOOD Stage 1 Stage 2 Stage 3 Stage 4 Original: PETSMART INC 1963 Features: Length: 17 1st White Space: 9 Business Suffix: 10 1st Digit: 14 Regex: [^(?-i)a-z]|( INC )$ Remove all numbers (0-9), white space, special characters, & remove business suffix Fuzzy Matching: <170 PETSMART FOUND (Not run) Manual Override: None Final Results: PETSMART
  9. 9 © Copyright 2012 EMC Corporation. All rights reserved. Data

    Computing Division Example Results - STARBUCKS Pre-Standardization Post-Standardization STARBUCKS DELI20371514 STARBUCKS STARBUCKS-ARIFJAN CAMP2 STARBUCKS STARBUCKS C #112201505 STARBUCKS STARBUCKS USA 00115832 STARBUCKS STARBUCK'S CAFE CROWNE STARBUCKS STARBUCKS CORP00134759 STARBUCKS ATL MED CTR STARBUCKS STARBUCKS T3 N STARBUCKS30031512 STARBUCKS STARBUCKS COFEE STARBUCKS STARBUCKS LA ISLA STARBUCKS OMNI FT WORTH - STARBUCKS STARBUCKS ST. RITA'S STARBUCKS STARBUCKS MGM GRND STARBUCKS-CASINO STARBUCKS 006 STARBUCKS AMR STARBUCKS
  10. 10 © Copyright 2012 EMC Corporation. All rights reserved. Data

    Computing Division 90% of all transactions occur at 7% of the merchants Gini Coefficient = 0.9447 •  0 represents equality •  1 represents all transactions at 1 merchant Company Name Total Transactions MCDONALDS 4,309,728 SPEEDWAY 2,032,474 WALMART 1,606,446 KROGER 1,564,819 SHELLOIL 1,546,056 SHEETZ 1,358,977 SUBWAY 1,280,037 REDBOX 1,236,148 EXXONMOBIL 1,205,451 WAWA 1,197,711 SUNO 1,180,799 WENDYS 1,066,628 MARATHONOIL 1,050,593 MEIJER 1,017,998 STARBUCKS 1,002,805
  11. 11 © Copyright 2012 EMC Corporation. All rights reserved. Data

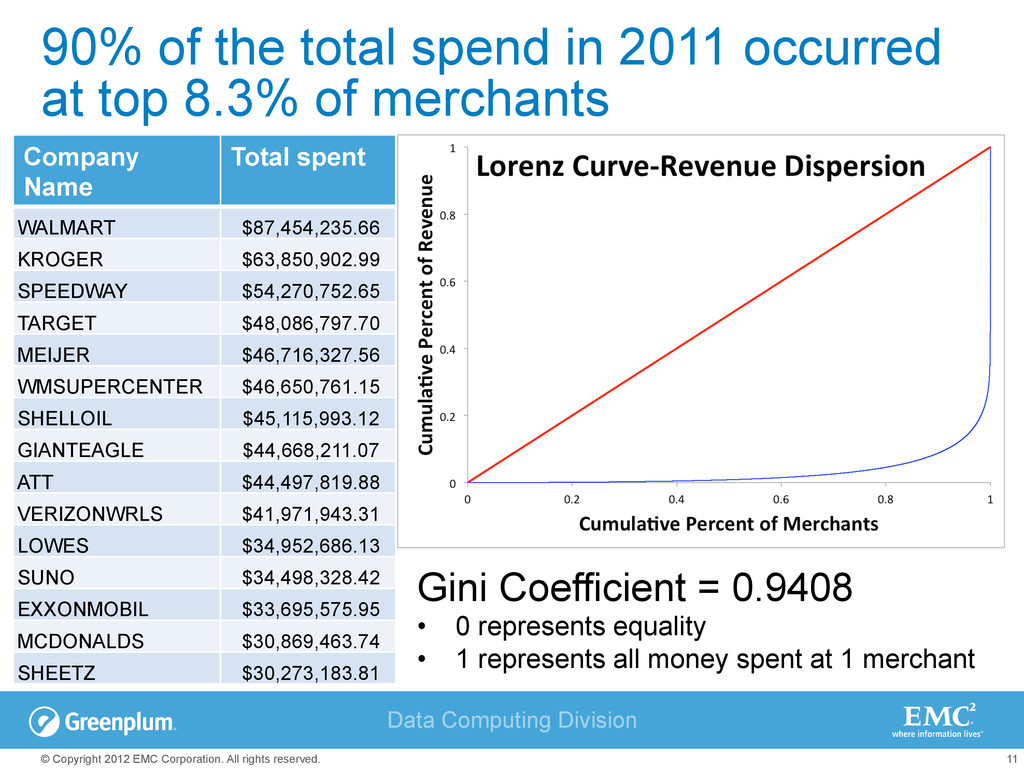
    Computing Division 90% of the total spend in 2011 occurred at top 8.3% of merchants Company Name Total spent WALMART $87,454,235.66 KROGER $63,850,902.99 SPEEDWAY $54,270,752.65 TARGET $48,086,797.70 MEIJER $46,716,327.56 WMSUPERCENTER $46,650,761.15 SHELLOIL $45,115,993.12 GIANTEAGLE $44,668,211.07 ATT $44,497,819.88 VERIZONWRLS $41,971,943.31 LOWES $34,952,686.13 SUNO $34,498,328.42 EXXONMOBIL $33,695,575.95 MCDONALDS $30,869,463.74 SHEETZ $30,273,183.81 Gini Coefficient = 0.9408 •  0 represents equality •  1 represents all money spent at 1 merchant
  12. 12 © Copyright 2012 EMC Corporation. All rights reserved. Data

    Computing Division ‘Sic Codes’ alone are problematic; they can differ greatly across like businesses •  On average the top 1,000 frequently occurring merchants have ~6 sic codes associated with their cleaned merchant name WALMART TARGET SAFEWAY KROGER AT&T VERIZON T-MOBILE 4814 5310 5411 12 1711 4812 12 4816 5411 5499 5411 2741 4814 4812 5300 5732 5921 5499 3640 4899 5732 5411 8043 5541 4112 5999 5999 6300 8099 5542 5971 7311 7299 … … … 7399 … Total 31 Total 8 Total 71 Total 10 6 total matches 2 total matches 4 total matches
  13. 13 © Copyright 2012 EMC Corporation. All rights reserved. Data

    Computing Division Relative Value Add segments created by splitting population into deciles based on RVA RVA calculated for each HH HH Ranked based on RVA Ranked HH split into deciles (10 equal groups) 10 9 8 7 6 5 4 3 2 1 RVA •  Relative Value Added (RVA) provides an estimated ordinal ranking of customers using balance and transaction data (a rough precursor of EVA) •  The RVA was created to put a context around the merchant name discovery, the distribution of PNC’s products and how they interact
  14. 14 © Copyright 2012 EMC Corporation. All rights reserved. Data

    Computing Division Segment Profiles Index: % segment / % population Cohort 1 Cohort 2 Cohort 3 Cohort 4 Cohort 5 Cohort 6 Cohort 7 Cohort 8 Cohort 9 Cohort 10 Cellular telephone providers ATT 1.00 0.86 1.18 1.24 1.14 1.04 0.97 0.91 0.86 0.79 SPRINT 1.75 0.55 1.93 1.72 1.15 0.81 0.67 0.56 0.50 0.36 TMOBILE 1.35 0.95 1.38 1.36 1.06 0.86 0.92 0.81 0.71 0.60 VERIZONWRLS 0.95 0.52 1.18 1.32 1.28 1.11 1.01 0.95 0.90 0.78 Retail stores SEARSROEBUCK 0.64 1.60 0.60 0.63 0.79 0.90 1.03 1.12 1.25 1.45 TJMAXX 0.68 1.46 0.71 0.66 0.83 0.96 1.02 1.12 1.22 1.32 TARGET 0.72 1.51 0.63 0.69 0.87 1.02 1.11 1.16 1.18 1.12 WALMART 0.82 1.77 0.82 0.82 0.88 0.89 0.92 0.97 1.00 1.11 STAPLES 0.69 1.72 0.71 0.55 0.68 0.88 0.97 1.06 1.19 1.54 STARBUCKS 0.82 0.47 0.81 0.88 1.04 1.21 1.23 1.23 1.19 1.14 PAYPAL 1.13 1.51 1.03 0.86 0.82 0.91 1.00 0.90 0.92 0.93 Groceries PUBLIX 0.84 3.16 0.35 0.45 0.56 0.72 0.83 0.86 0.94 1.27 MENARDS 0.75 3.66 0.42 0.38 0.55 0.71 0.77 0.93 0.85 0.98 KROGER 0.79 1.13 0.79 0.87 1.00 1.01 1.03 1.10 1.09 1.20 Gas and convenience stores EXXONMOBIL 1.07 0.93 1.04 1.03 1.01 0.99 1.00 0.96 0.96 1.01 SHEETZ 0.87 0.36 0.91 1.01 0.96 0.96 1.04 1.21 1.37 1.31 SHELLOIL 1.12 1.04 1.03 1.04 1.01 1.01 0.98 0.93 0.93 0.91 SPEEDWAY 1.17 0.90 1.25 1.24 1.16 1.04 0.97 0.87 0.77 0.63 Hotels HILTON 0.69 1.70 0.49 0.53 0.76 1.02 1.15 1.14 1.16 1.36 RAMADAINN 0.75 2.29 0.40 0.64 0.90 0.88 1.00 1.10 0.90 1.13 RESIDENCEINN 0.92 1.94 0.56 0.73 0.68 0.84 1.00 0.82 0.97 1.55 ROYALINN 0.23 0.87 1.07 0.81 0.99 0.85 0.78 0.49 1.04 2.87 Target’s marketing to higher income households seems to have worked
  15. 15 © Copyright 2012 EMC Corporation. All rights reserved. Data

    Computing Division Segment Profiles Index: % segment / % population Cohort 1 Cohort 2 Cohort 3 Cohort 4 Cohort 5 Cohort 6 Cohort 7 Cohort 8 Cohort 9 Cohort 10 Cellular telephone providers ATT 1.00 0.86 1.18 1.24 1.14 1.04 0.97 0.91 0.86 0.79 SPRINT 1.75 0.55 1.93 1.72 1.15 0.81 0.67 0.56 0.50 0.36 TMOBILE 1.35 0.95 1.38 1.36 1.06 0.86 0.92 0.81 0.71 0.60 VERIZONWRLS 0.95 0.52 1.18 1.32 1.28 1.11 1.01 0.95 0.90 0.78 Retail stores SEARSROEBUCK 0.64 1.60 0.60 0.63 0.79 0.90 1.03 1.12 1.25 1.45 TJMAXX 0.68 1.46 0.71 0.66 0.83 0.96 1.02 1.12 1.22 1.32 TARGET 0.72 1.51 0.63 0.69 0.87 1.02 1.11 1.16 1.18 1.12 WALMART 0.82 1.77 0.82 0.82 0.88 0.89 0.92 0.97 1.00 1.11 STAPLES 0.69 1.72 0.71 0.55 0.68 0.88 0.97 1.06 1.19 1.54 STARBUCKS 0.82 0.47 0.81 0.88 1.04 1.21 1.23 1.23 1.19 1.14 PAYPAL 1.13 1.51 1.03 0.86 0.82 0.91 1.00 0.90 0.92 0.93 Groceries PUBLIX 0.84 3.16 0.35 0.45 0.56 0.72 0.83 0.86 0.94 1.27 MENARDS 0.75 3.66 0.42 0.38 0.55 0.71 0.77 0.93 0.85 0.98 KROGER 0.79 1.13 0.79 0.87 1.00 1.01 1.03 1.10 1.09 1.20 Gas and convenience stores EXXONMOBIL 1.07 0.93 1.04 1.03 1.01 0.99 1.00 0.96 0.96 1.01 SHEETZ 0.87 0.36 0.91 1.01 0.96 0.96 1.04 1.21 1.37 1.31 SHELLOIL 1.12 1.04 1.03 1.04 1.01 1.01 0.98 0.93 0.93 0.91 SPEEDWAY 1.17 0.90 1.25 1.24 1.16 1.04 0.97 0.87 0.77 0.63 Hotels HILTON 0.69 1.70 0.49 0.53 0.76 1.02 1.15 1.14 1.16 1.36 RAMADAINN 0.75 2.29 0.40 0.64 0.90 0.88 1.00 1.10 0.90 1.13 RESIDENCEINN 0.92 1.94 0.56 0.73 0.68 0.84 1.00 0.82 0.97 1.55 ROYALINN 0.23 0.87 1.07 0.81 0.99 0.85 0.78 0.49 1.04 2.87 AT&T and Verizon appear to be gaining more high value customers
  16. 16 © Copyright 2012 EMC Corporation. All rights reserved. Data

    Computing Division Summary of Findings •  We cleaned and standardized merchant names and –  Found 1.1 million distinct merchants from the original 113+ million –  Discovered 90% of transactions and 90% of the money spent happened at less than 10% of the merchants –  Identified that ‘Sic Codes’ significantly differ across like businesses –  Identified differences in credit and debit purchase behavior –  In reaction to the announcement that Square made August 8th we used cleaned merchant names to evaluate the potential impact of the trend towards alternative payment methods using the clean merchant names •  Segmentation augmented by a value added metric –  We found that segmenting customers based on a rough measure of value added and combining that with transaction data can provide interesting insights –  Prediction of migration from low to high value segments seems possible