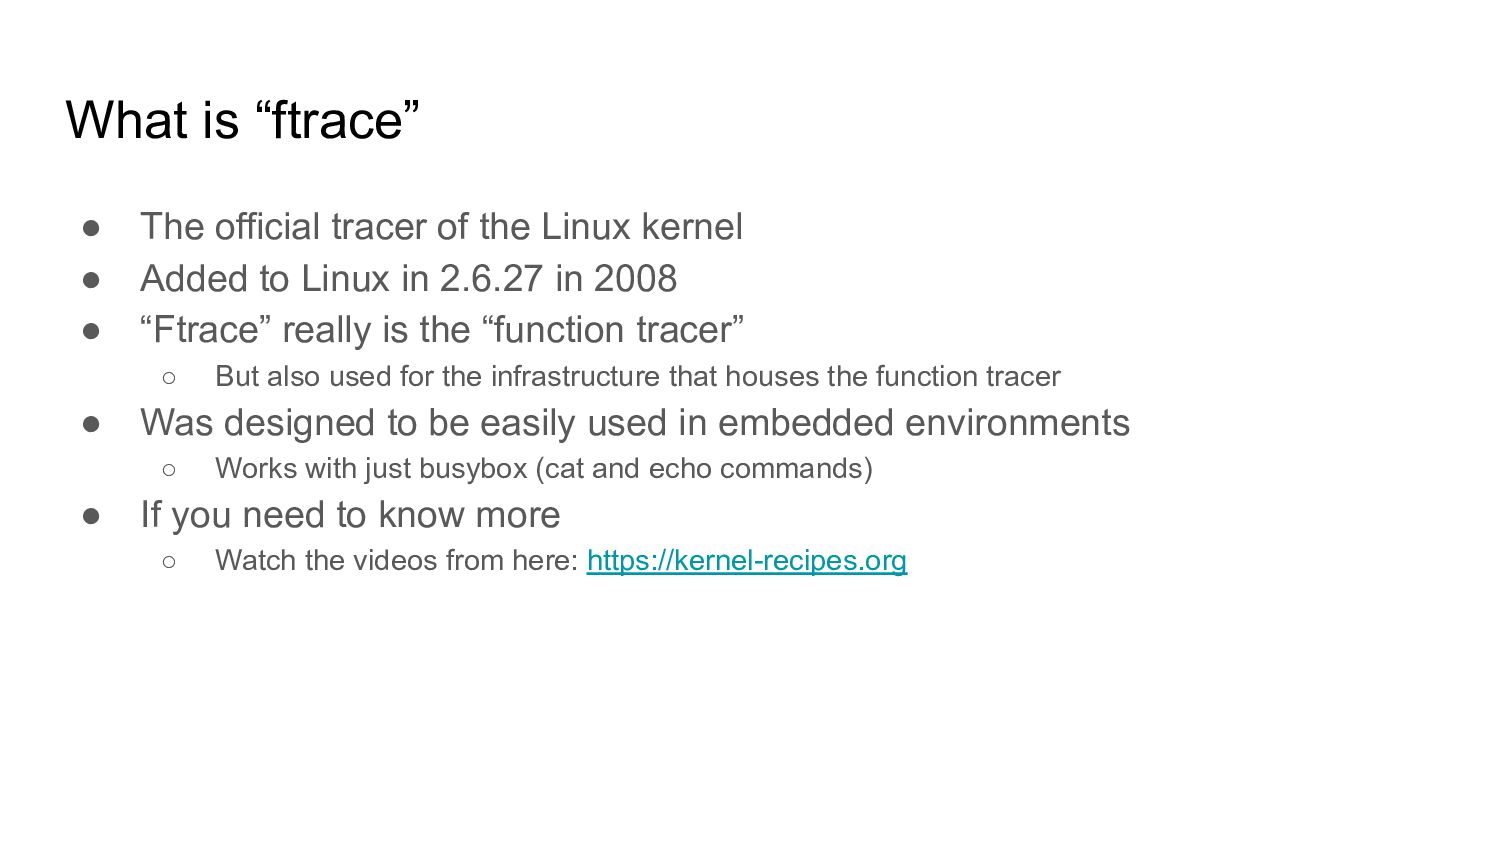
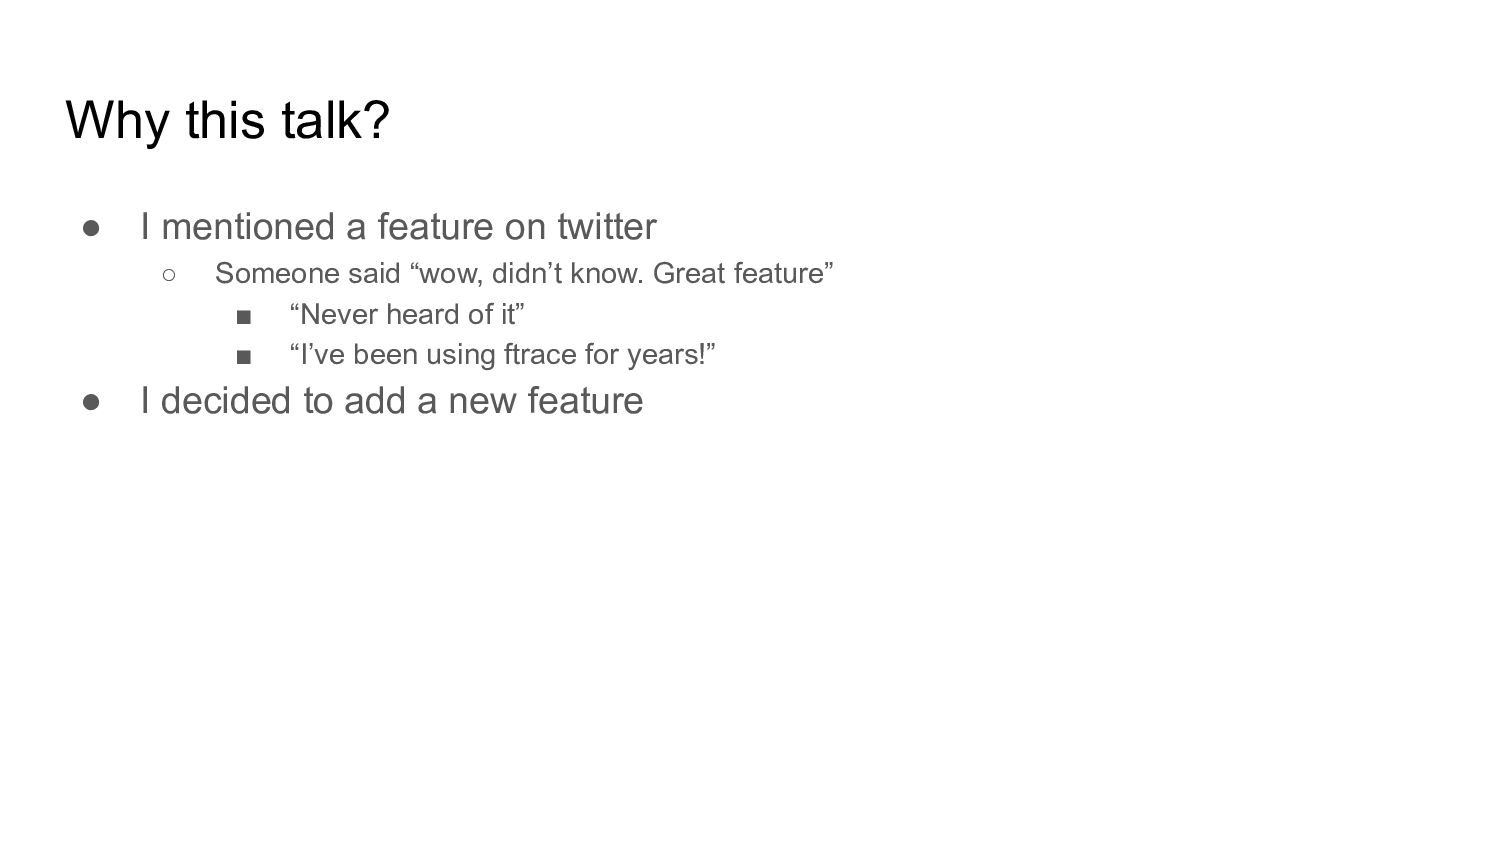
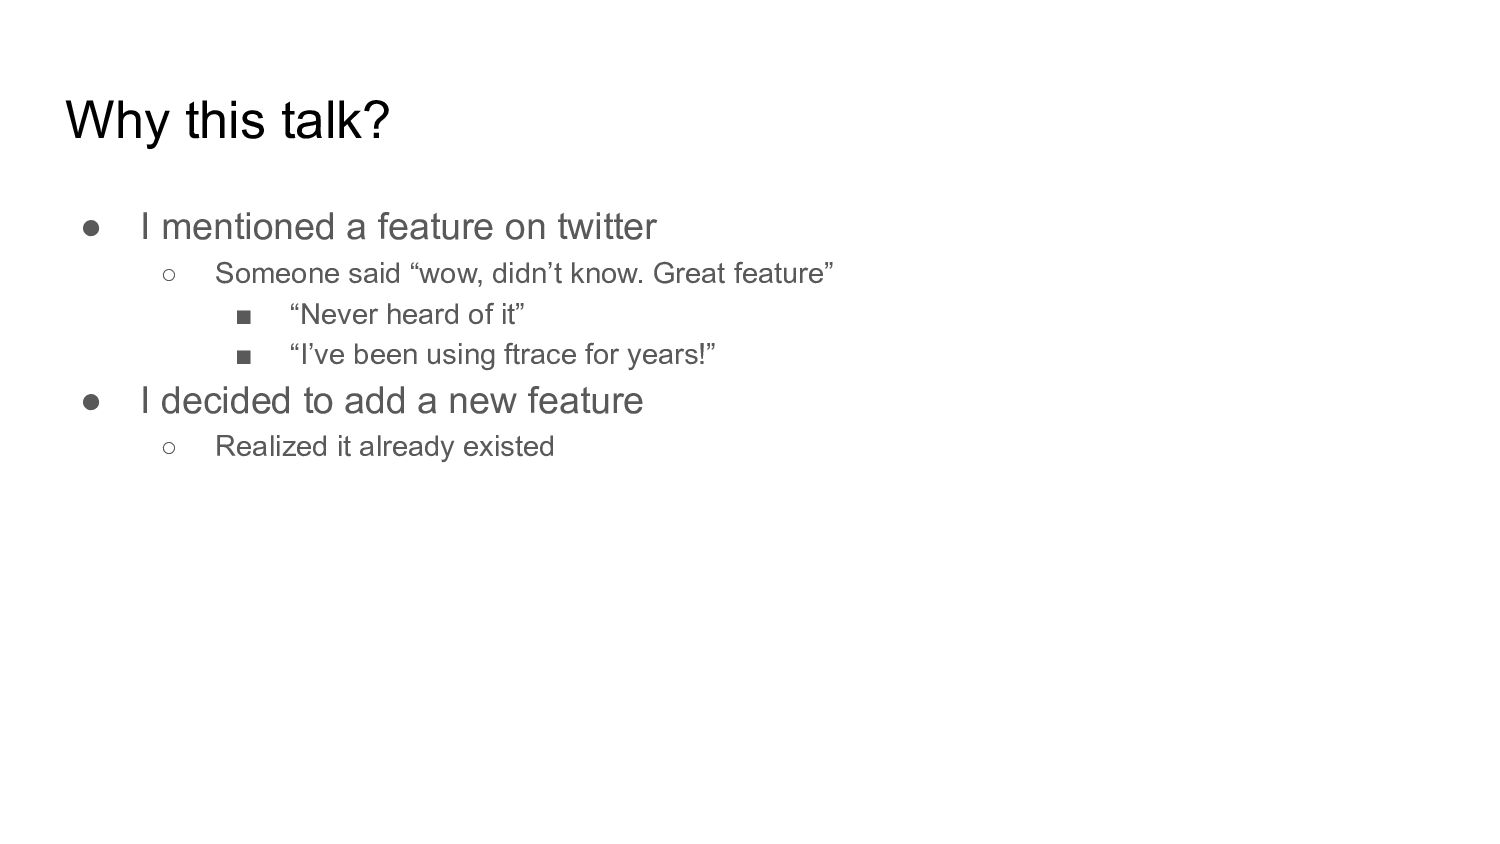
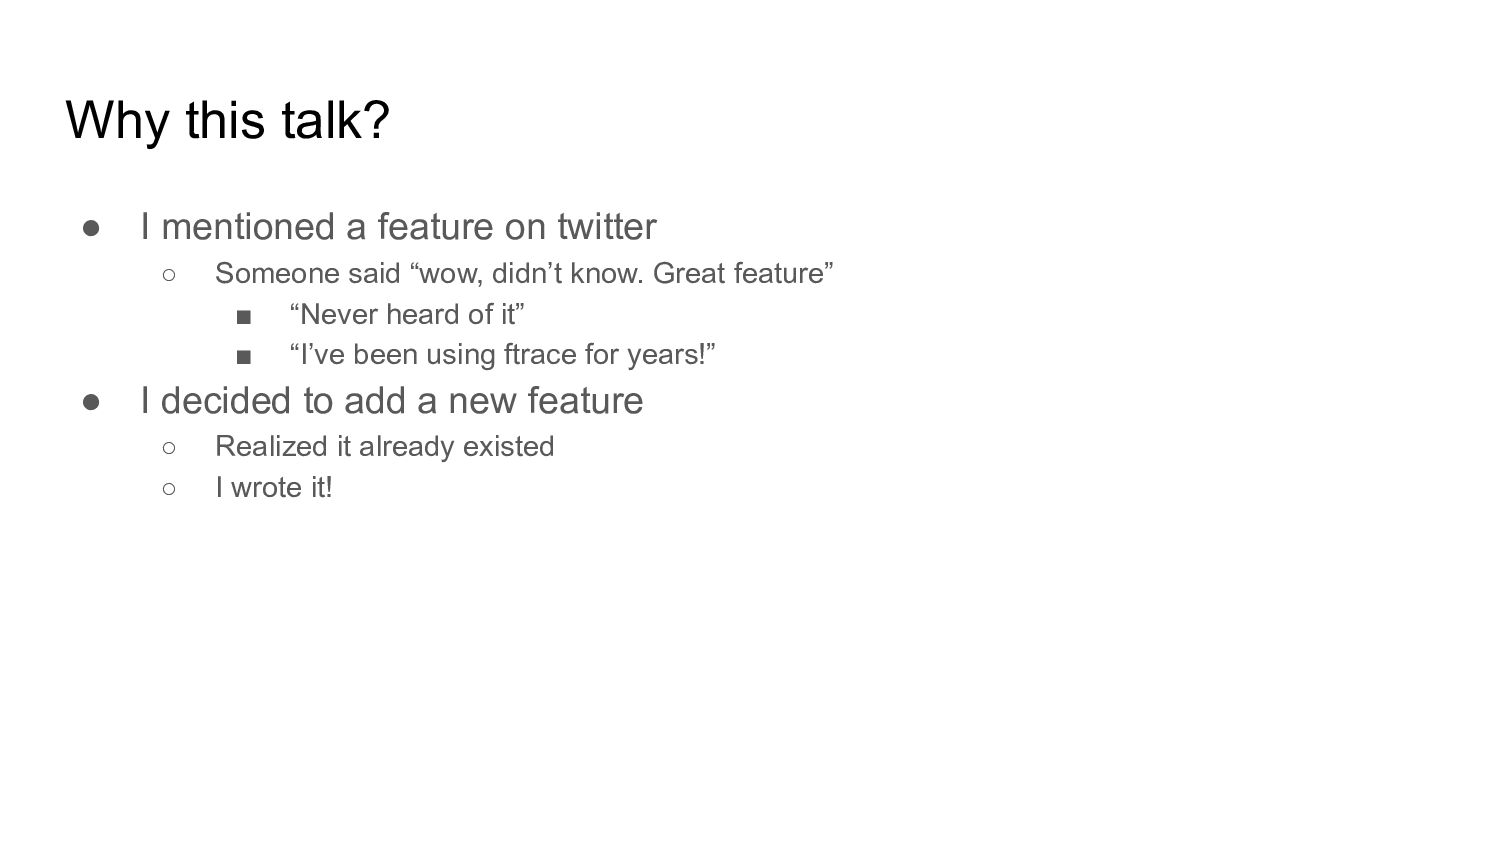
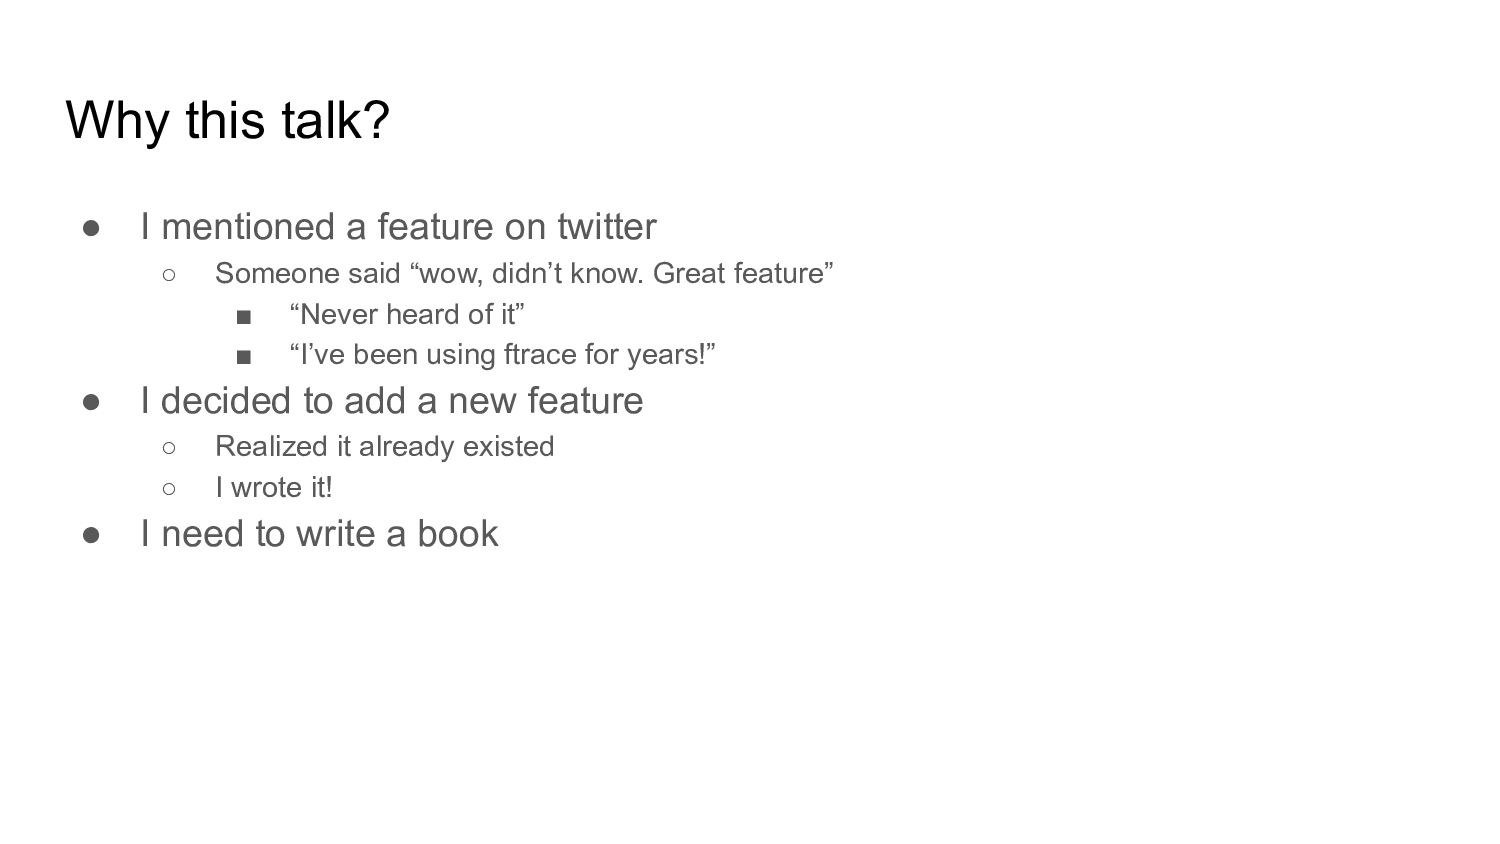
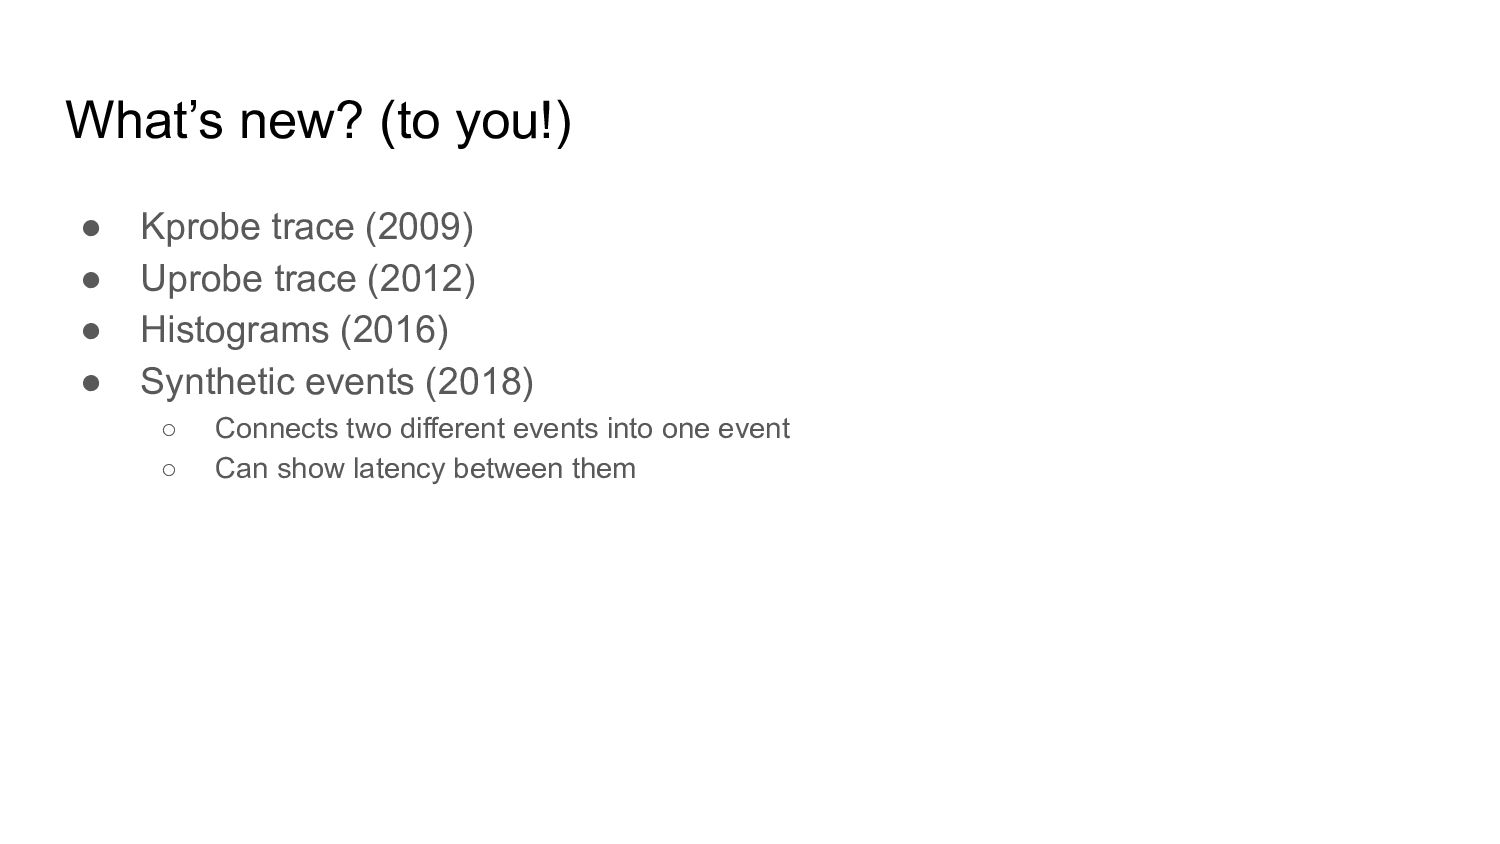
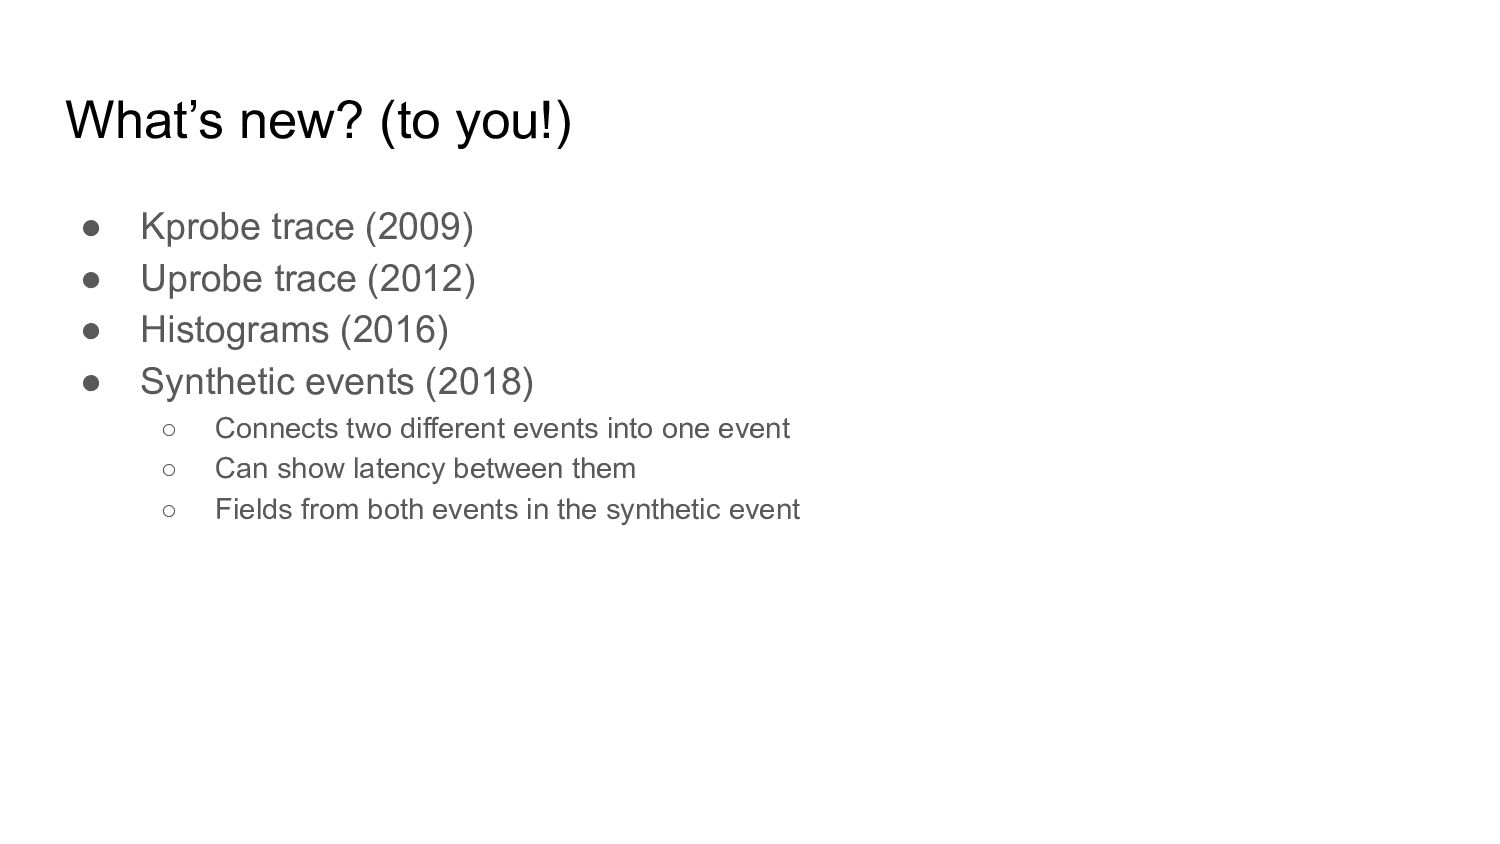
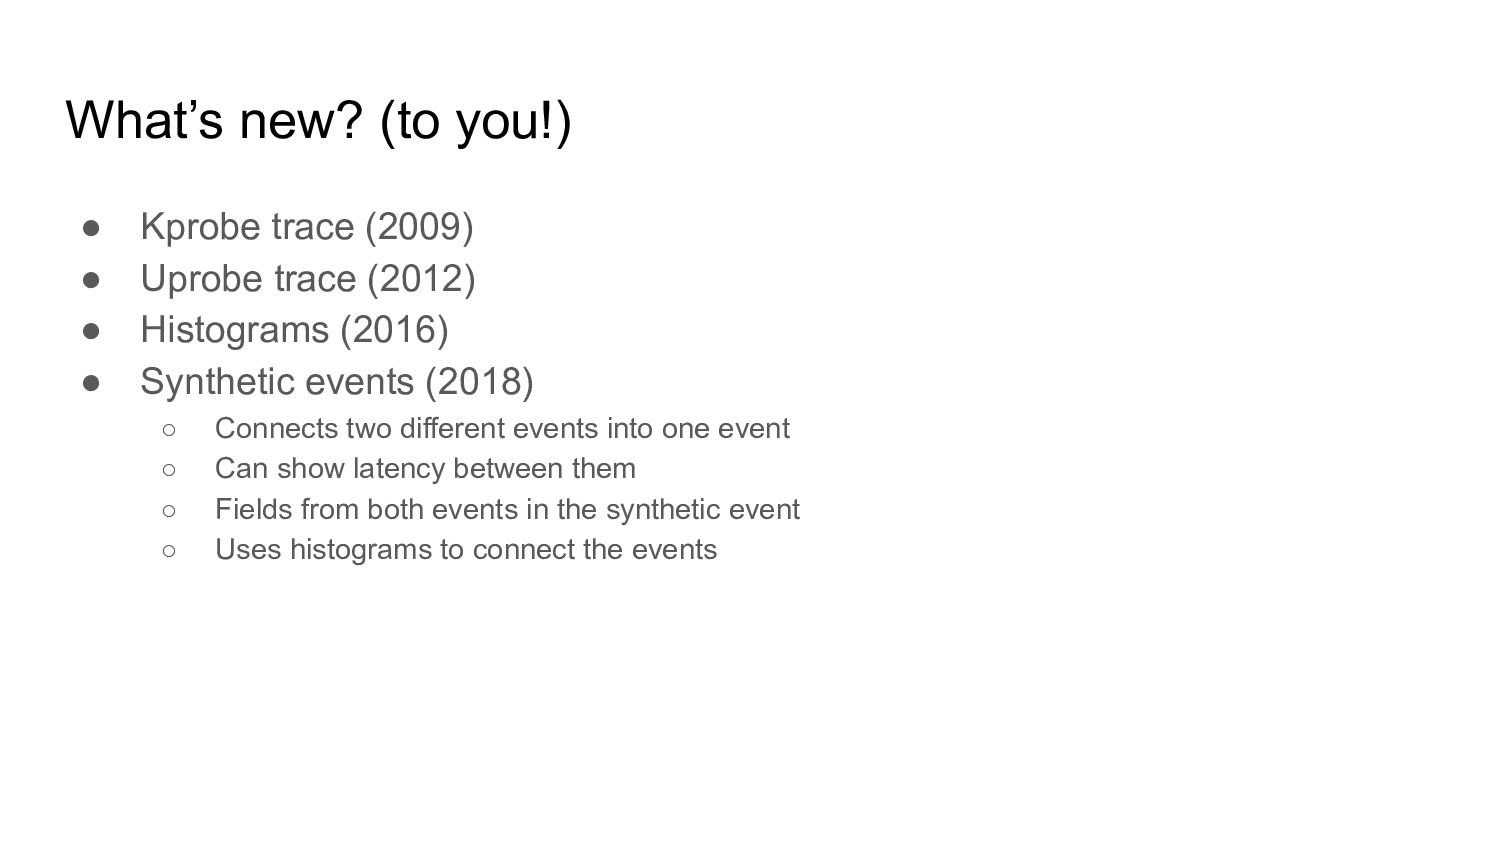
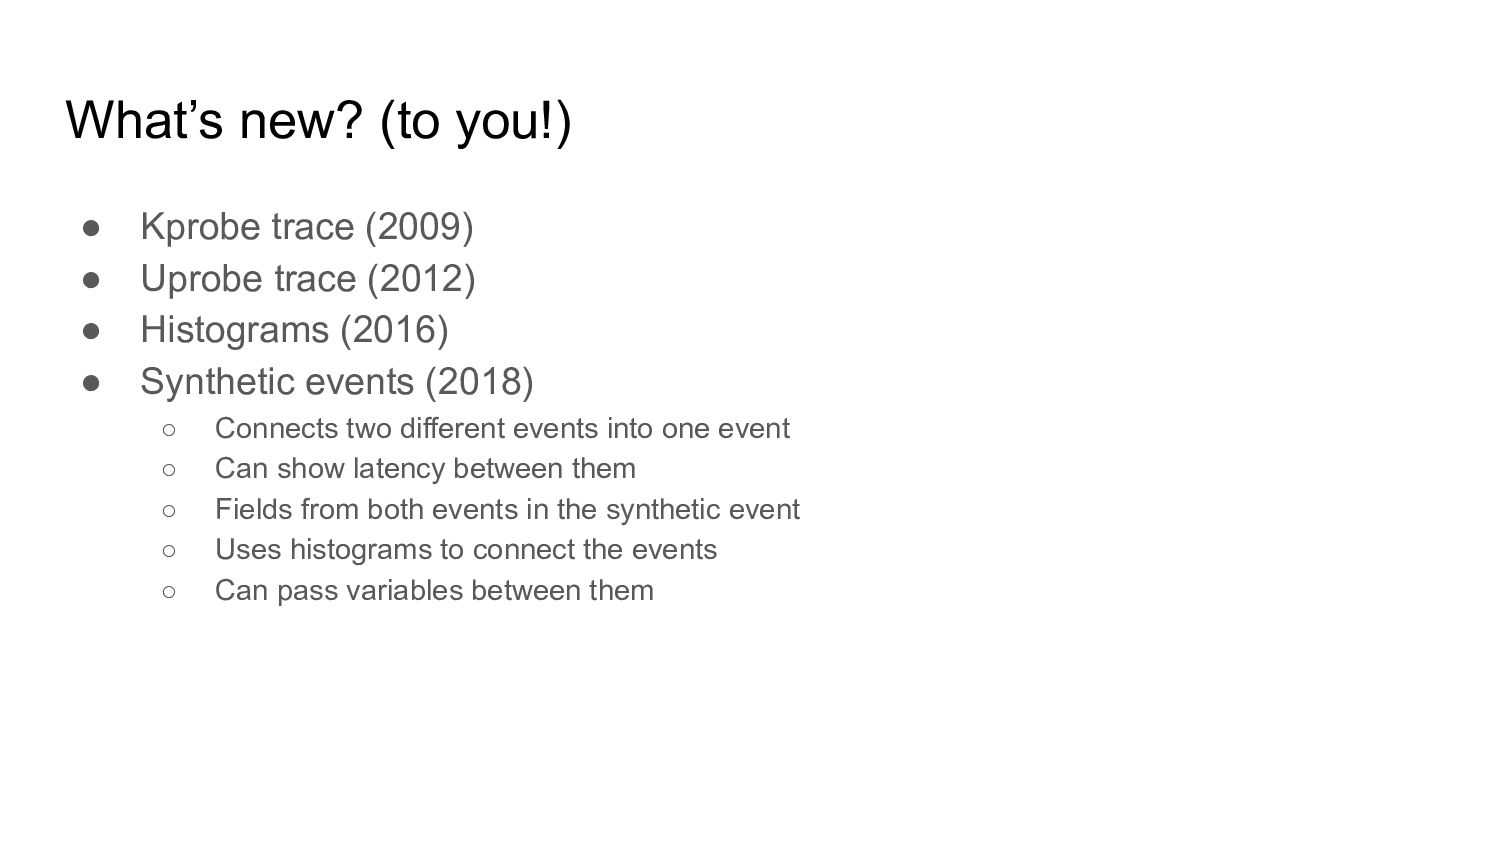
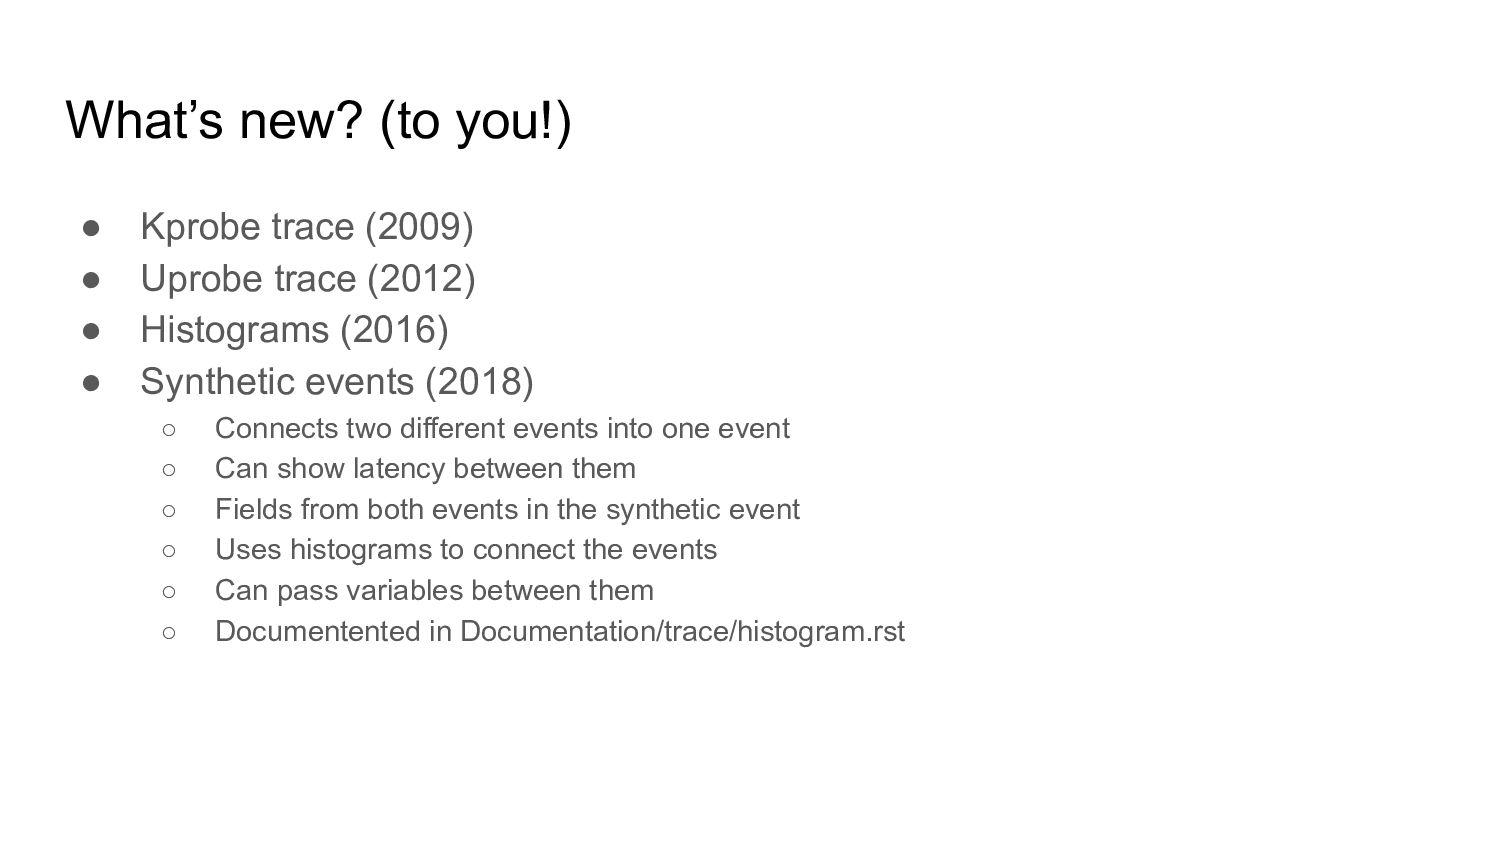
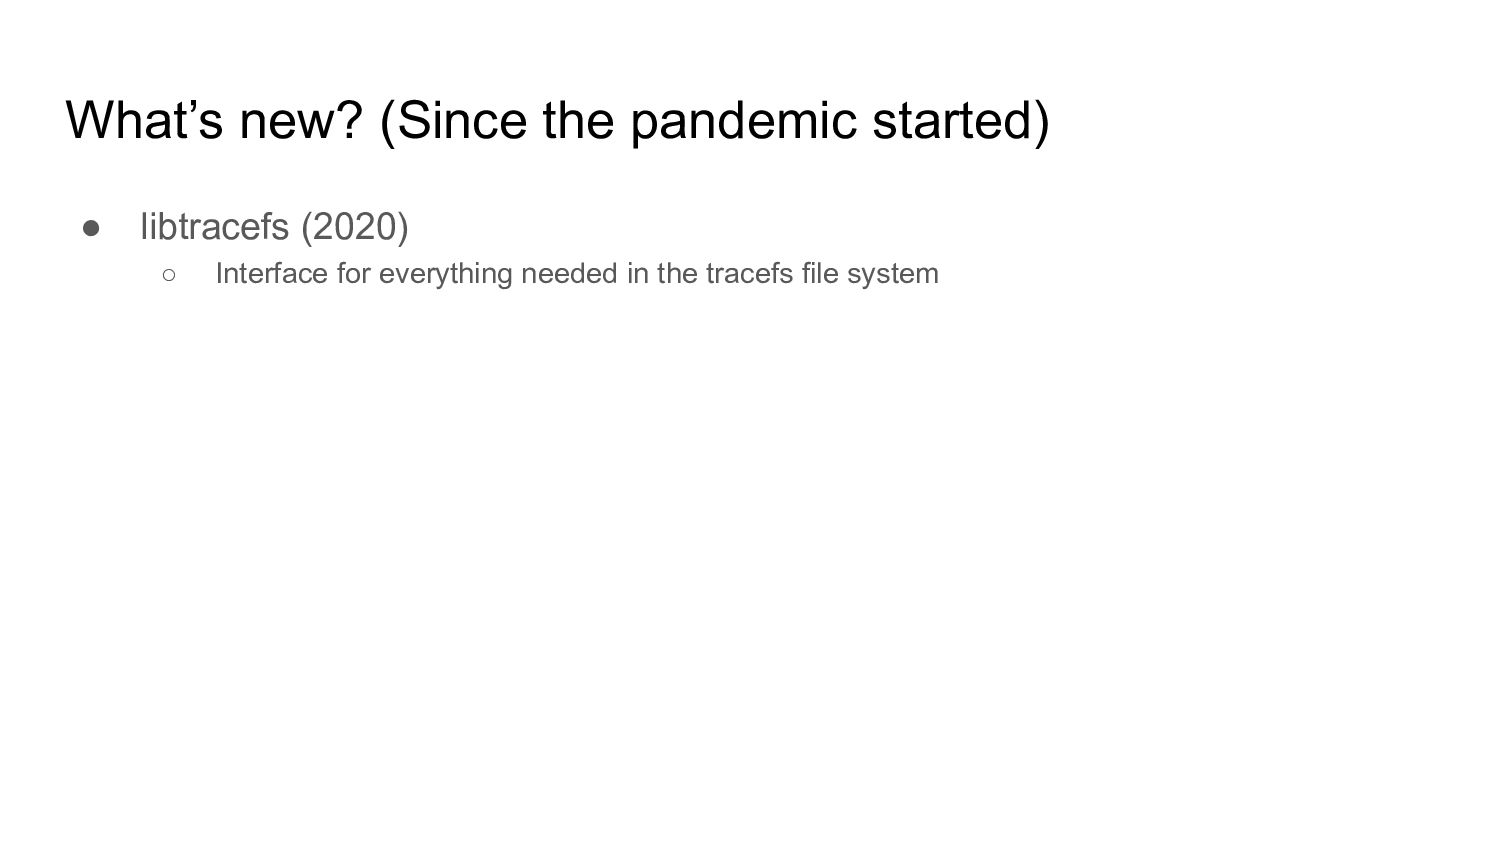
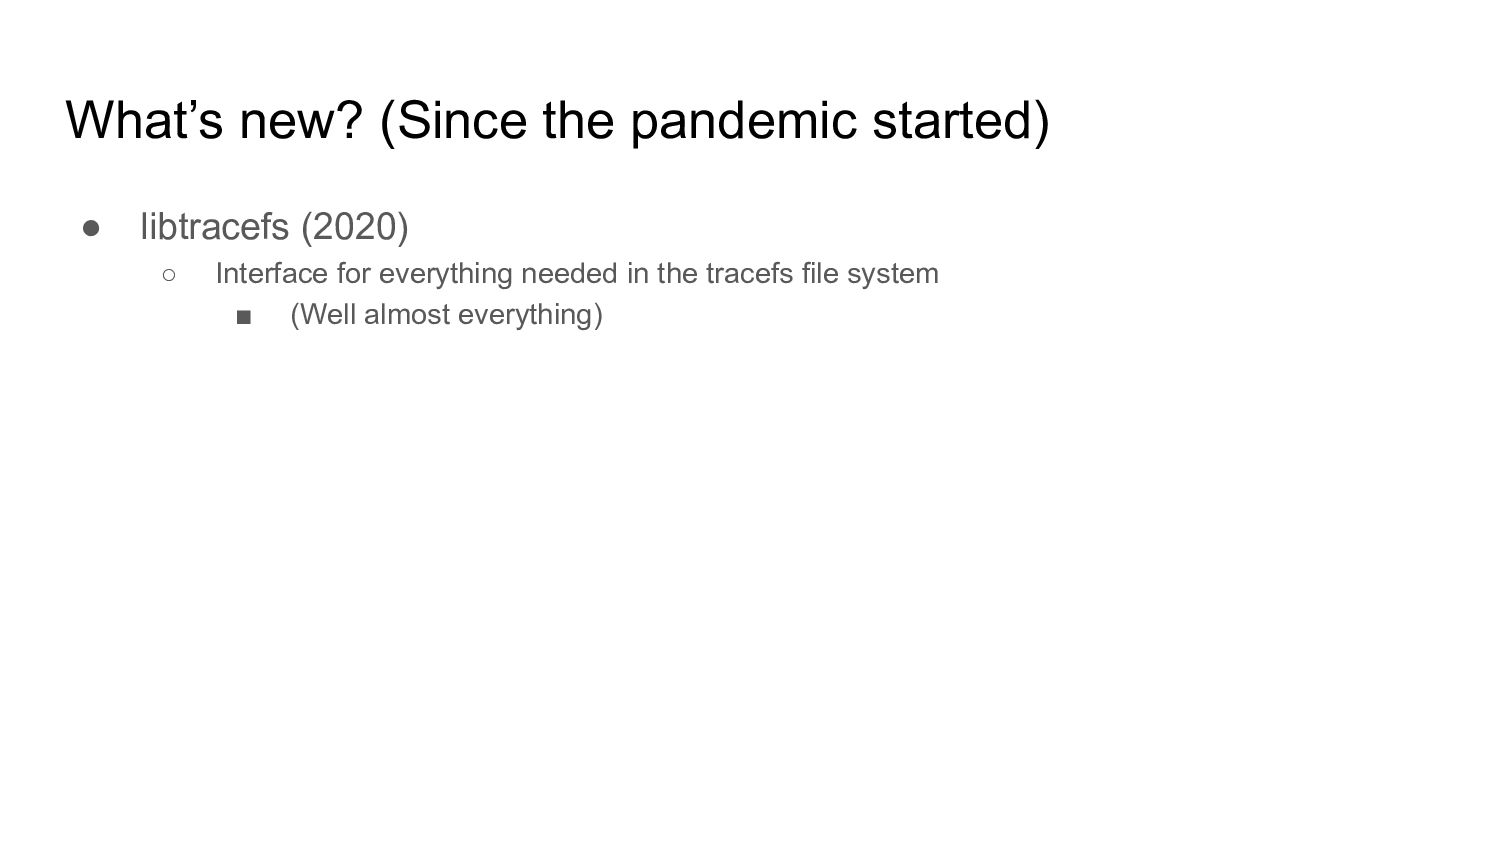
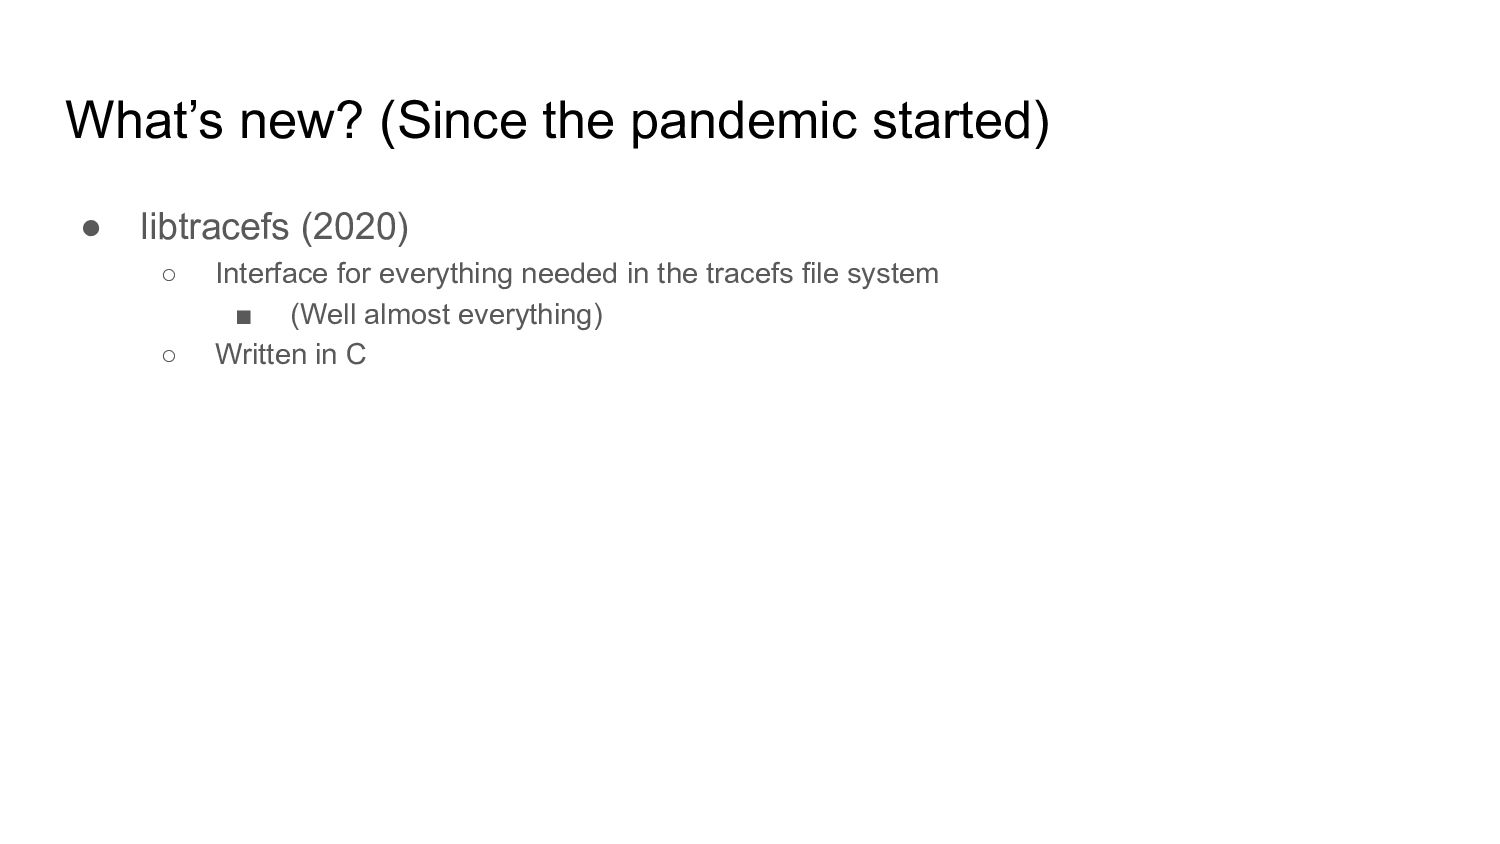
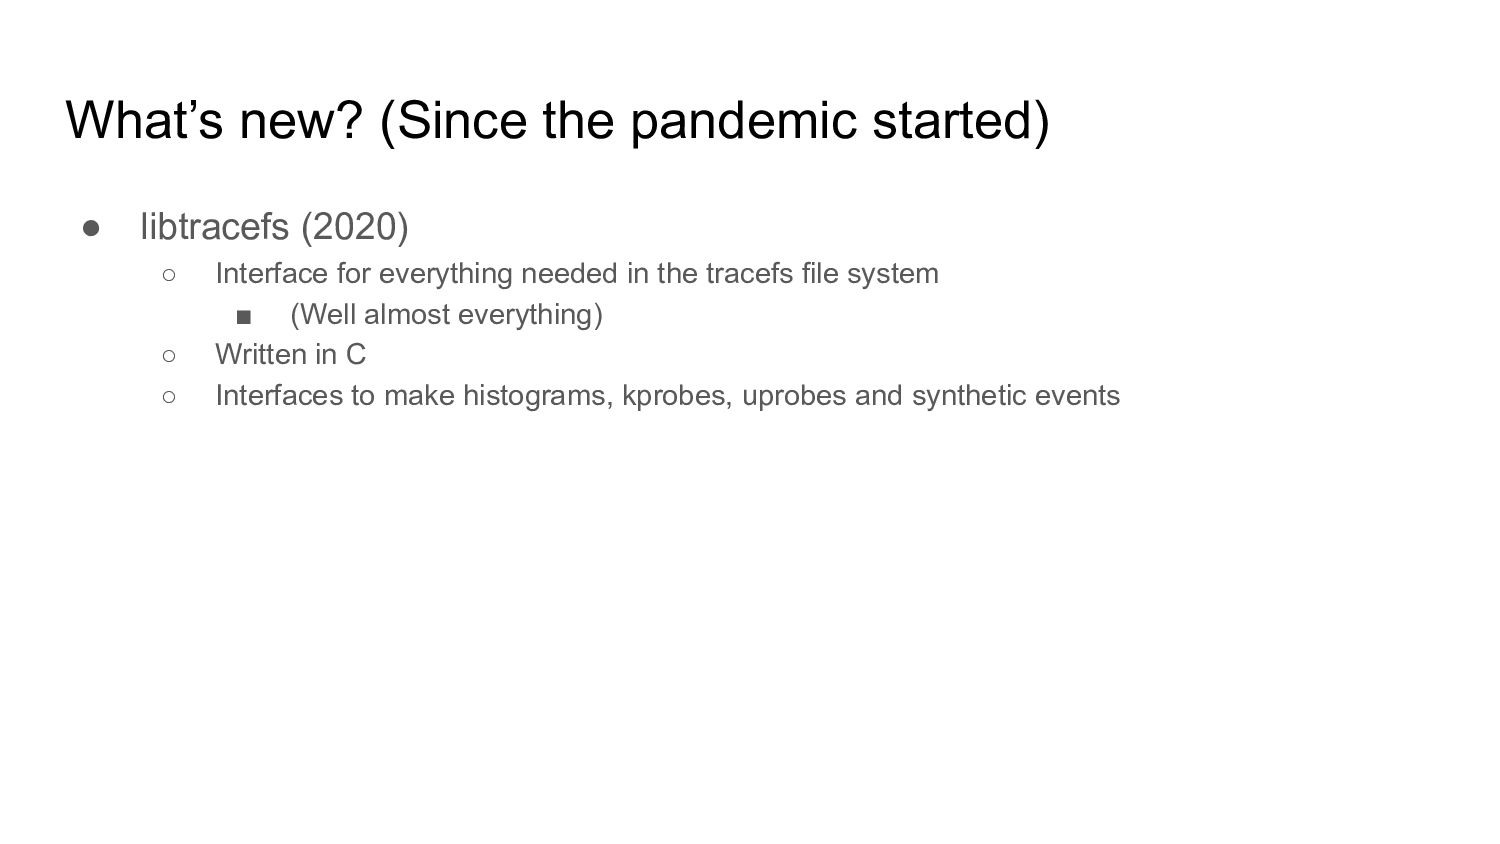
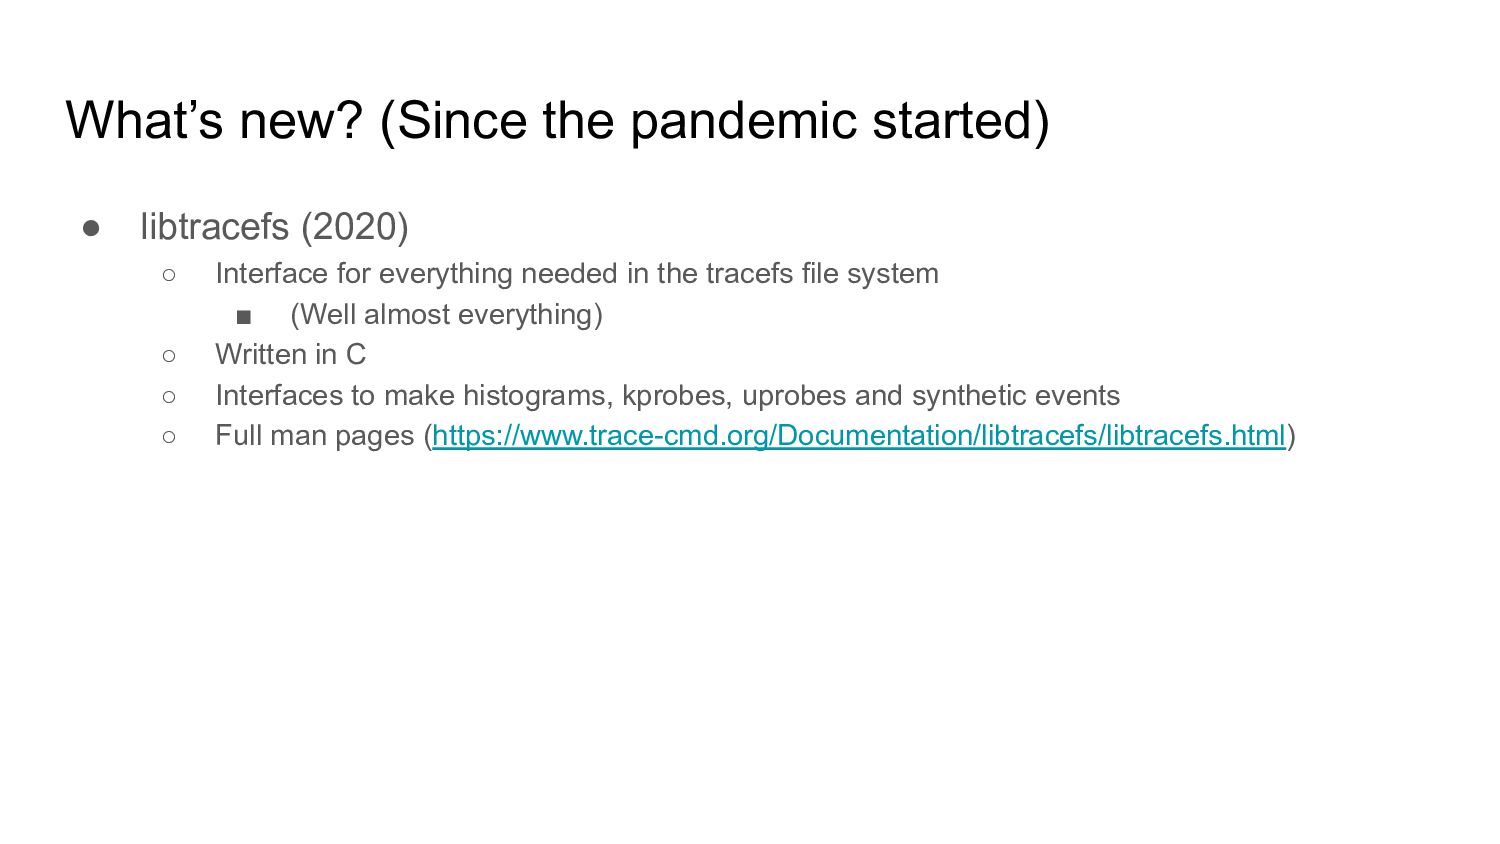
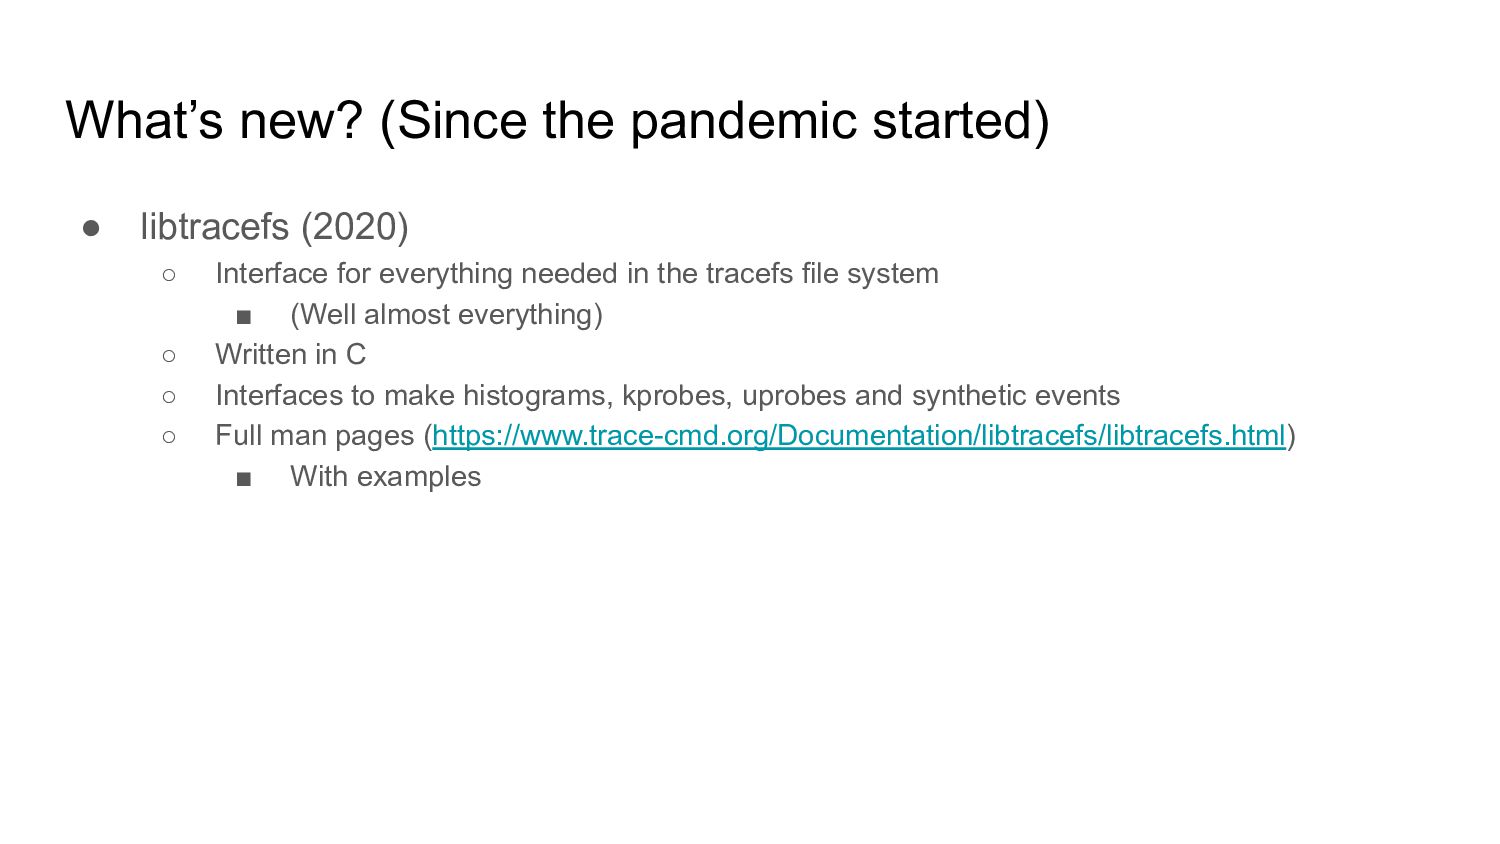
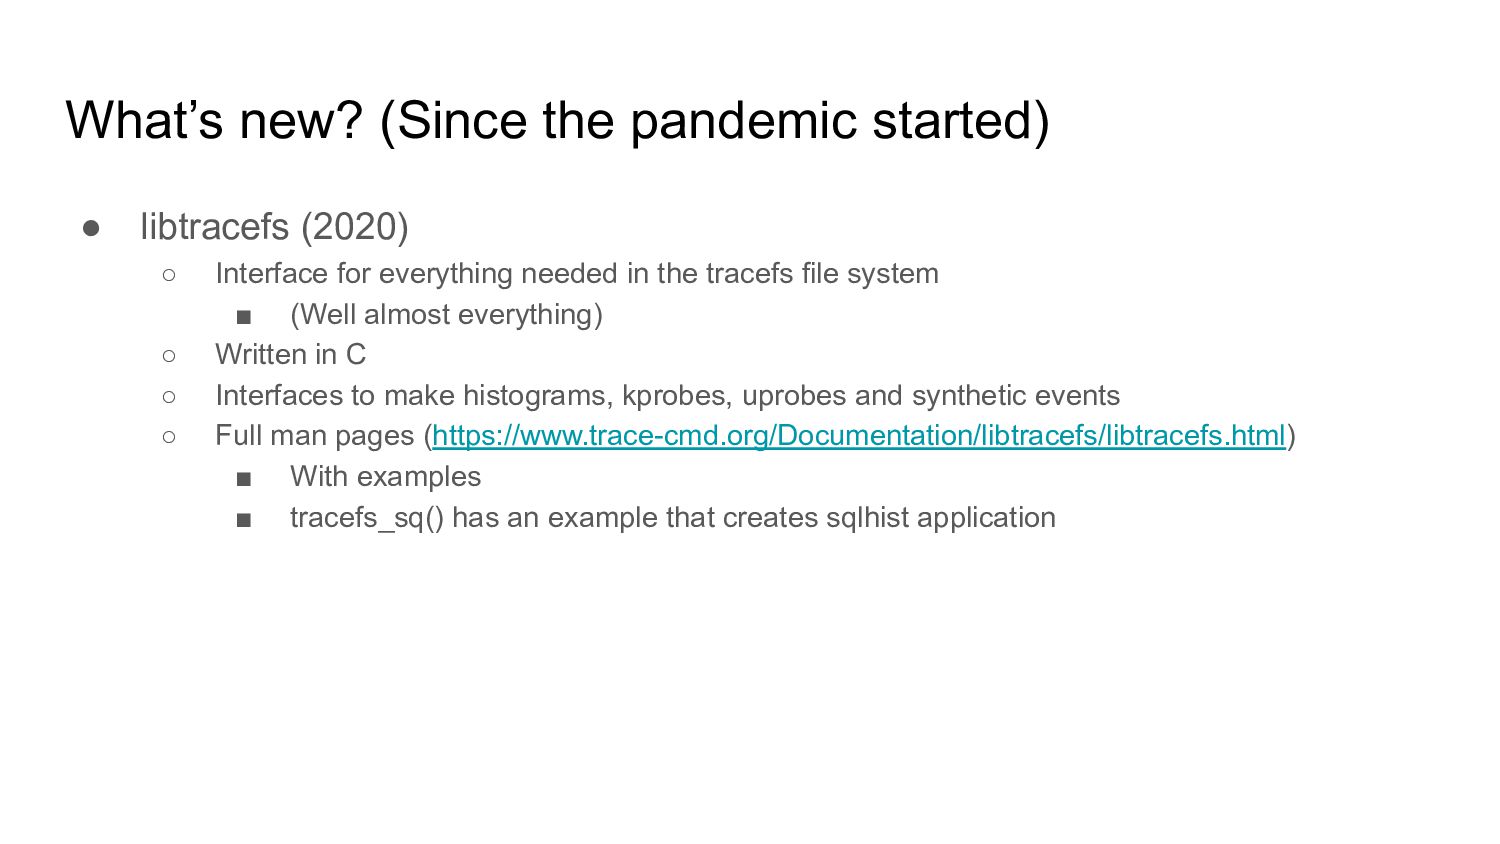
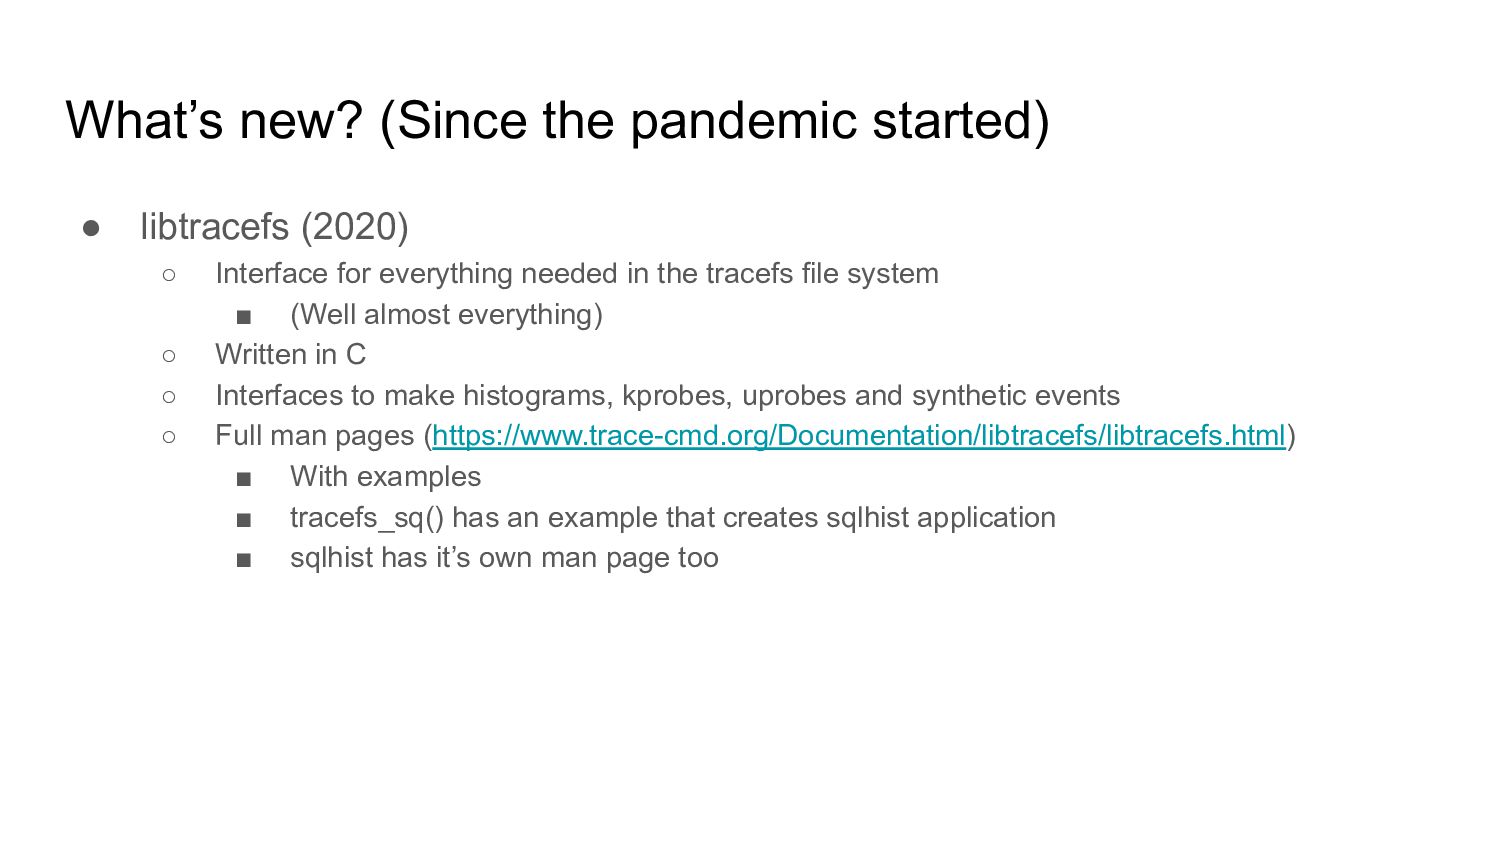
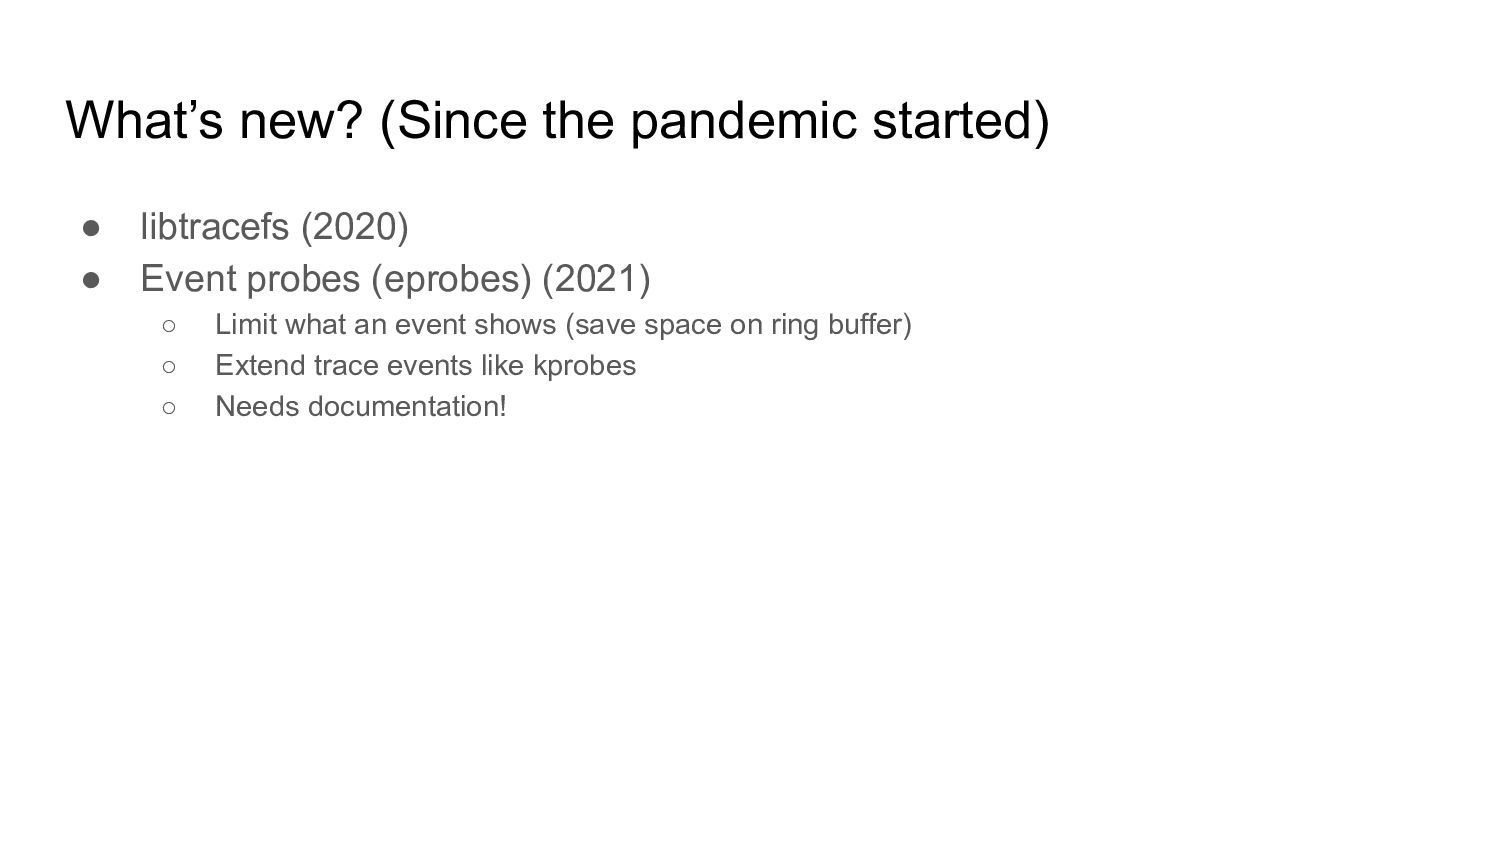
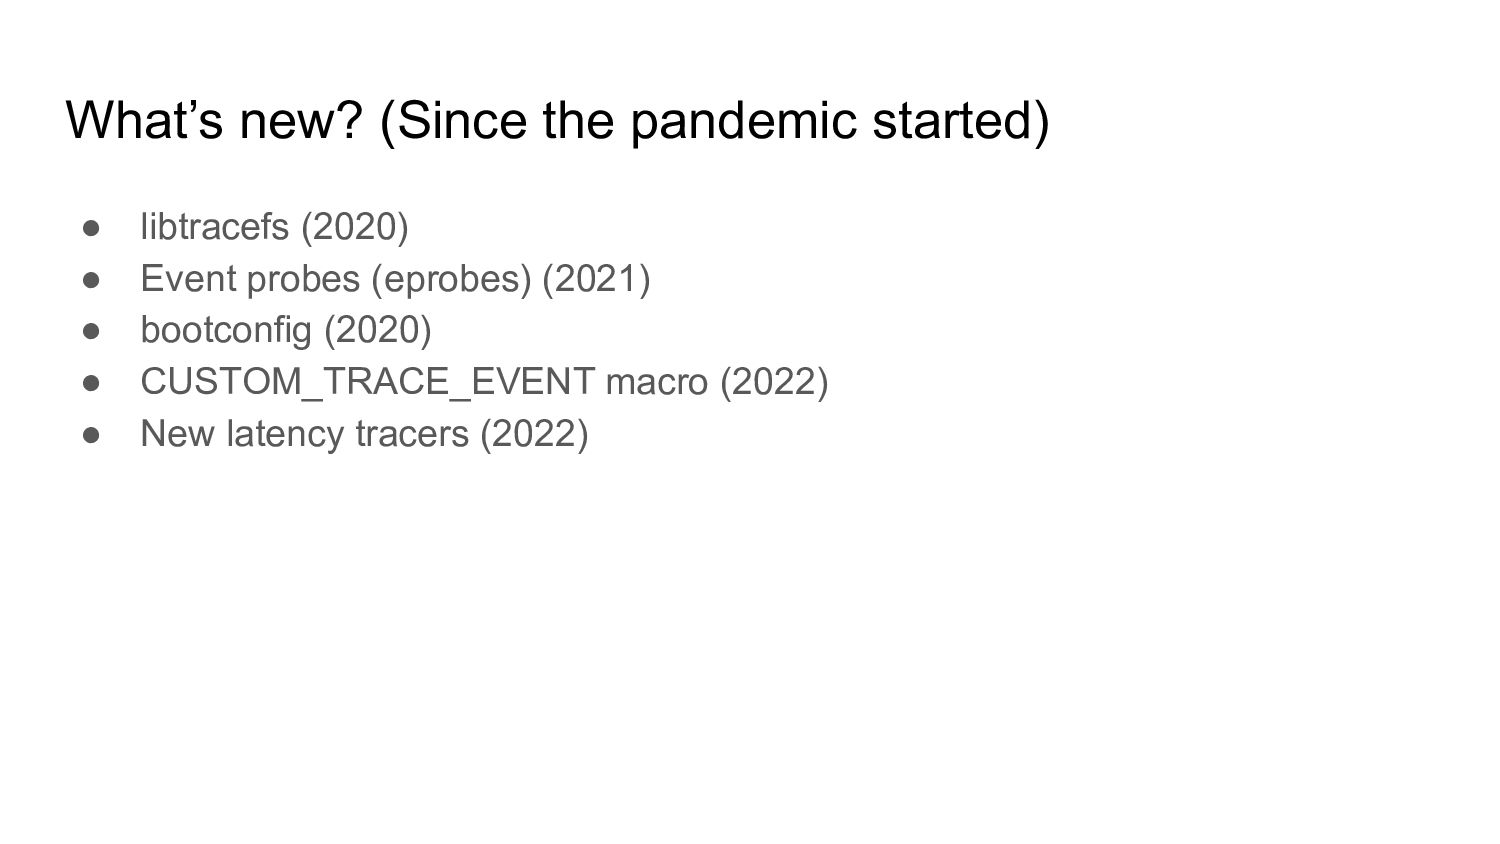
A lot of neat little features has been added to the ftrace tracing subsystem. This will go over what those are. From synthetic events to event probes. New triggers and even user events. If you don’t know what these are, then this talk will explain them to you.
Steven Rostedt
![Documentation/trace/kprobetrace.rst Synopsis of kprobe_events ------------------------- :: p[:[GRP/]EVENT] [MOD:]SYM[+offs]|MEMADDR [FETCHARGS] :](https://files.speakerdeck.com/presentations/2c09c35611a1429ea400d0c88d77c6d4/slide_23.jpg)
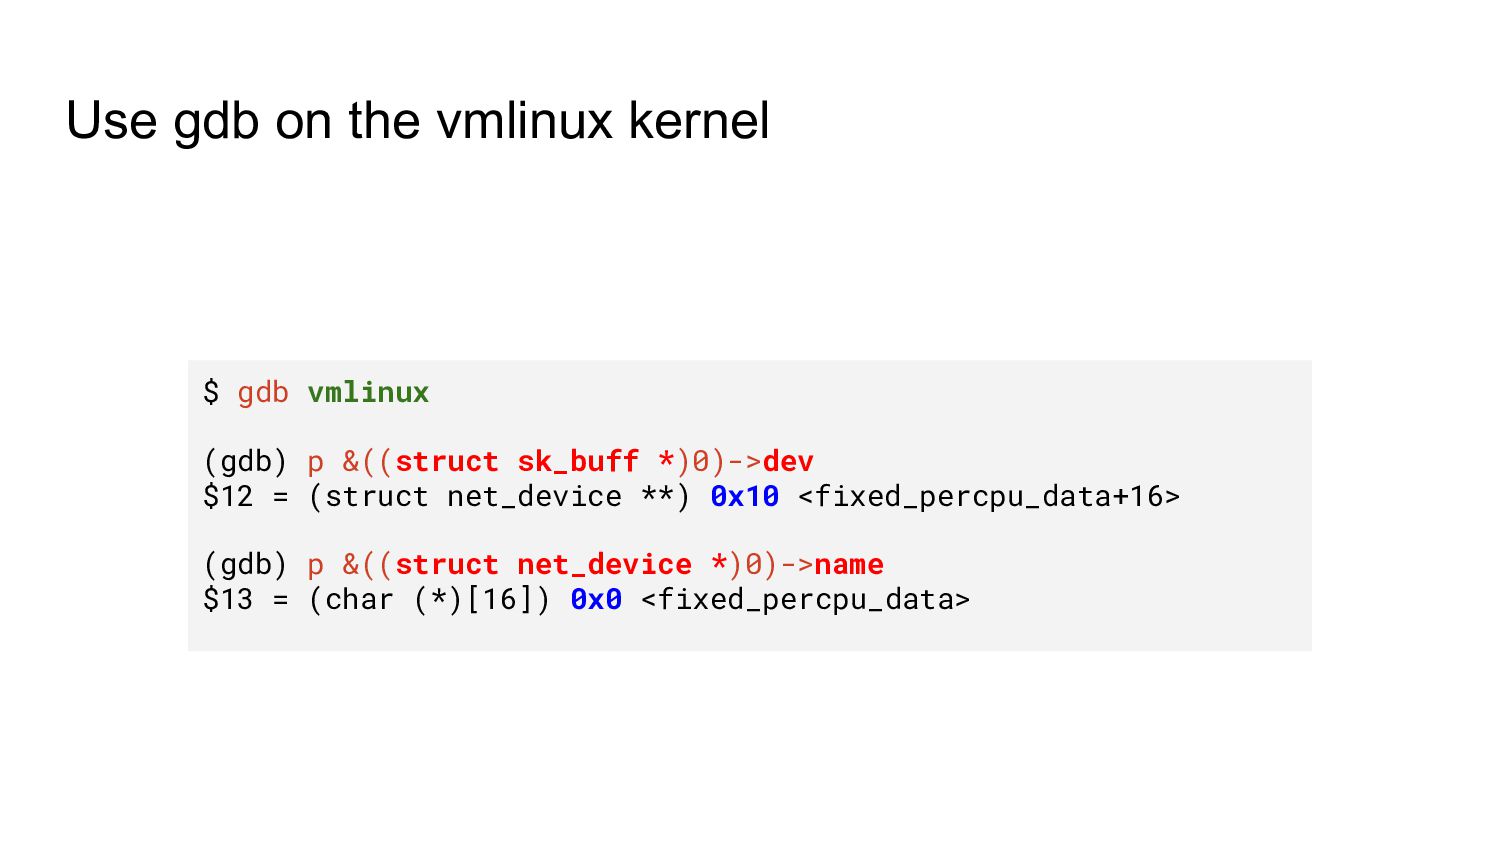
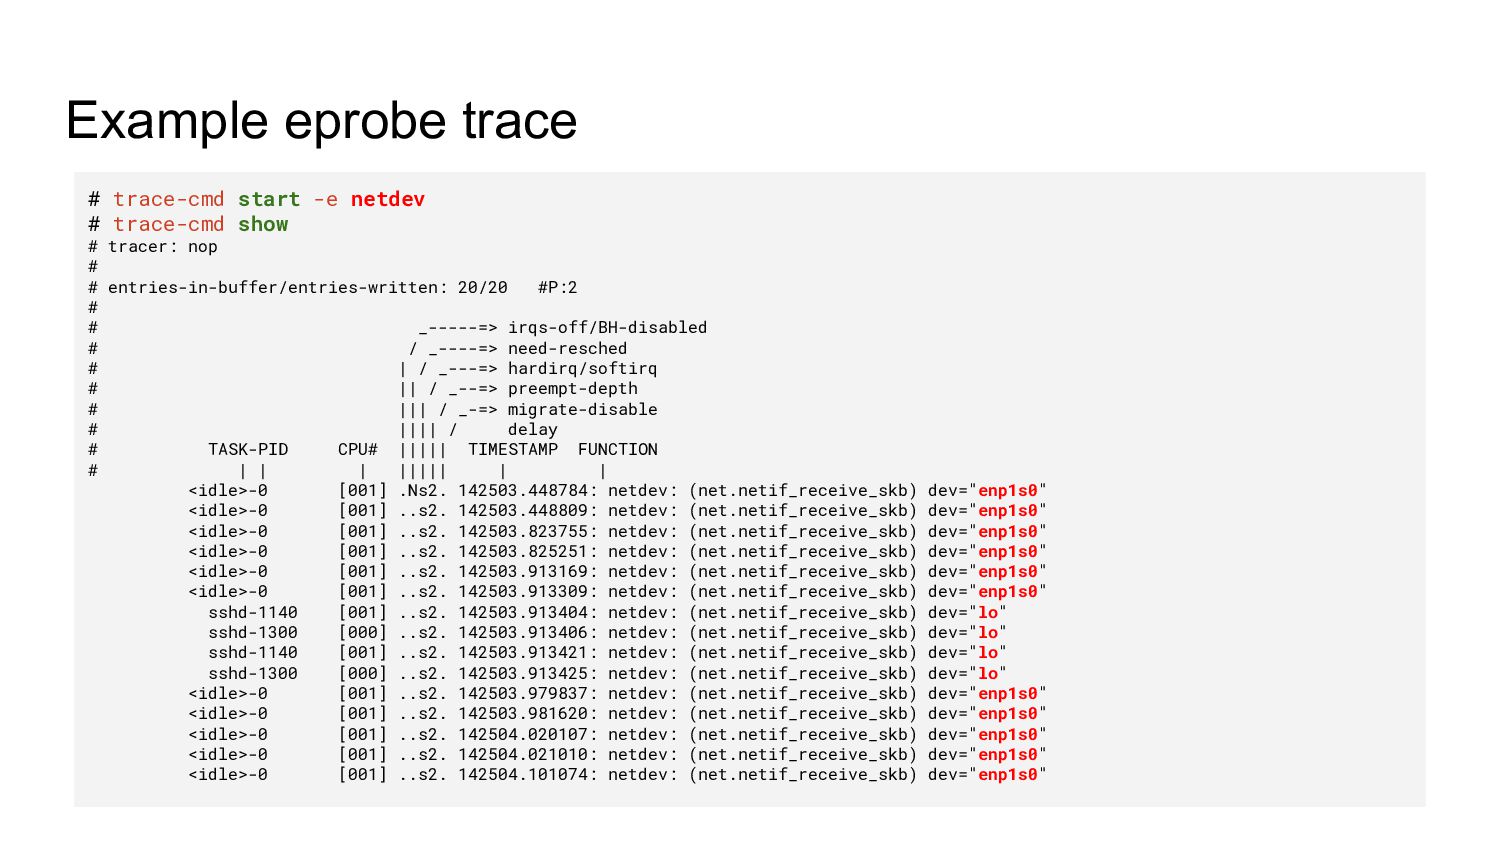
![include/linux/netdevice.h struct net_device { char name[IFNAMSIZ]; struct netdev_name_node *name_node; struct](https://files.speakerdeck.com/presentations/2c09c35611a1429ea400d0c88d77c6d4/slide_35.jpg)
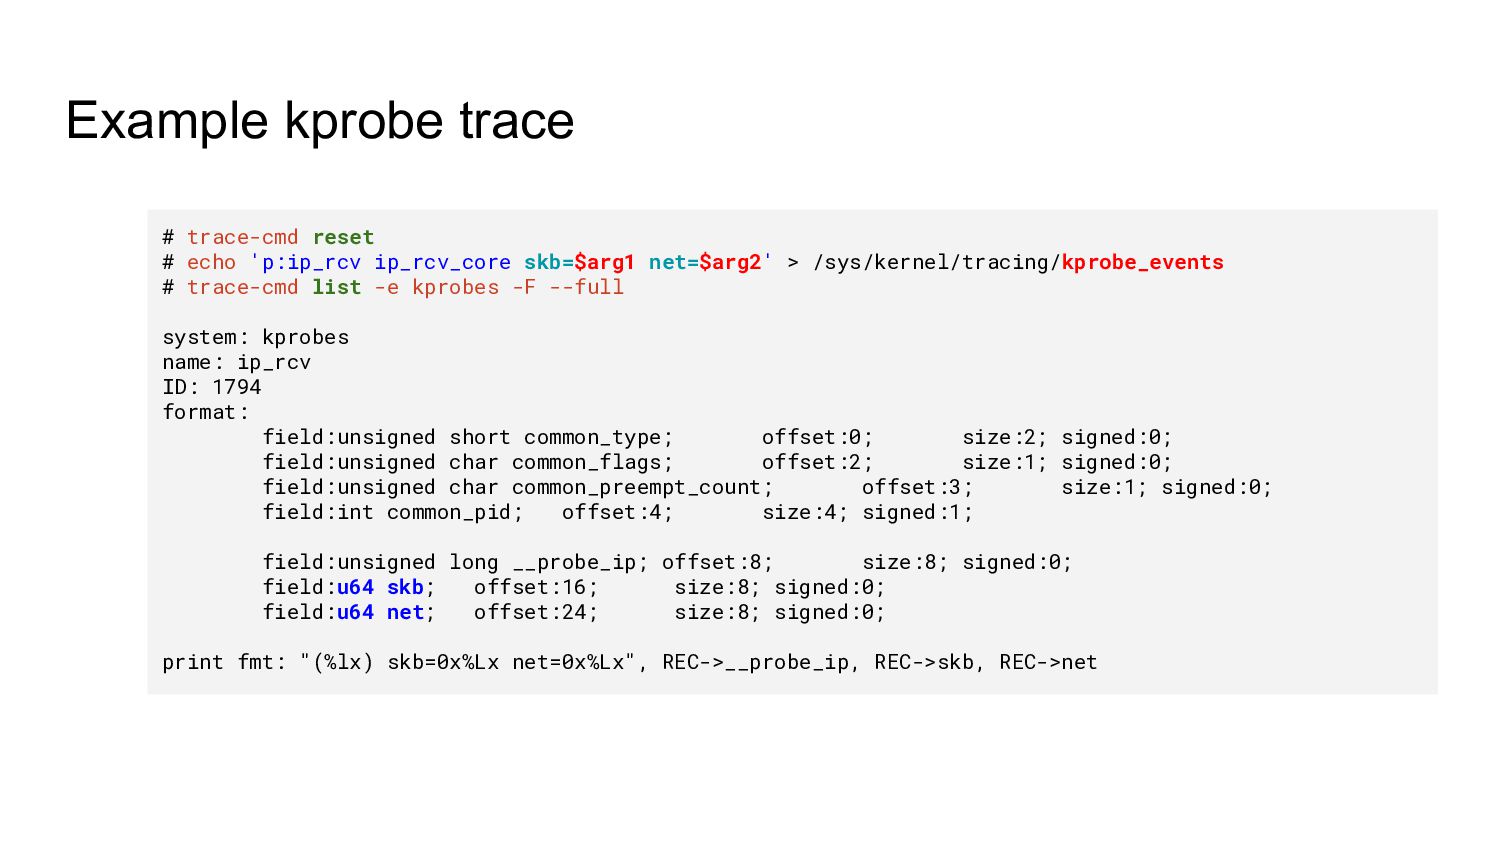
![Documentation/trace/kprobetrace.rst Synopsis of kprobe_events ------------------------- :: p[:[GRP/]EVENT] [MOD:]SYM[+offs]|MEMADDR [FETCHARGS] :](https://files.speakerdeck.com/presentations/2c09c35611a1429ea400d0c88d77c6d4/slide_43.jpg)
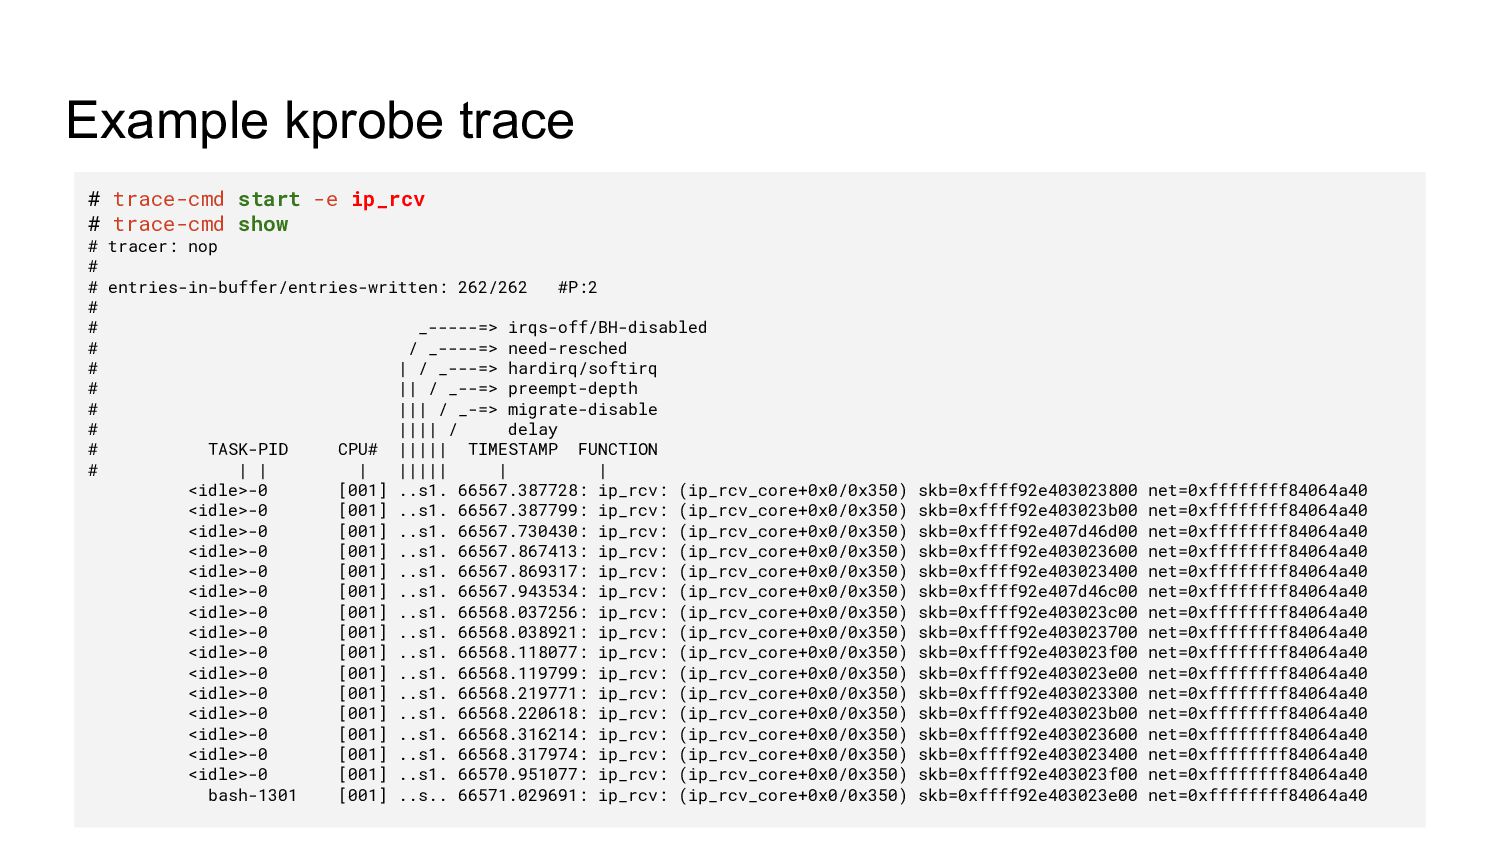
![Documentation/trace/kprobetrace.rst Synopsis of kprobe_events ------------------------- :: p[:[GRP/]EVENT] [MOD:]SYM[+offs]|MEMADDR [FETCHARGS] :](https://files.speakerdeck.com/presentations/2c09c35611a1429ea400d0c88d77c6d4/slide_44.jpg)
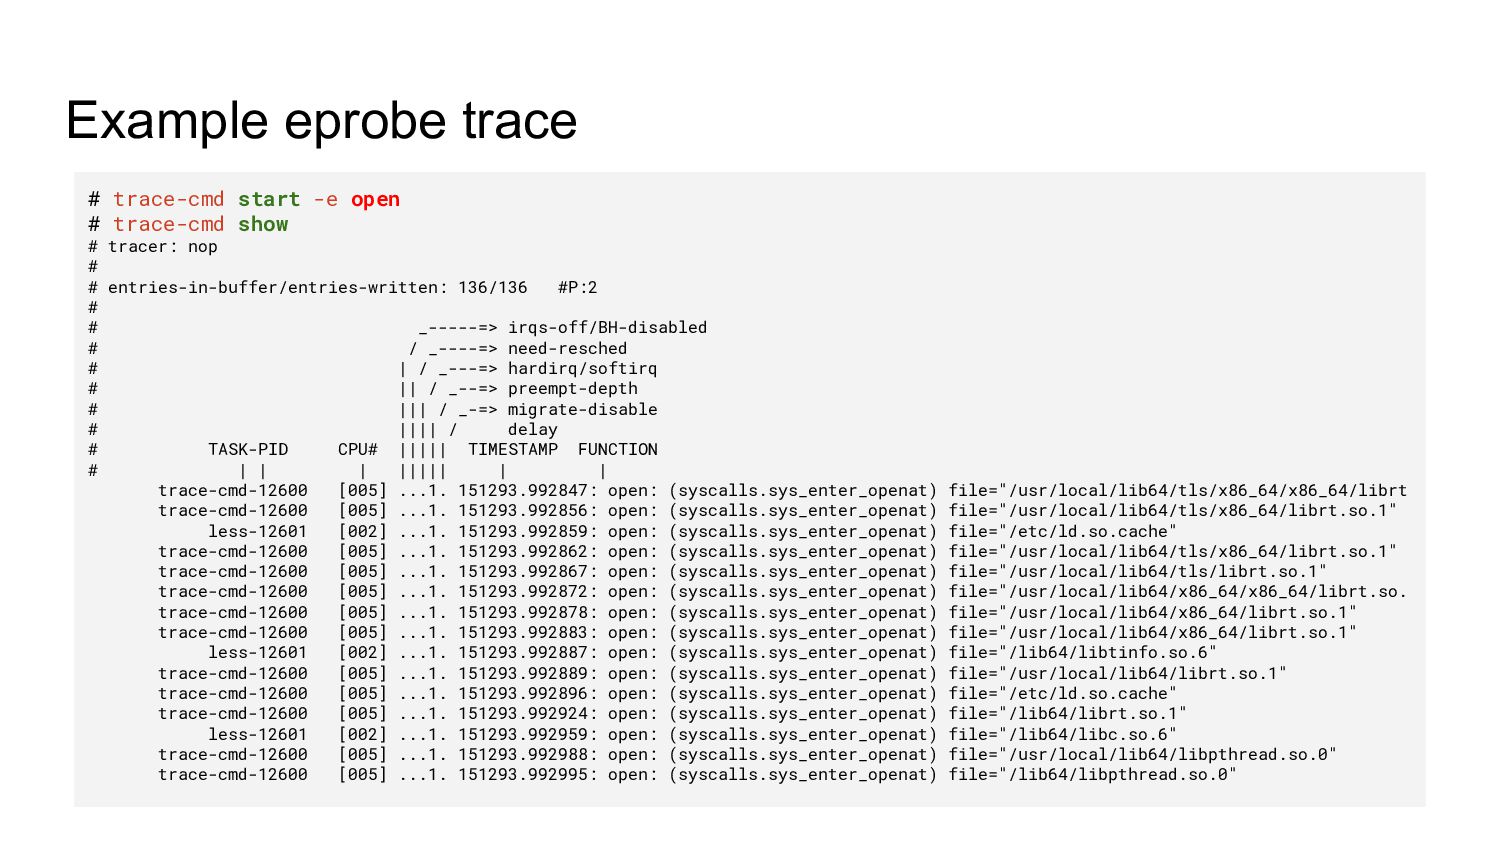
![ls-12606 [002] ...1. 151304.076524: open: (syscalls.sys_enter_openat) file="/etc/ld.so.cache" ls-12606 [002] ...1.](https://files.speakerdeck.com/presentations/2c09c35611a1429ea400d0c88d77c6d4/slide_135.jpg)