an MLOps advocate at Comet where I write technical articles to educate folks on how to effectively use Comet in the ML space for experimentation. Before data analytics, I gained experience building home automation systems for a startup.
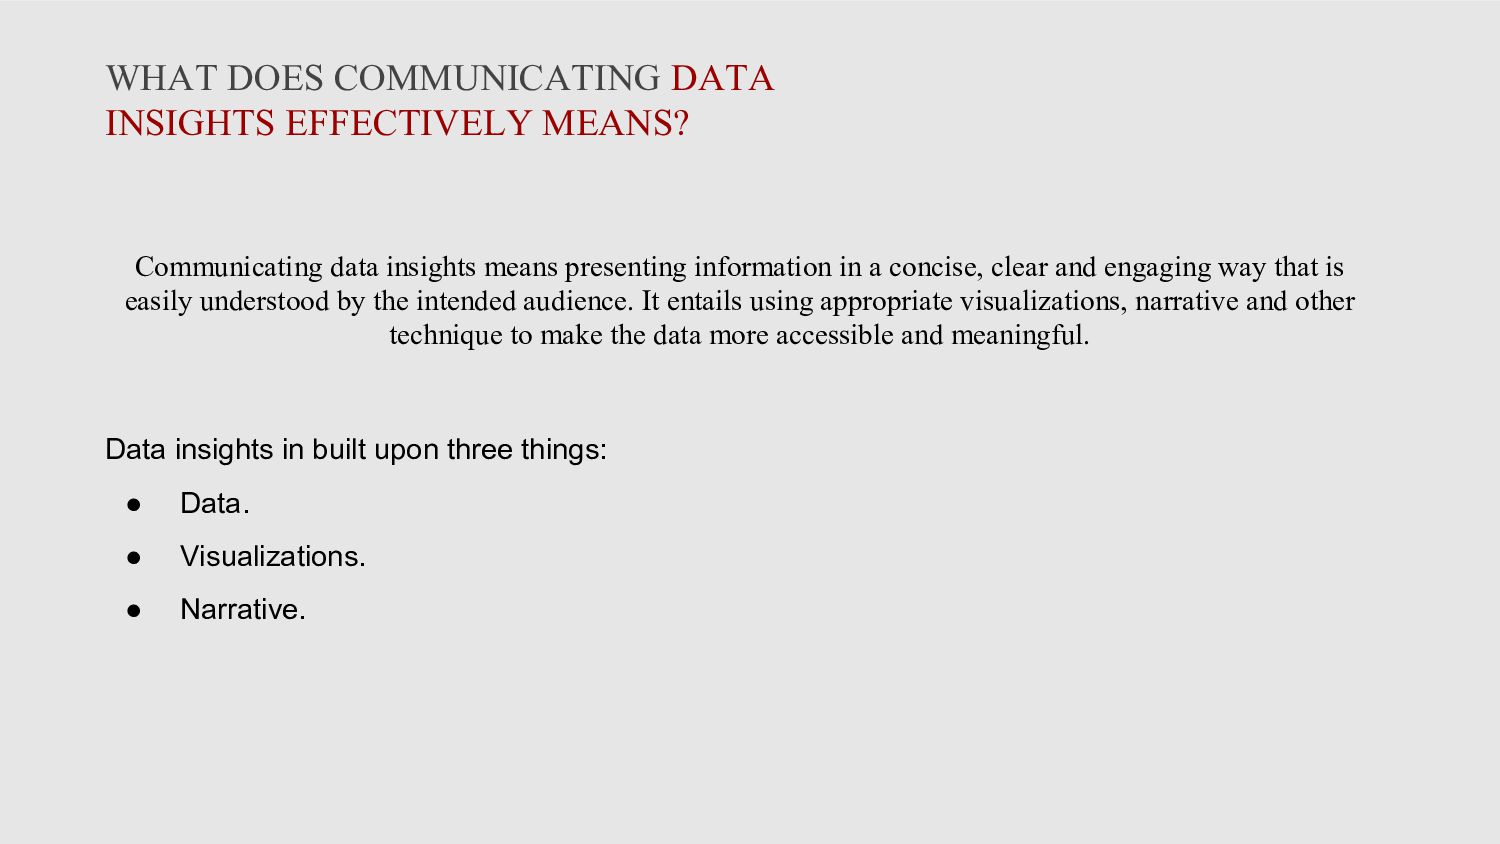
and engaging way that is easily understood by the intended audience. It entails using appropriate visualizations, narrative and other technique to make the data more accessible and meaningful. WHAT DOES COMMUNICATING DATA INSIGHTS EFFECTIVELY MEANS? Data insights in built upon three things: • Data. • Visualizations. • Narrative.
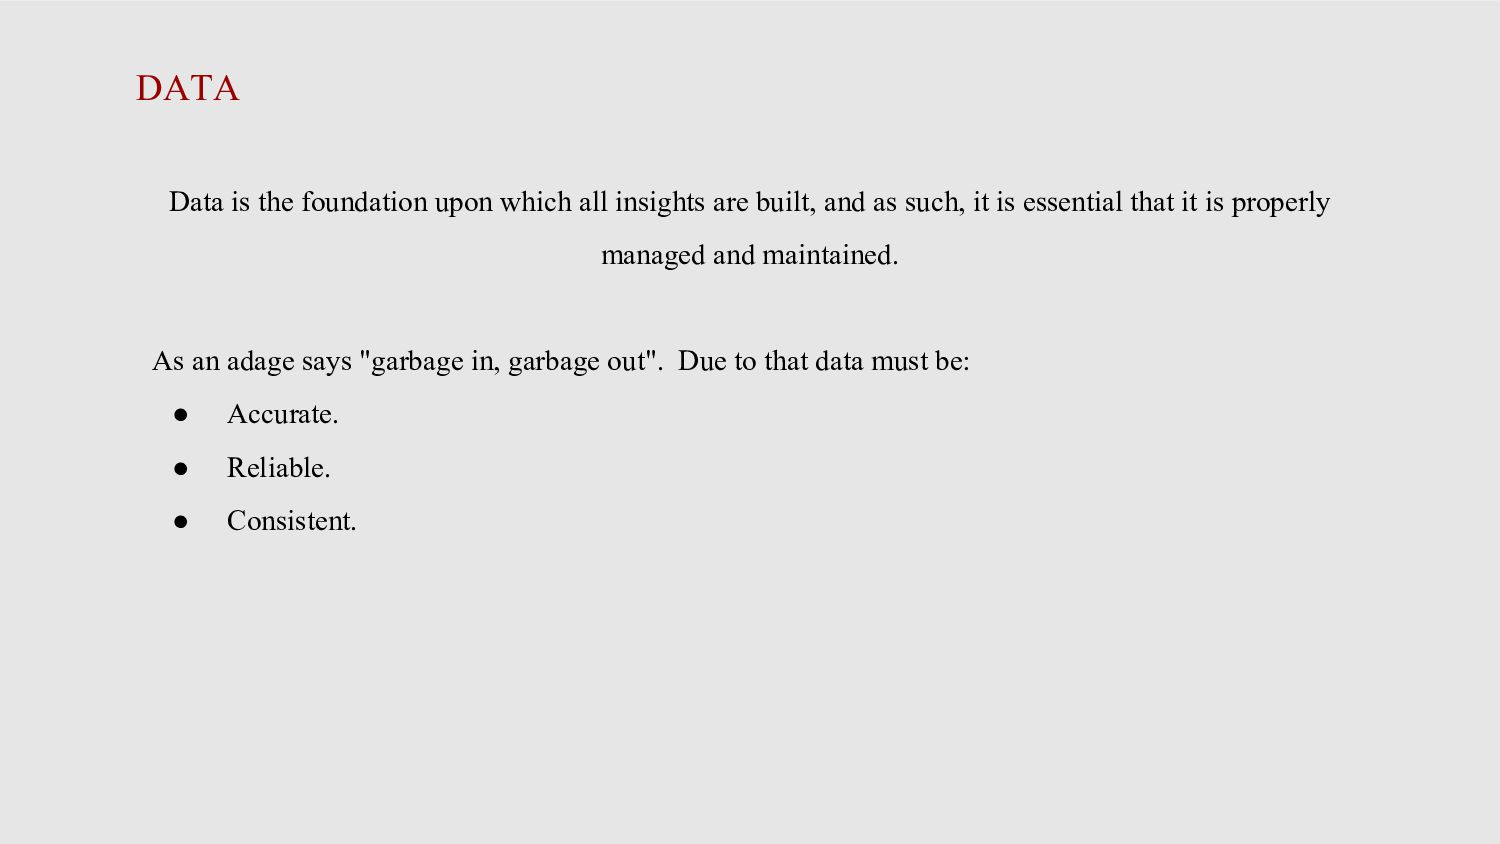
and as such, it is essential that it is properly managed and maintained. As an adage says "garbage in, garbage out". Due to that data must be: • Accurate. • Reliable. • Consistent. DATA
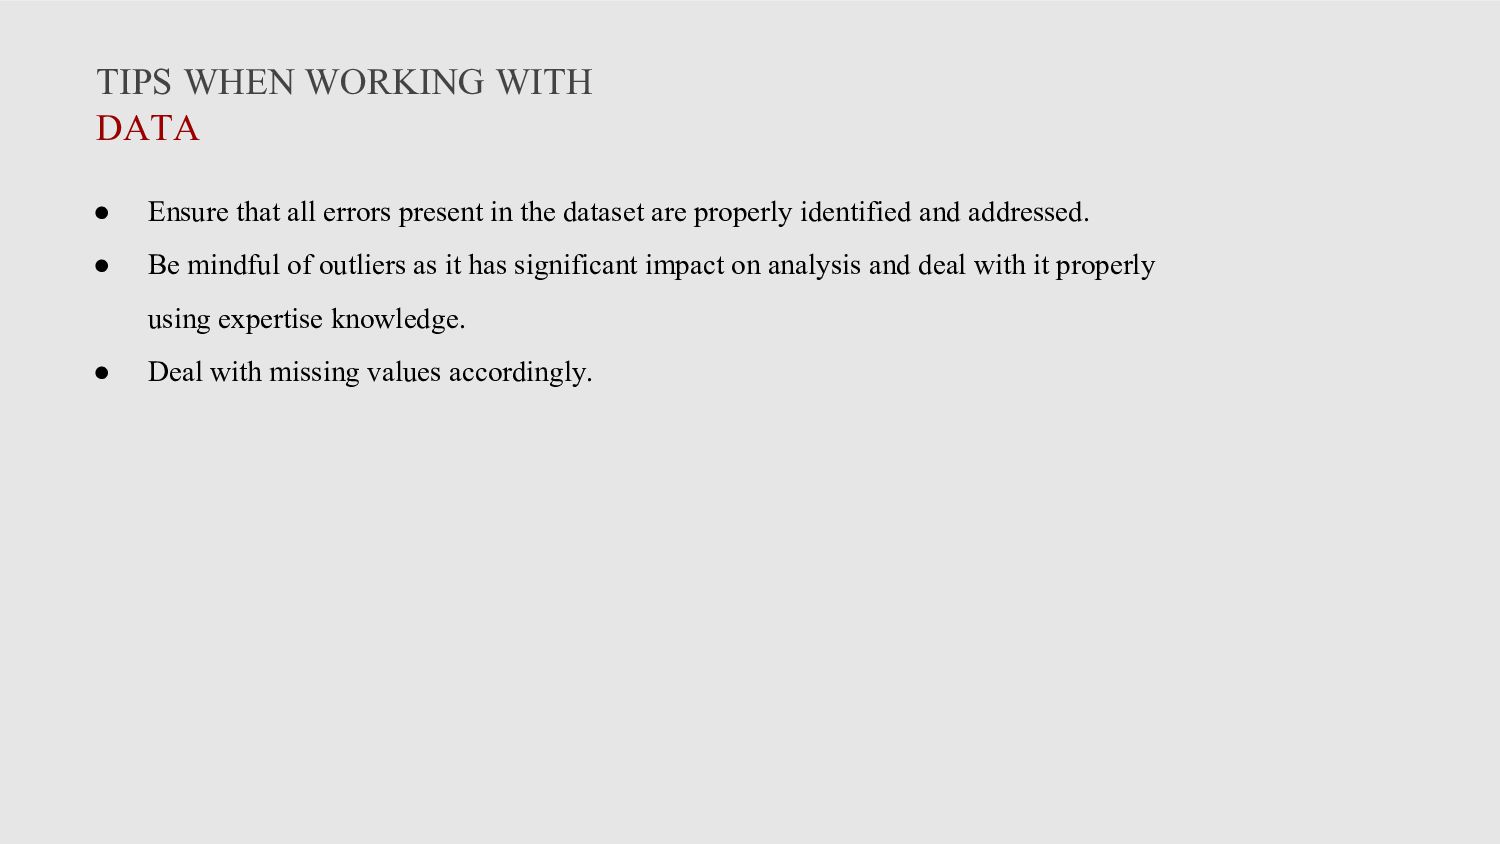
present in the dataset are properly identified and addressed. • Be mindful of outliers as it has significant impact on analysis and deal with it properly using expertise knowledge. • Deal with missing values accordingly.
key element that are used to attract the attention of an audience. Visuals allow complex data and ideas more accessible to user. There is a popular adage that says: “human are bad with numbers especially large number”. “Before people look at figures their eyes are attracted first to the visualization to see if they can identify trends quickly.” VISUALS
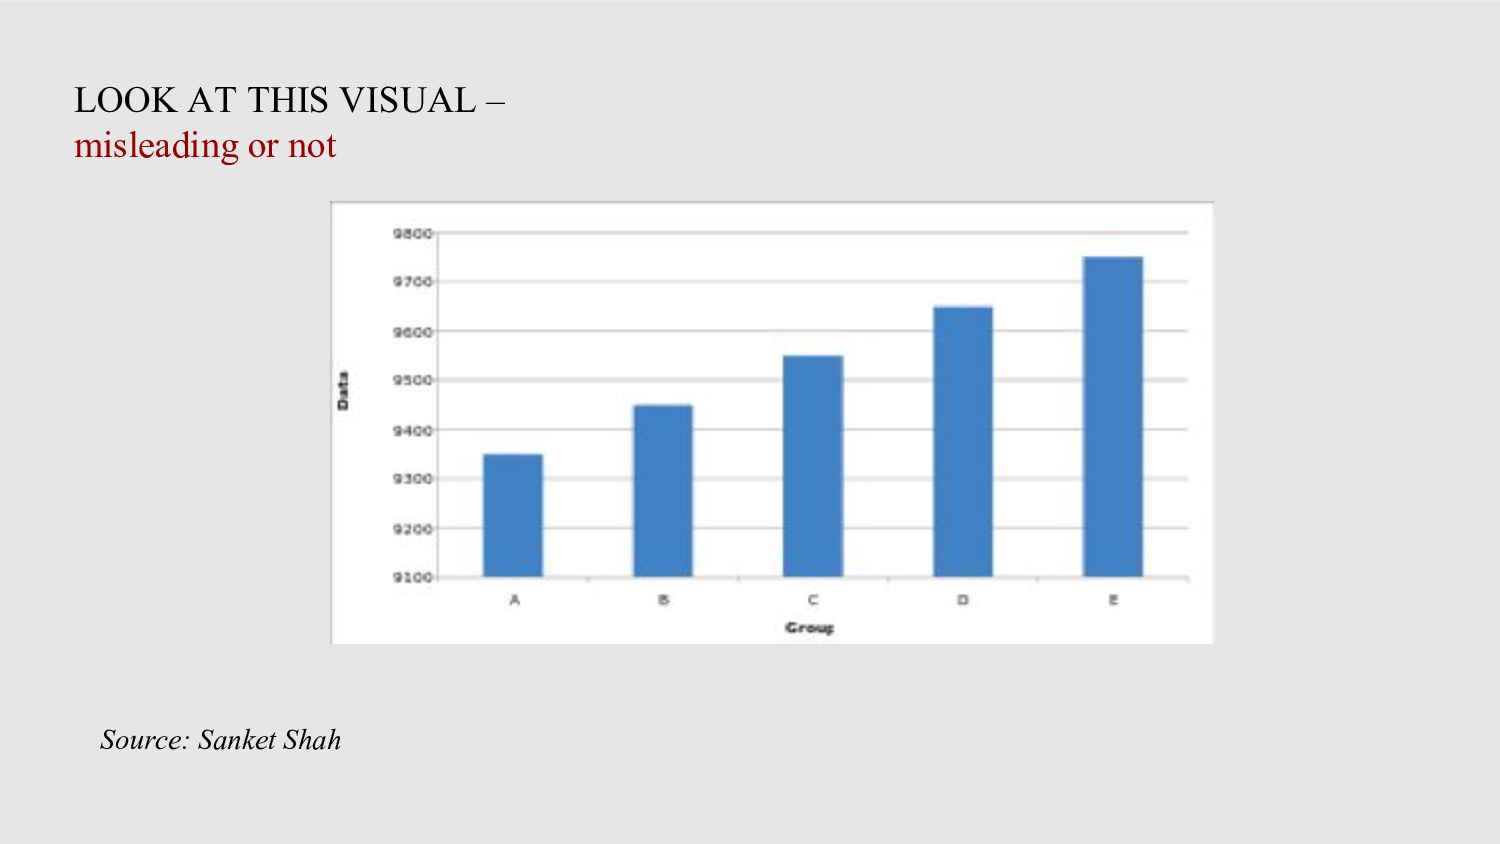
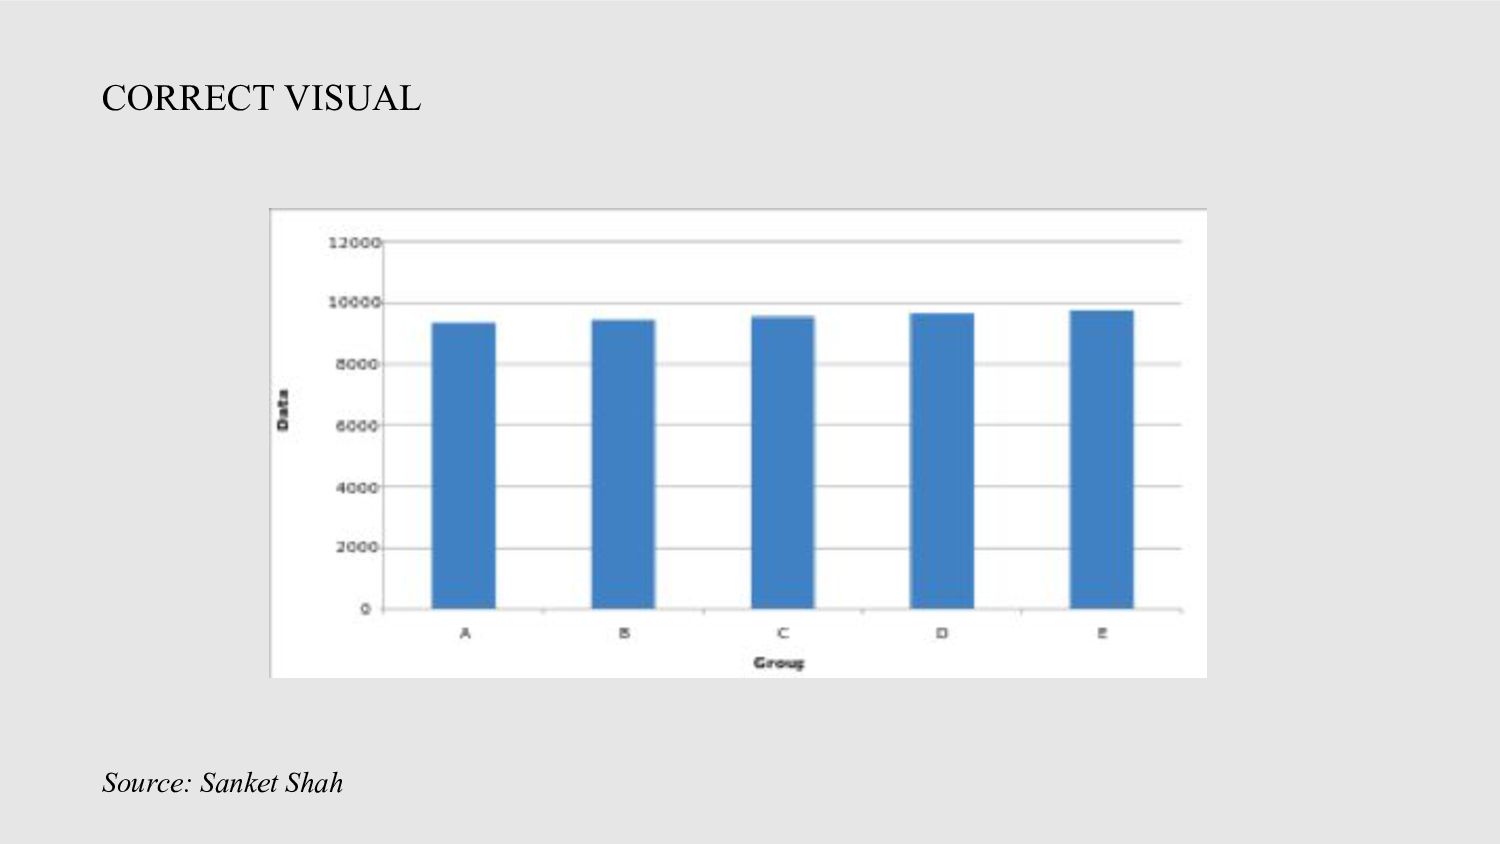
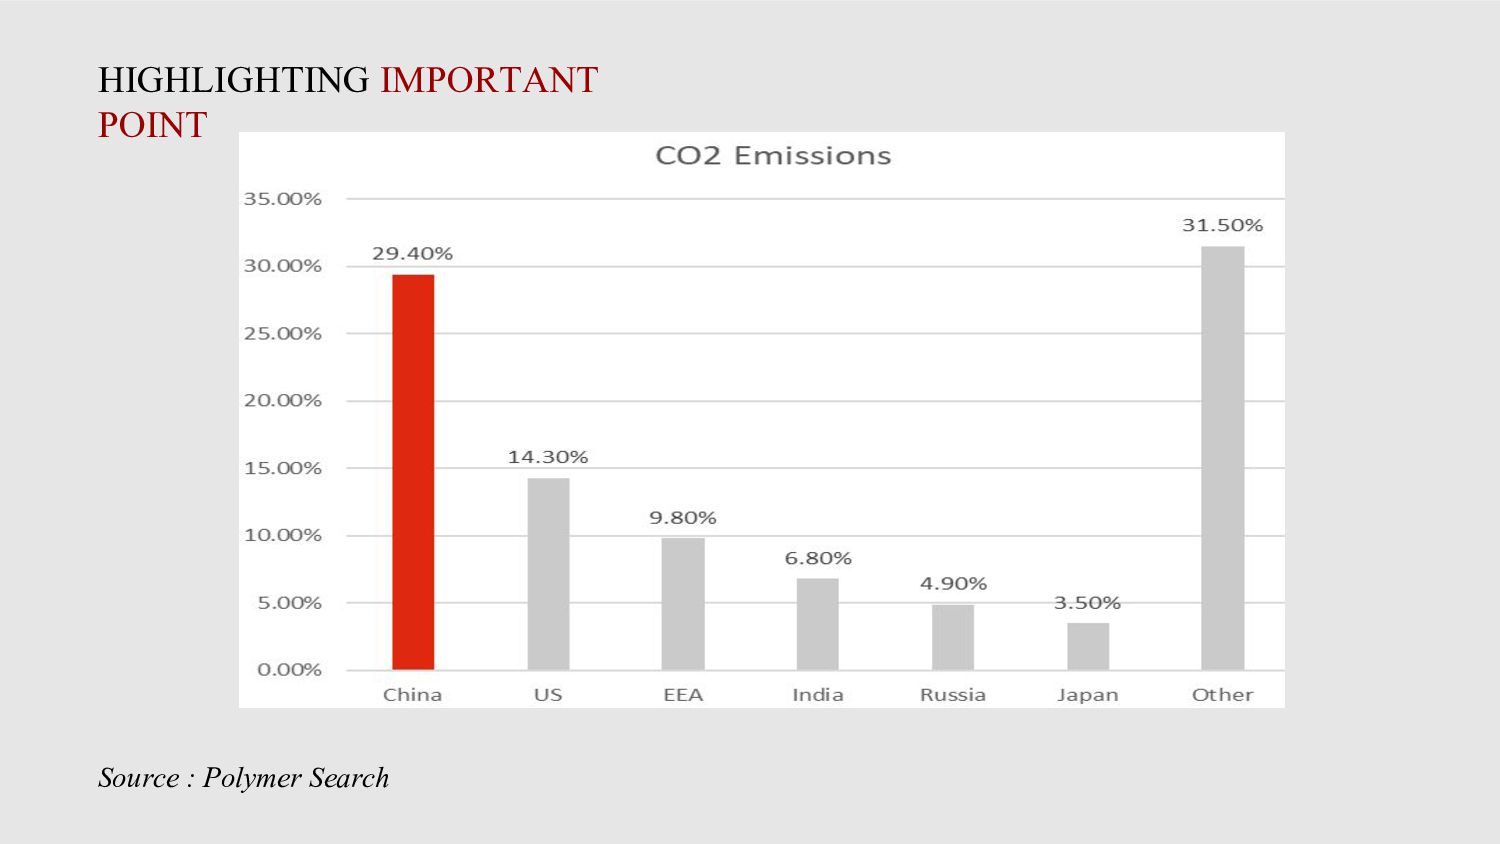
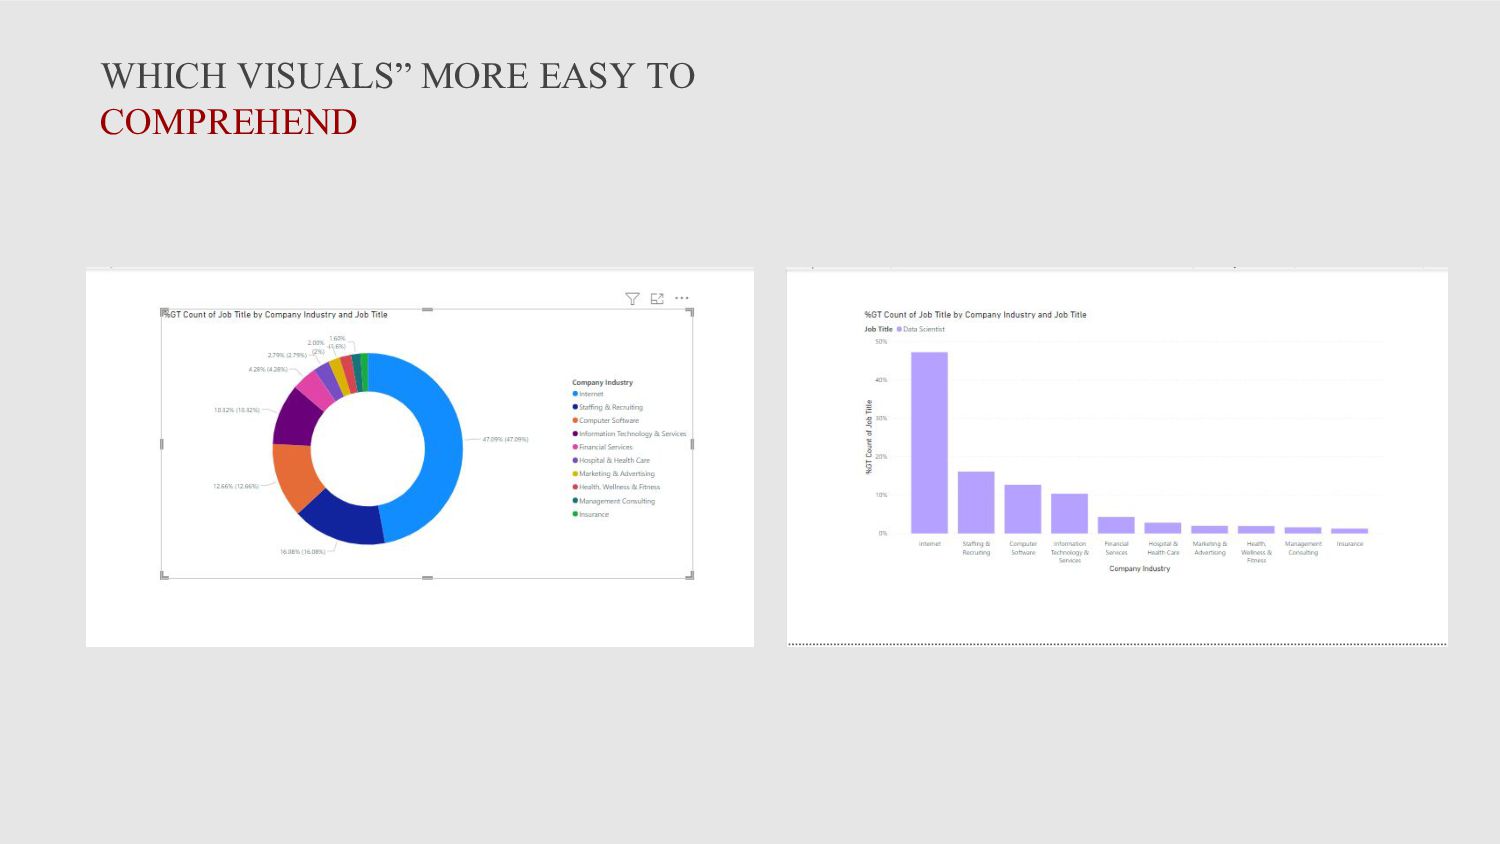
KIS avoid too many colors, label, shapes, 3D effect etc. • Use appropriate Scale. • Choose appropriate visuals for your use case. • Highlight important place you want to direct your audience attention to. • Use consistent formatting across all visuals. • Label your axes. • Keep your visuals interactive if possible. Always opt for dynamic visuals rather than static.
that ties together different elements of data and information to create a cohesive and compelling message in data storytelling. This is where you tailor your message backed up with visual so that your audience can comprehend your insights.
statement -- this will cause direction. • Make your data relatable by using analogies, anecdote, real-world examples, etc. • Follow a clear structure by tailoring your message to only include relevant insights. • Use your visuals effectively. • Know your audience -- Tech or non tech. • Keep it simple. • Show the impact of your analysis. • Provide a call to action.
understand the business problem indepthly – it will direct how you will tailor your insights. • Ask questions. • Include Key performance indicators (KPIs). • Include insights that support the main insights. • Organize the insights in a coherent manner.
communicating insights to non-tech audience like sales team, marketing, You should focus more on result rather than methodology. Avoid things like SMOTE method was used to fill the missing values etc. For example instead of saying there is a strong positive correlation between total sale and revenue. “You can say as total sales increases of over month so thus the revenue the company generate increases”.
good use of visuals. Avoid using too many colors, elements, and identifying the suitable visual for the use case. • Communicate your ideas using simple language. Avoid using technical jargon or complicated language. • Highlight your key insights and their significance to the analysis. • Identify and understand your audience so that you can effectively tailor your narrative.