Upgrade to Pro — share decks privately, control downloads, hide ads and more …

Improving Developer Onboarding Through Intelligent Data Insights

Improving Developer Onboarding Through Intelligent Data Insights

A developer platform lives and dies by it's developer community. When huge problems need to be solved, it's easy to make valuable improvements, but what do you do when those are solved and you still see high bounce rates on your site, low developer application completion, and generally poor adoption of your product? This is where your data can save you.

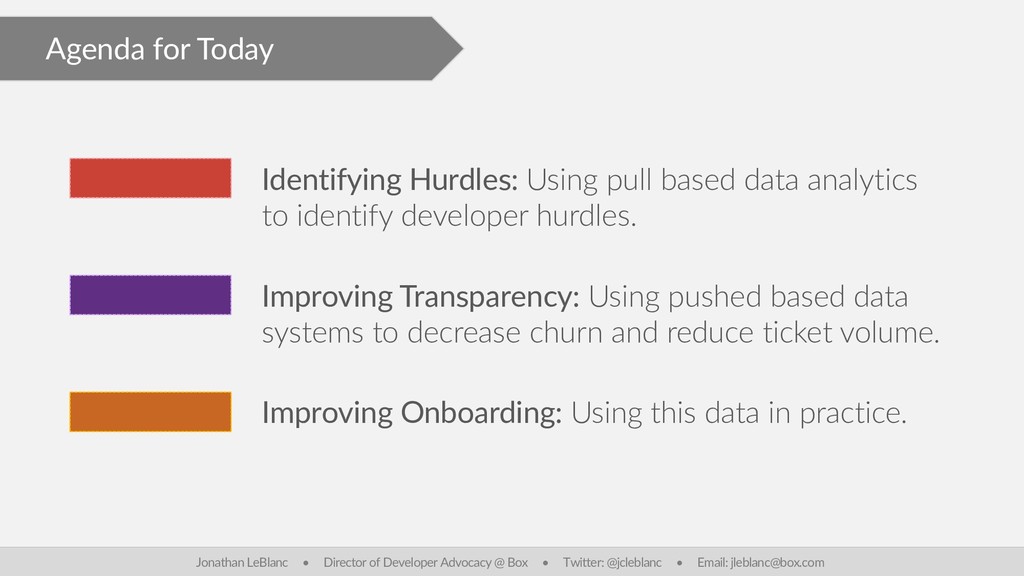
In this talk we'll run through:
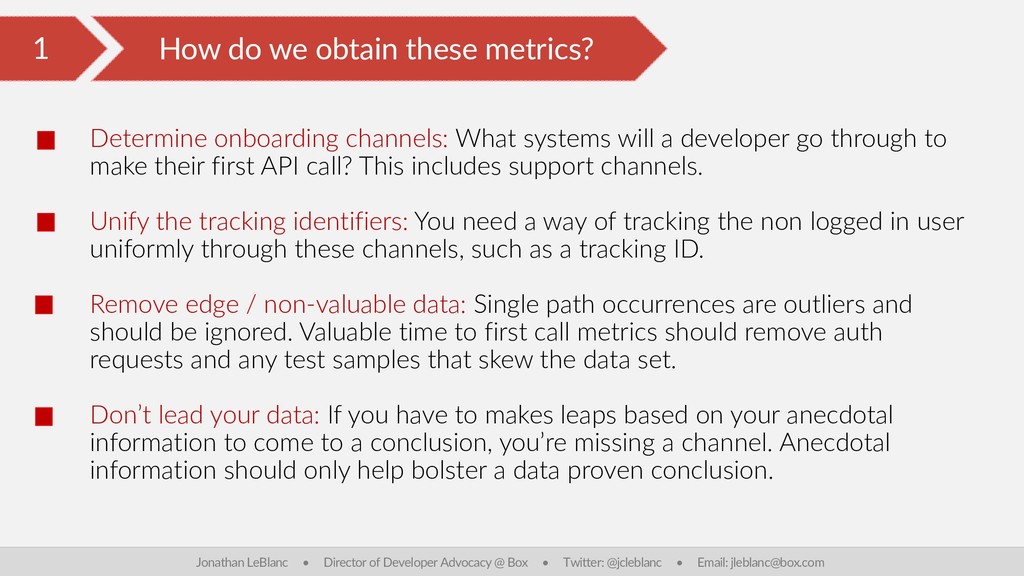
- How to track valuable developer path insights, from moments of anxiety to time to first valuable call.
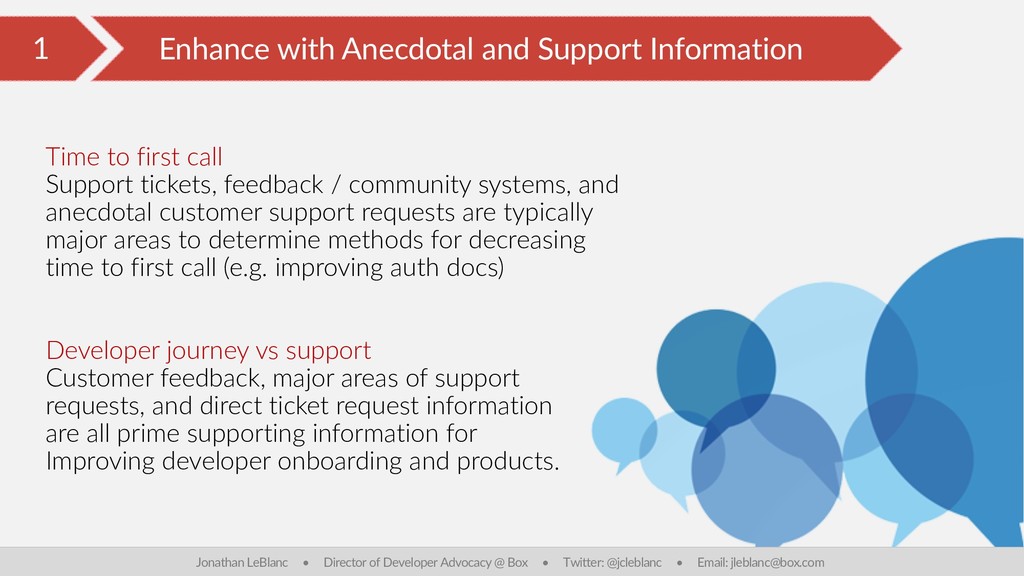
- Overlaying support and ticketing information on top of developer path data to decrease developer friction.
- How to create automated analytics systems to measure success.
- When these systems should be built, before it's too late.

Jonathan LeBlanc

February 21, 2019
Tweet

More Decks by Jonathan LeBlanc

Other Decks in Technology

Transcript

  1. Why is the Data Important? When you have big problems,

    solutions are easy. When those are solved how do you determine what will make any measurable impact? Jonathan LeBlanc • Director of Developer Advocacy @ Box • Twitter: @jcleblanc • Email: [email protected]
  2. Agenda for Today Identifying Hurdles: Using pull based data analytics

    to identify developer hurdles. Improving Transparency: Using pushed based data systems to decrease churn and reduce ticket volume. Improving Onboarding: Using this data in practice. Jonathan LeBlanc • Director of Developer Advocacy @ Box • Twitter: @jcleblanc • Email: [email protected]
  3. 1 Identifying key moments of anxiety Jonathan LeBlanc • Director

    of Developer Advocacy @ Box • Twitter: @jcleblanc • Email: [email protected]
  4. 1 How it translates to developer onboarding Jonathan LeBlanc •

    Director of Developer Advocacy @ Box • Twitter: @jcleblanc • Email: [email protected]
  5. 1 What metrics are we looking for? Jonathan LeBlanc •

    Director of Developer Advocacy @ Box • Twitter: @jcleblanc • Email: [email protected] Time to first call How long did it take the developer to make their first valuable API call? Developer journey vs support Which pages / paths did the user follow, which pages did they leave on, and what support requests did they file?
  6. 1 How do we obtain these metrics? Jonathan LeBlanc •

    Director of Developer Advocacy @ Box • Twitter: @jcleblanc • Email: [email protected] Determine onboarding channels: What systems will a developer go through to make their first API call? This includes support channels. Unify the tracking identifiers: You need a way of tracking the non logged in user uniformly through these channels, such as a tracking ID. Remove edge / non-valuable data: Single path occurrences are outliers and should be ignored. Valuable time to first call metrics should remove auth requests and any test samples that skew the data set. Don’t lead your data: If you have to makes leaps based on your anecdotal information to come to a conclusion, you’re missing a channel. Anecdotal information should only help bolster a data proven conclusion.
  7. 1 Enhance with Anecdotal and Support Information Jonathan LeBlanc •

    Director of Developer Advocacy @ Box • Twitter: @jcleblanc • Email: [email protected] Time to first call Support tickets, feedback / community systems, and anecdotal customer support requests are typically major areas to determine methods for decreasing time to first call (e.g. improving auth docs) Developer journey vs support Customer feedback, major areas of support requests, and direct ticket request information are all prime supporting information for Improving developer onboarding and products.
  8. 2 What should the roadmap focus on Jonathan LeBlanc •

    Director of Developer Advocacy @ Box • Twitter: @jcleblanc • Email: [email protected] Avoid exact timelines: Using terminology to denote near, medium, and long term targets avoids being seen as unreliable if dates slip. Avoid roadmap changes: Only display what you can commit to, such as a 3-6 month timeframe. Use it as an engagement mechanism: Collect feedback on what people want / don’t want on the roadmap, then use that to improve it.
  9. 2 Changelog / Release Notes Jonathan LeBlanc • Director of

    Developer Advocacy @ Box • Twitter: @jcleblanc • Email: [email protected]
  10. 2 What should the changelog include? Jonathan LeBlanc • Director

    of Developer Advocacy @ Box • Twitter: @jcleblanc • Email: [email protected] Granular scoping: Ability to filter changes based on relevant topic, such as API changes, breaking changes, particular product lines, etc. Subscription: Treat it as an independent service, allow users to subscribe to updates via RSS feed, email, text, etc. Overshare: Breaking changes, enhancements, upcoming major changes, maintenance, and the like should be shared. This isn’t a newsletter where you’re worried to communicate too often.
  11. 2 API Uptime Status Indicator Jonathan LeBlanc • Director of

    Developer Advocacy @ Box • Twitter: @jcleblanc • Email: [email protected]
  12. 2 What should the status indicator include? Jonathan LeBlanc •

    Director of Developer Advocacy @ Box • Twitter: @jcleblanc • Email: [email protected] Granular statuses: Ability to filter changes based on relevant topic, such as API changes, breaking changes, particular product lines, etc. Subscription: Treat it as an independent service, allow users to subscribe to status changes for any granular area of the APIs / services via RSS feed, email, text, etc. Immediate and continuous posting: When service changes occur, they need to be reflected immediately. Status updates should be posted regularly until problems are rectified.
  13. 3 Using the Data: Documentation Rebuild Example Jonathan LeBlanc •

    Director of Developer Advocacy @ Box • Twitter: @jcleblanc • Email: [email protected]
  14. 3 Using the Data: Documentation Rebuild Example Jonathan LeBlanc •

    Director of Developer Advocacy @ Box • Twitter: @jcleblanc • Email: [email protected] Source: Box developer site at https:/ /developer.box.com Core data sources: User site path, time on page, exit rates, and bounce rates. Supporting sources: Support ticket data, forum feedback, direct customer feedback, and independent audit. Resulting improvement: Page view increase: 2x Bounce rate decrease: 68.68% -> 24.64% Exit rate decrease: 60.12% -> 24.19%
  15. 3 Jonathan LeBlanc • Director of Developer Advocacy @ Box

    • Twitter: @jcleblanc • Email: [email protected] Source: Box Pulse at https:/ /pulse.box.com Core driving factor: Direct customer feedback, transparency improvements Requirements: All feedback is under strict SLAs, all teams responsible for responding and assigning a status to feedback within a given period of time. Resulting improvement: 2834 independent pieces of feedback, 225 delivered, 332 being researched, 247 under consideration, 7 in beta, and 74 on the roadmap. All within 3-4 months of being launched. Improving Transparency Example
  16. Wrapping up our topics Identifying Hurdles: Using pull based data

    analytics to identify developer hurdles. Improving Transparency: Using pushed based data systems to decrease churn and reduce ticket volume. Improving Onboarding: Using this data in practice. Jonathan LeBlanc • Director of Developer Advocacy @ Box • Twitter: @jcleblanc • Email: [email protected]