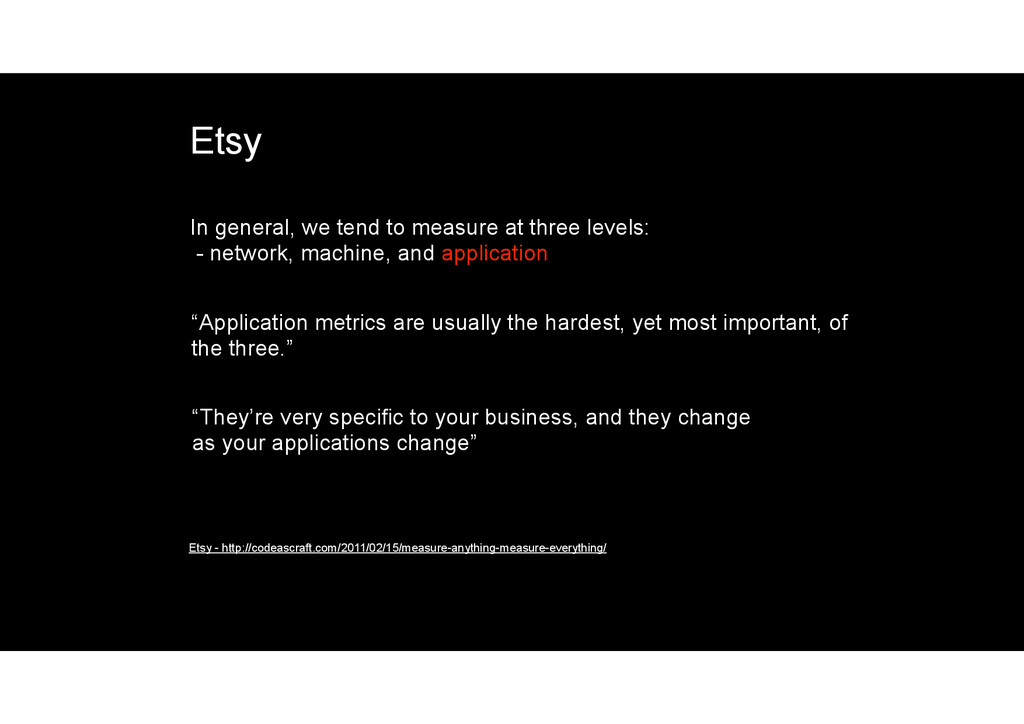
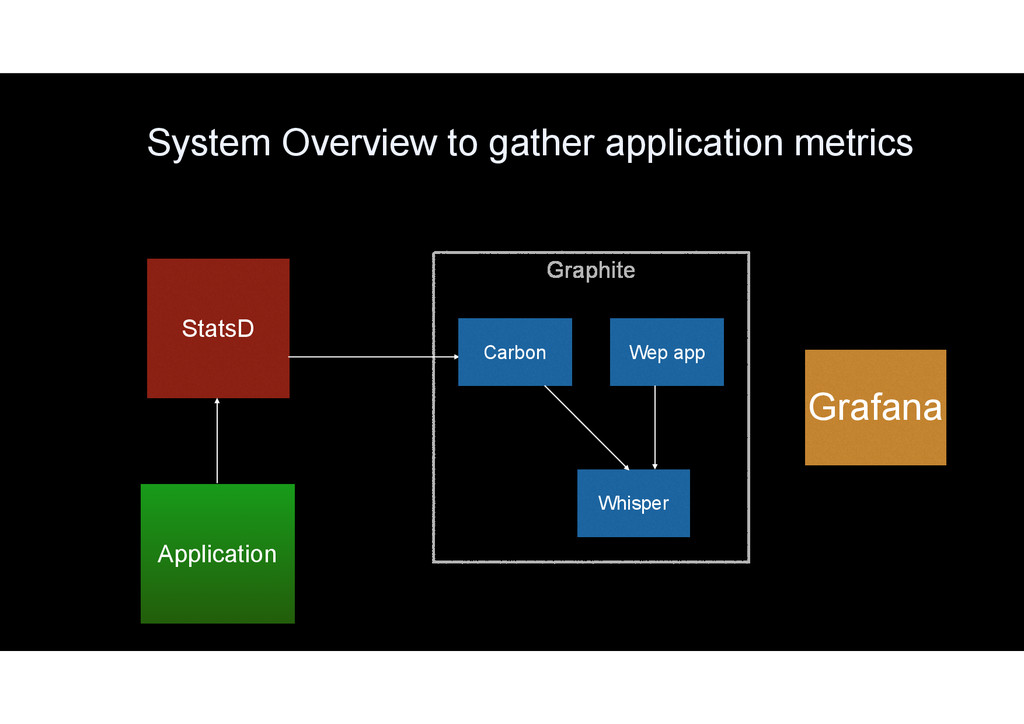
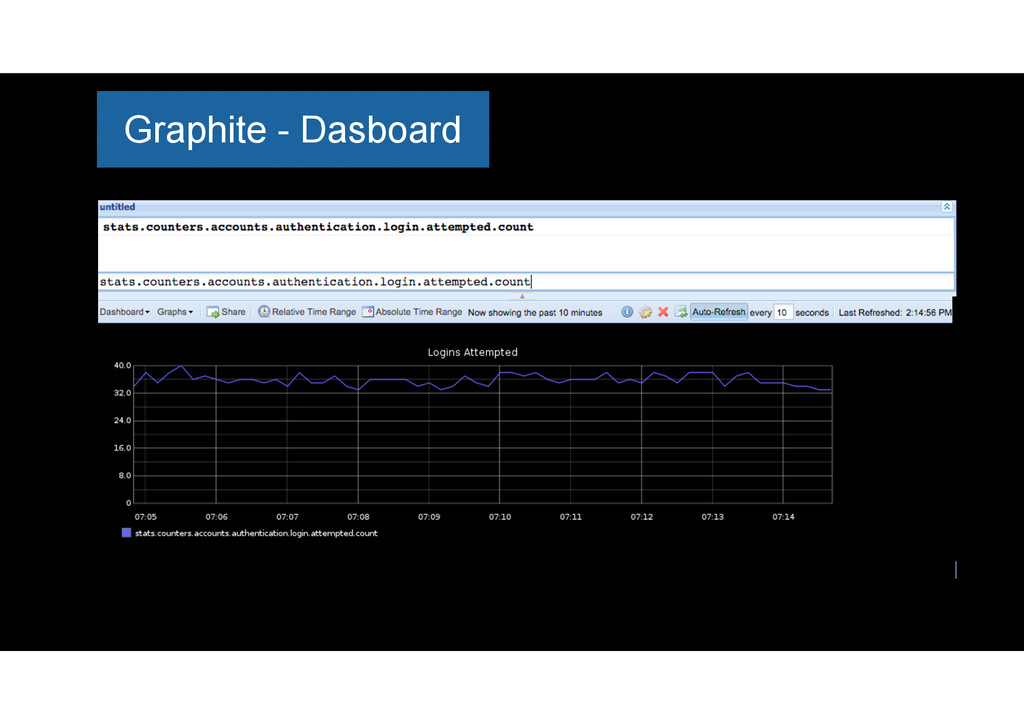
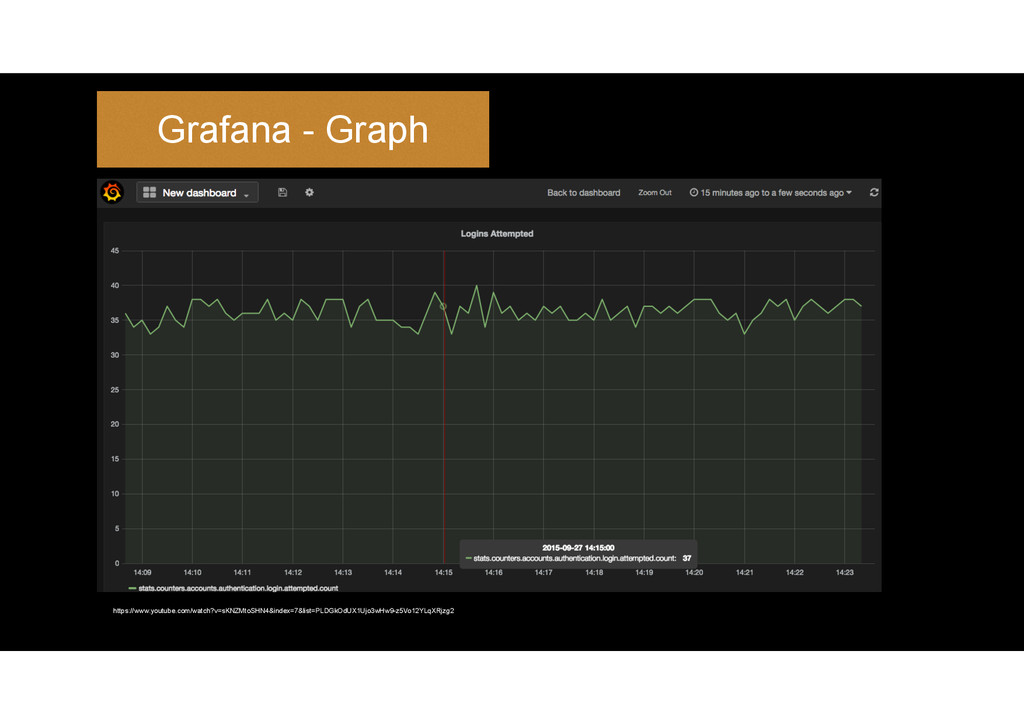
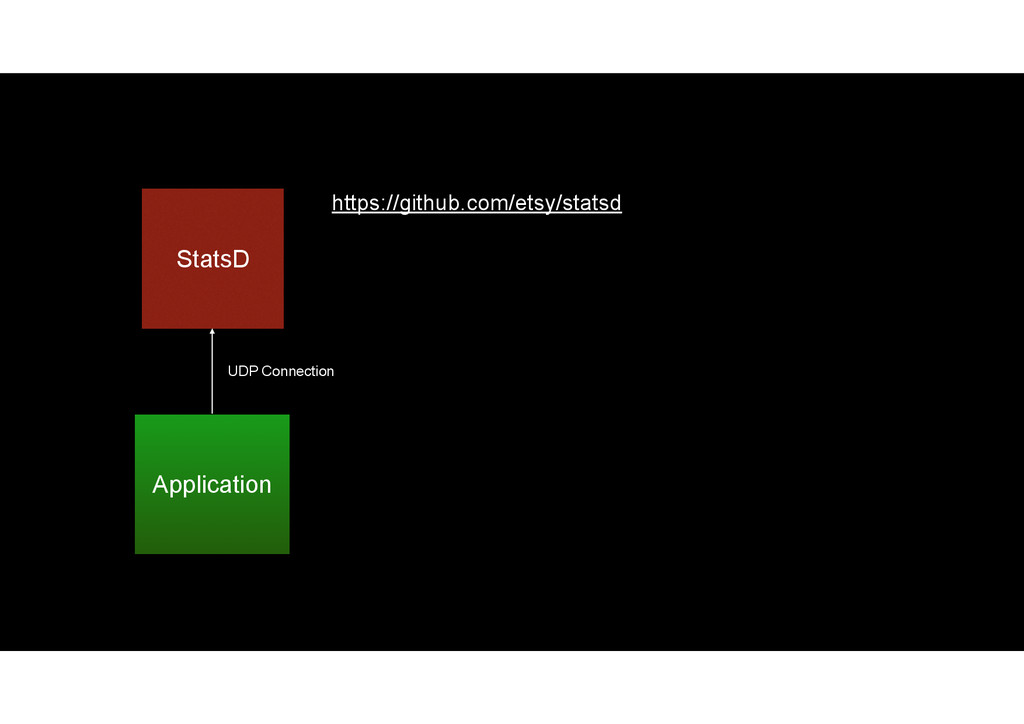
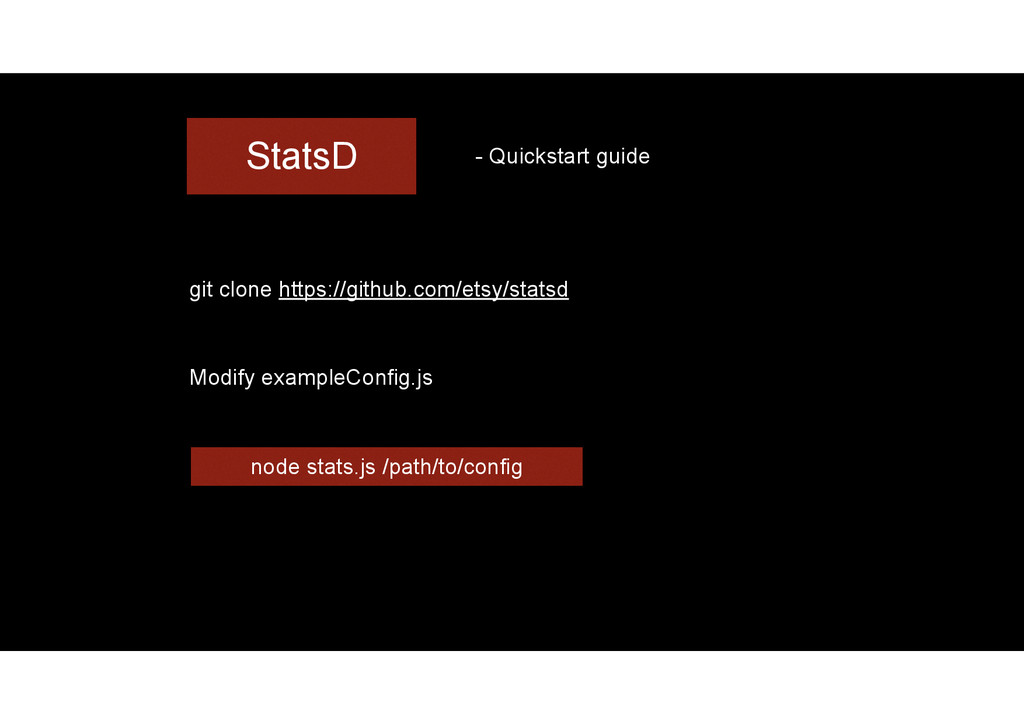
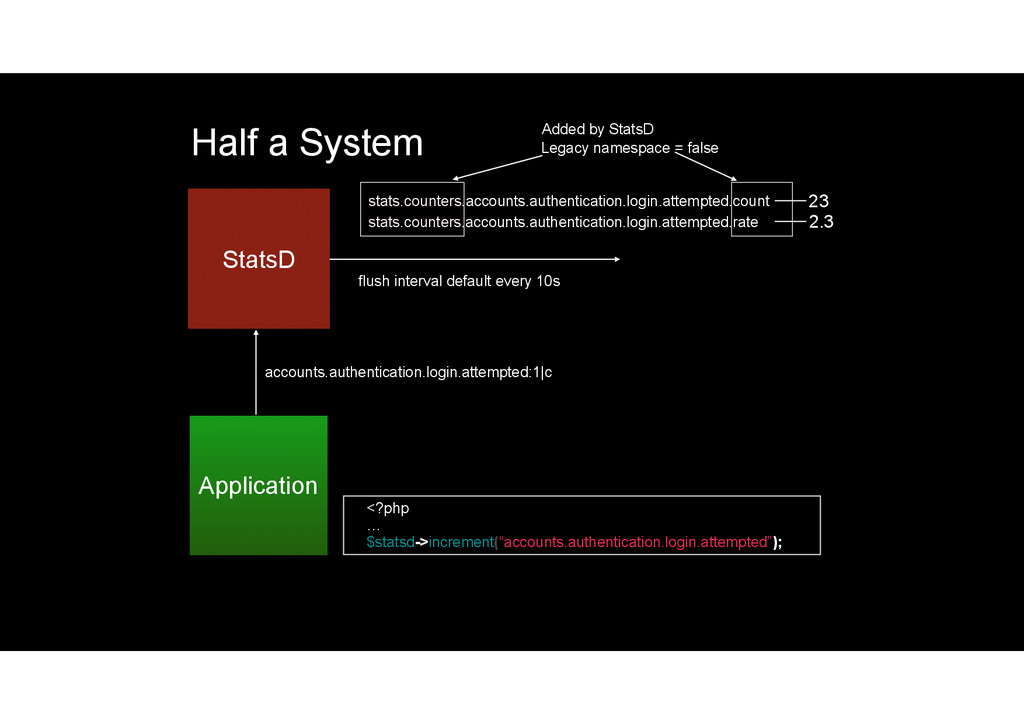
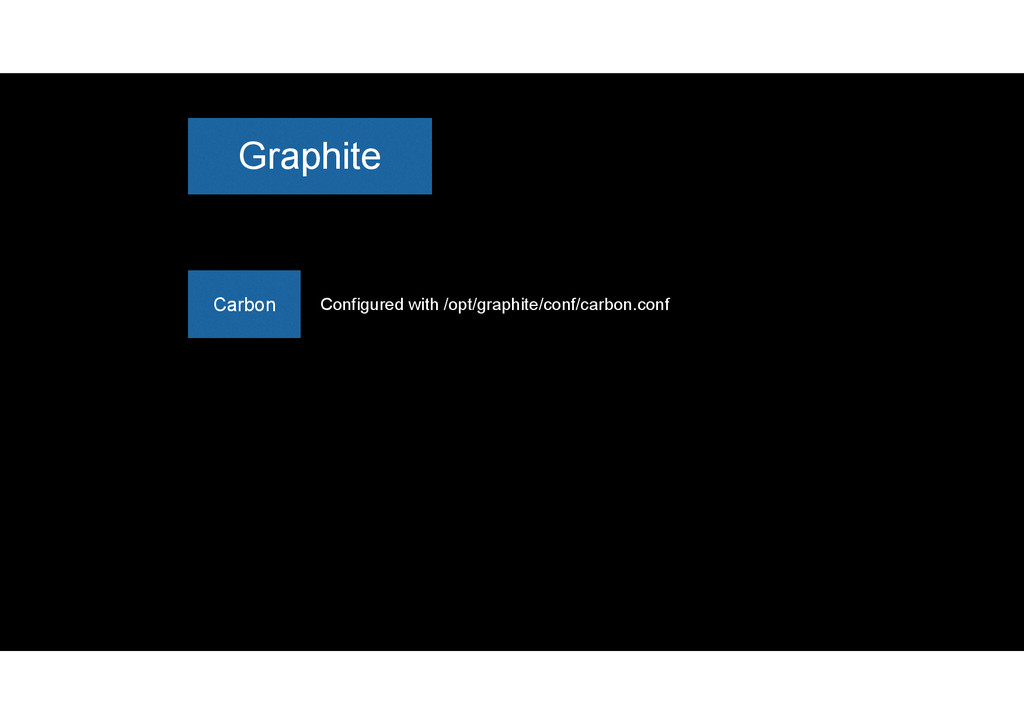
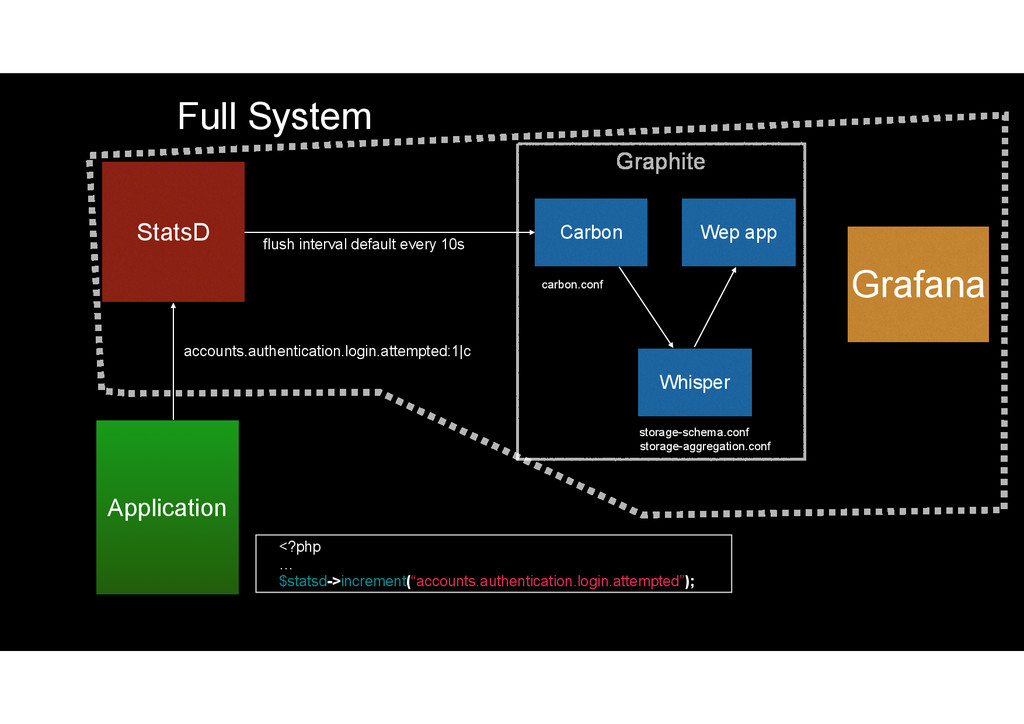
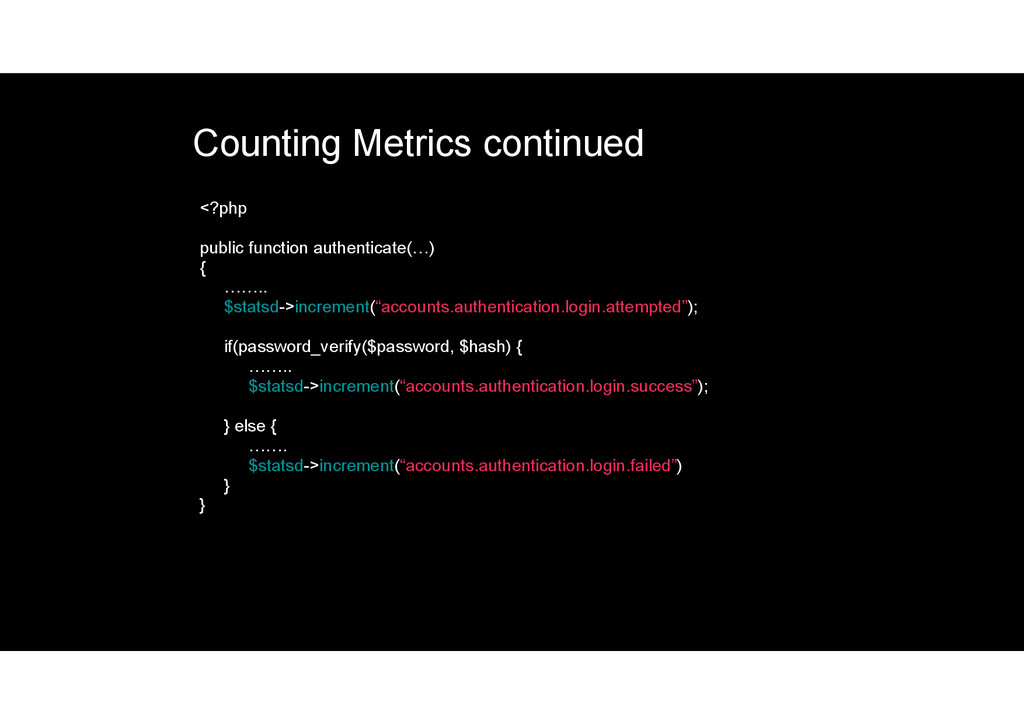
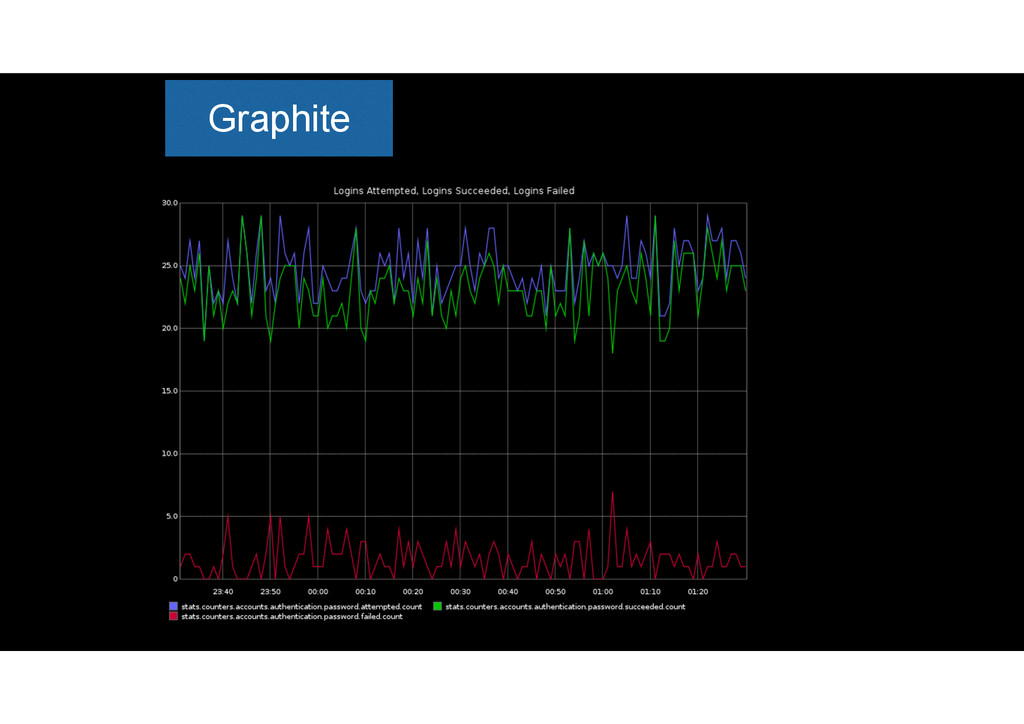
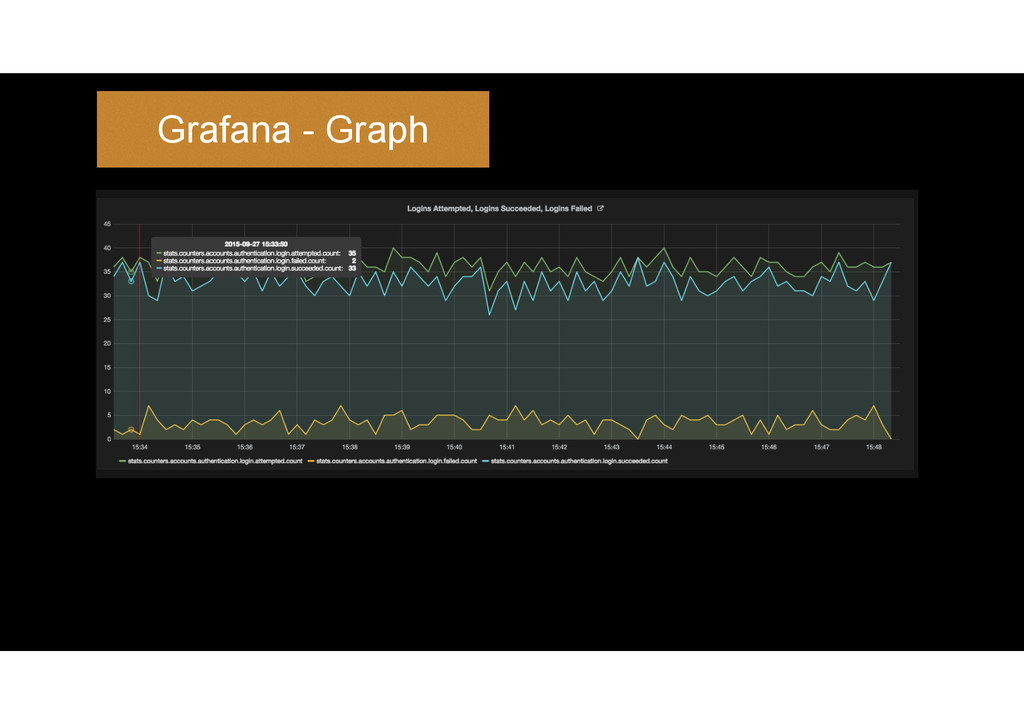
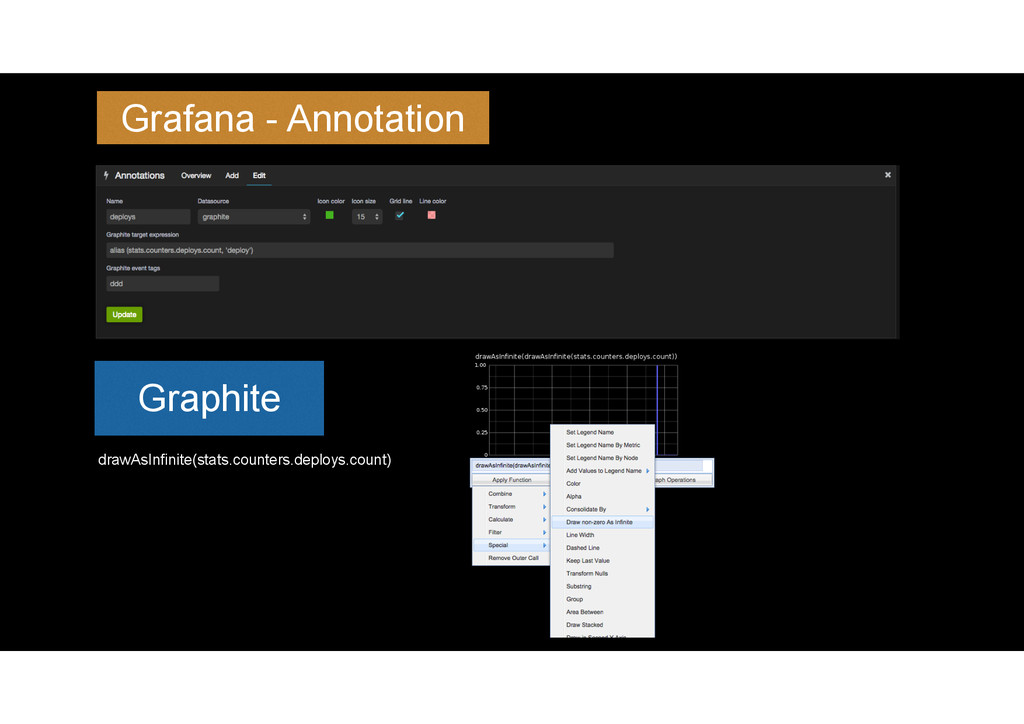
Application metrics are extremely important but are often hard to gather as our PHP Applications differ significantly. Using StatsD and Graphite we can gather metrics from our applications no matter what their shape or form. In this talk I will discuss how you can use Statsd to send various metrics of your PHP applications to Graphite. StatsD is a simple NodeJS daemon for easy stats aggregation and makes it simple to plot application metrics on a graph in Graphite. Using the metrics that are gathered its possible to get an overview of what is happening with our applications in near realtime which is extremely useful. Graphite additionally allows us to produce easy understandable graphs and dashboards which once analysed can be used to improve our PHP applications. My talk will cover everything from setting up StatsD and Graphite to how you gather the metrics from within your PHP applications. After the talk developers should be confident enough to go away and implement these technologies in their applications.
![StatsD Sample config { "backends": [ "./backends/graphite" ], "graphite": {](https://files.speakerdeck.com/presentations/b68651a805654d1f85aa1edcd056161e/slide_25.jpg)
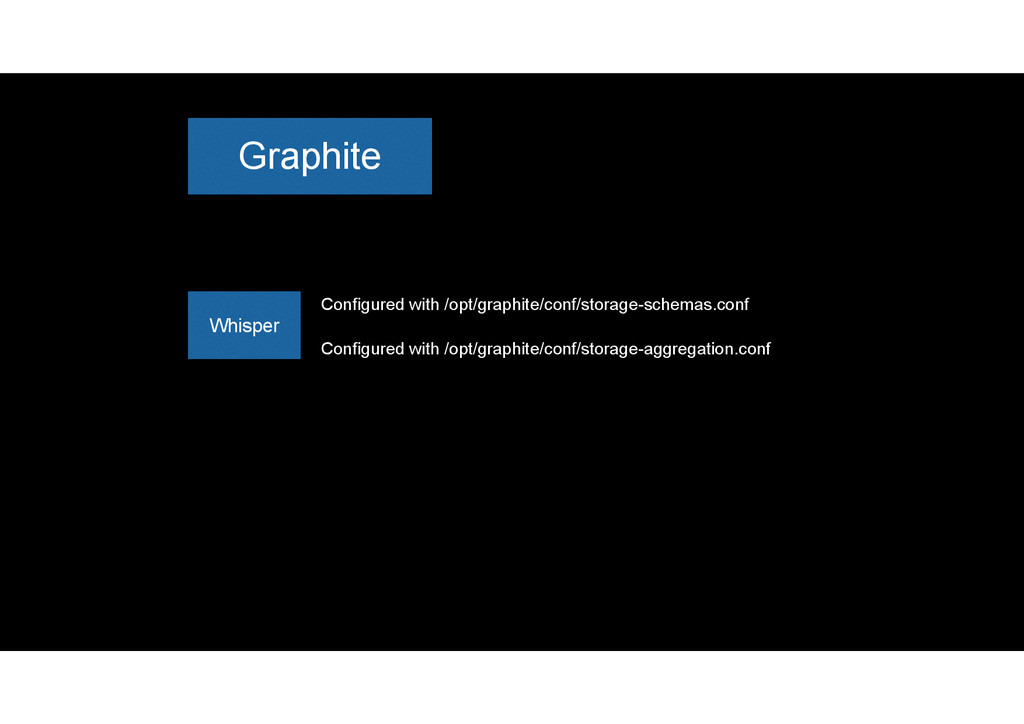
![storage-schemas.conf Whisper http://graphite.readthedocs.org/en/latest/config-carbon.html#storage-schemas-conf [stats] pattern = ^stats.* stats.counters.accounts.authentication.login.attempted.count metadata archive](https://files.speakerdeck.com/presentations/b68651a805654d1f85aa1edcd056161e/slide_34.jpg)
![Whisper storage-aggregation.conf http://graphite.readthedocs.org/en/latest/config-carbon.html#storage-aggregation-conf [count] pattern = \.count$ aggregationMethod = sum](https://files.speakerdeck.com/presentations/b68651a805654d1f85aa1edcd056161e/slide_35.jpg)