Upgrade to Pro — share decks privately, control downloads, hide ads and more …

Designing Dashboards & Data Visualisations in Web Apps

Des Traynor
October 11, 2011

Designing Dashboards & Data Visualisations in Web Apps

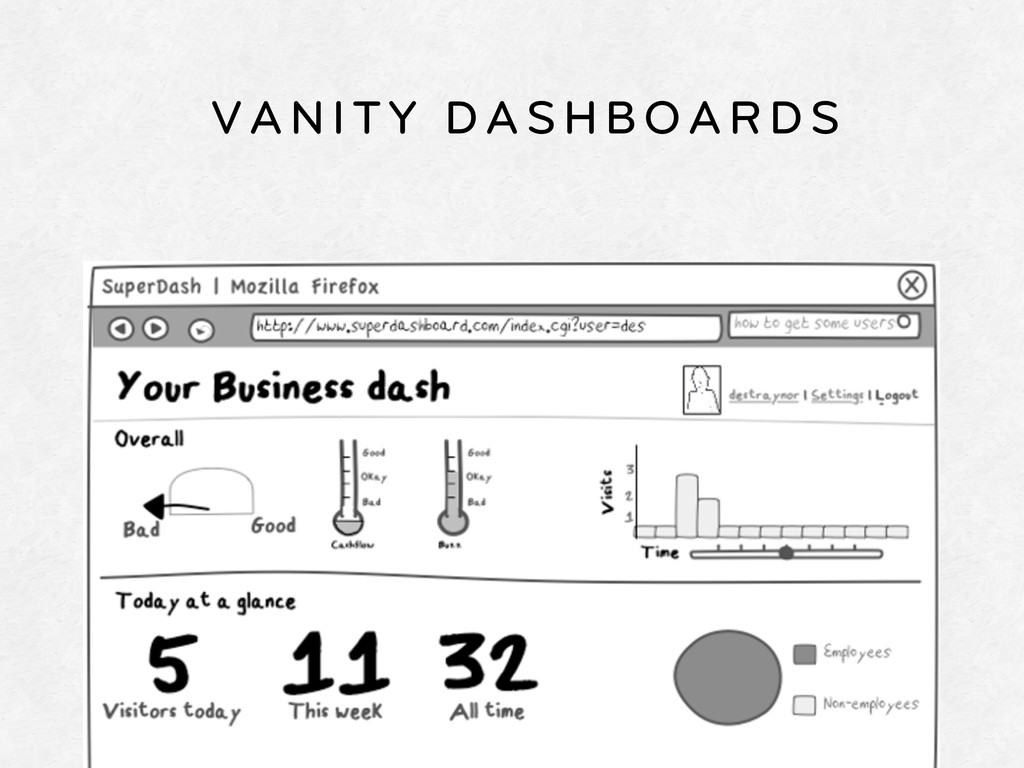
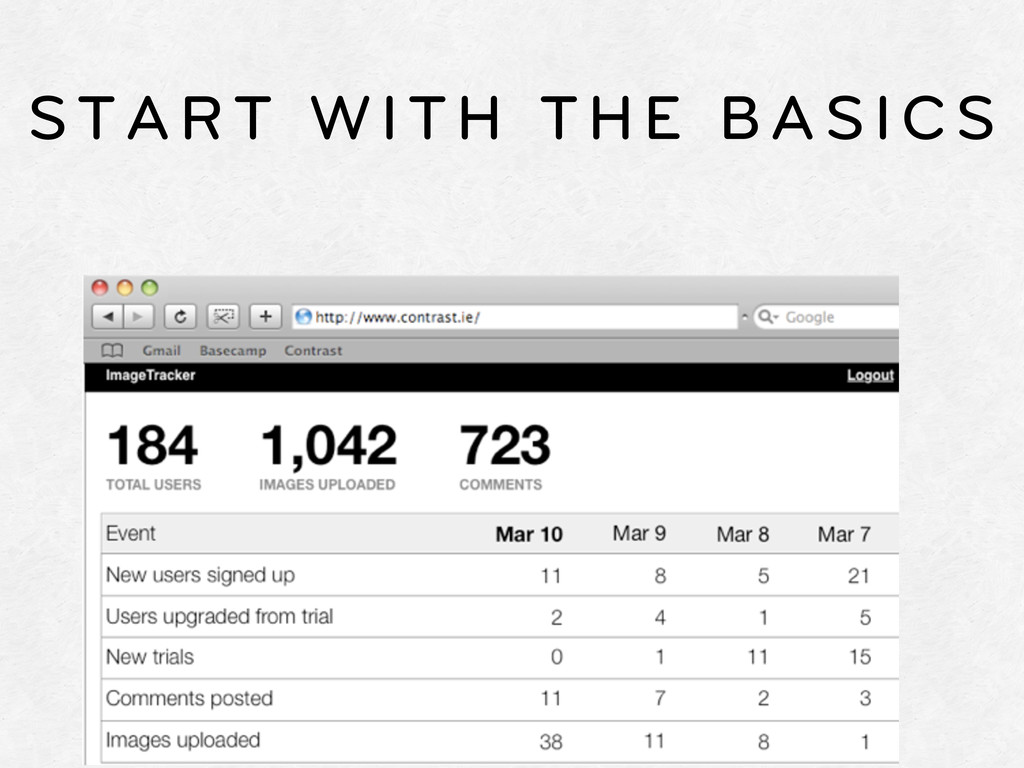
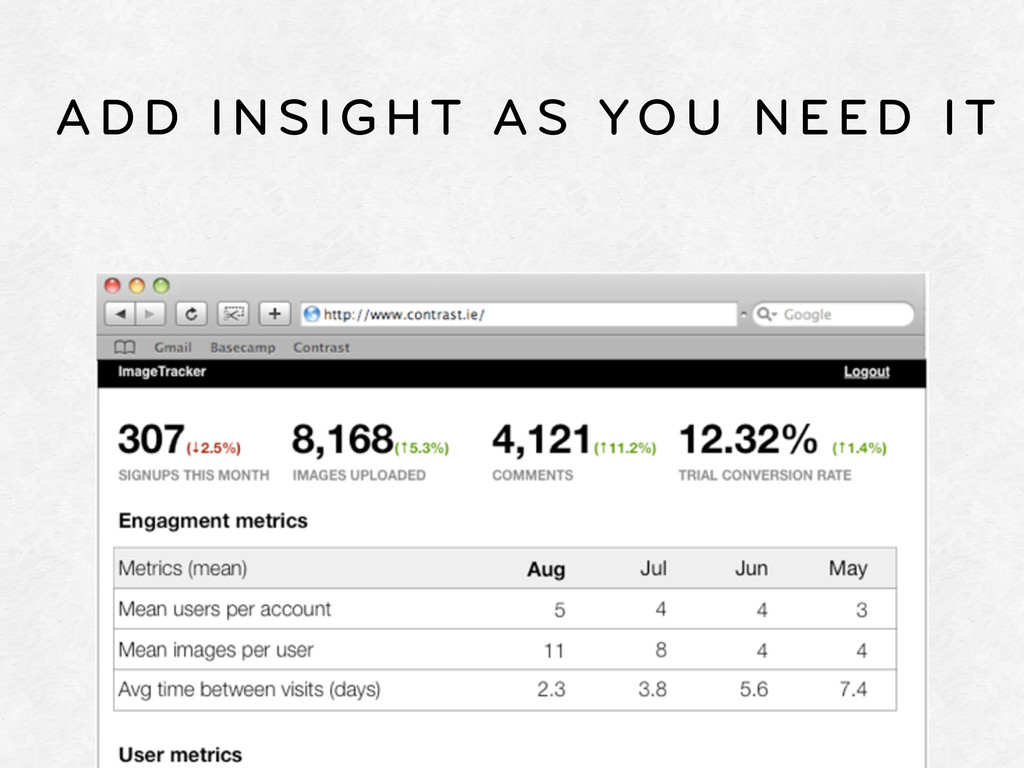
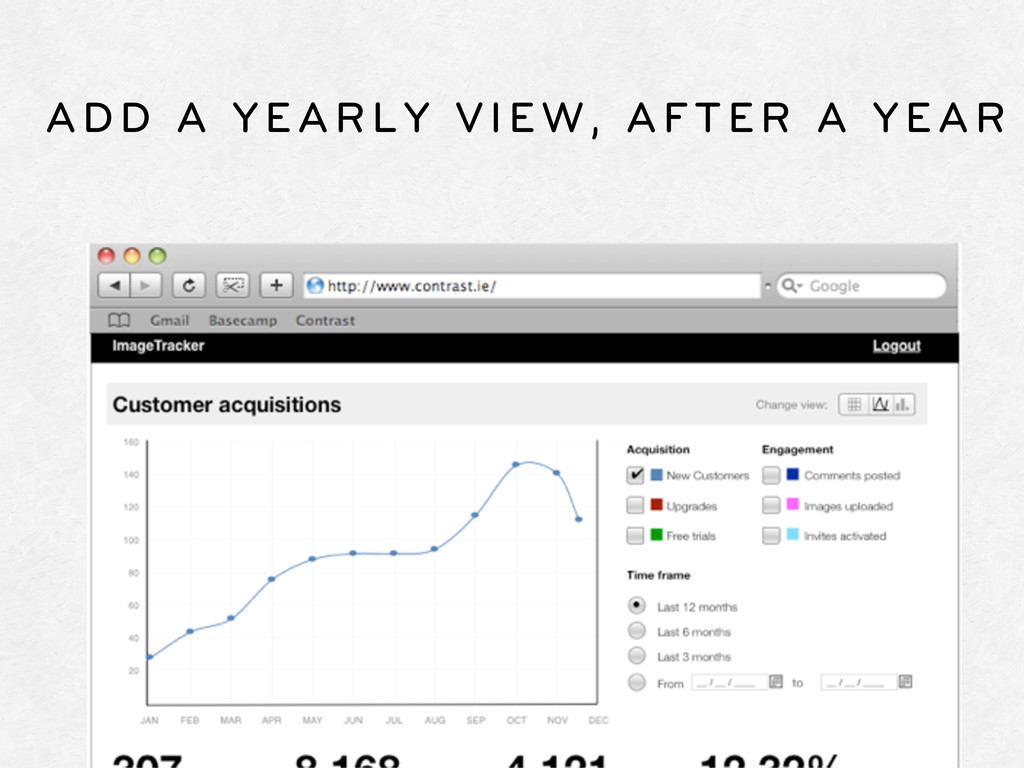
Supporting blog post: http://blog.intercom.io/data-visualisation-in-web-apps/

I have given variations of this presentation at conferences such as WebVisions 12, Beyond Tellerand, MIX 11, MidwestUX.

You can find a video recording of it at
http://vimeo.com/34784156
http://channel9.msdn.com/Events/MIX/MIX11/OPN04

Des Traynor

October 11, 2011
Tweet

More Decks by Des Traynor

Other Decks in Design

Transcript

  1. TOPIC TIME REMAINING INTRO KNOW YOUR AUDIENCE KNOW YOUR DOMAIN

    KNOW YOUR DATA KNOW YOUR VISUALS KNOW YOUR STYLE CLOSING POINTS FIN TRO
  2. Be clear first and clever second. If you have to

    throw one of those out, throw out clever. — Jason Fried “
  3. If the Gulf of Mexico - the 7th largest body

    of water in the world, containing approximately 660 quadrillion gallons of water (that's 660 with 15 zeros) - was represented by Cowboys Stadium in Dallas - the largest domed stadium in the world - how would the spill stack up? In this example, the amount of oil spilled - if the Gulf of Mexico was the size of Cowboys Stadium - would be about the size of a 24 ounce can of beer. Cowboys stadium has an internal volume of approximately 104 million cubic feet, compared to the just over 50 cubic inches of volume in a 24-ounce can. Just like the can, the spilled oil represents only . 00000002788% of the liquid volume present in the Gulf of Mexico, although as the oil is dispersed, the amount of water affected becomes substantially greater.
  4. If the Gulf of Mexico - the 7th largest body

    of water in the world, containing approximately 660 quadrillion gallons of water (that's 660 with 15 zeros) - was represented by Cowboys Stadium in Dallas - the largest domed stadium in the world - how would the spill stack up? In this example, the amount of oil spilled - if the Gulf of Mexico was the size of Cowboys Stadium - would be about the size of a 24 ounce can of beer. Cowboys stadium has an internal volume of approximately 104 million cubic feet, compared to the just over 50 cubic inches of volume in a 24-ounce can. Just like the can, the spilled oil represents only . 00000002788% of the liquid volume present in the Gulf of Mexico, although as the oil is dispersed, the amount of water affected becomes substantially greater.
  5. TOPIC TIME REMAINING INTRO KNOW YOUR AUDIENCE KNOW YOUR DOMAIN

    KNOW YOUR DATA KNOW YOUR VISUALS KNOW YOUR STYLE CLOSING POINTS FIN KNOW YOUR AUDIENCE
  6. CEO Level Detail Strategic view Focus on the long term

    High level overview Simple summary
  7. SALES MARKETING CUSTOMER SUPPORT MANAGEMENT * Satisfaction Rating * Trend

    per quarter * Comparison with competitors ANALYST * My Active leads * Value per lead * Progress towards target OPERATIONS * Active campaigns * Current CPM/CPC * Landing page Role + Department = Information needed
  8. SALES MARKETING CUSTOMER SUPPORT MANAGEMENT * Satisfaction Rating * Trend

    per quarter * Comparison with competitors ANALYST * My Active leads * Value per lead * Progress towards target OPERATIONS * Active campaigns * Current CPM/CPC * Landing page Role + Department = Information needed 1st Takeaway
  9. TOPIC TIME REMAINING INTRO KNOW YOUR AUDIENCE KNOW YOUR DOMAIN

    KNOW YOUR DATA KNOW YOUR VISUALS KNOW YOUR STYLE CLOSING POINTS FIN KNOW YOUR DATA
  10. $ Sales today # Unit sales Avg $ per sale

    This period vs last period Us vs Competitor Total this month Popular products % Change in sales Avg. $ per customer WHICH OF THESE?
  11. WHICH OF THESE? TOTAL SALES $12,240.65 CHANGE 5.32% Top grossing

    items % TOTAL REV. 10 20 30 40 100 200 300 11 12 13 14 15 16 17 18 19 20 21 22 23 24 25 26 27 28 29 30 31 400 500 1 2 3 4 5 6 7 8 9 10 Top selling items Item name Unit sales % of total Oak tree (special edition) 803 16% Pet Kitten 607 12% Skyscraper (high rise) 511 11% Sycamore tree 430 9% Dancing disco. 203 4% Other items 2495 52% Change 11.52% 100% 1.52% 5.23% 1.20% -- 100 200 300 400 500 Ybarra Bow Broadsword Dagger Eclipse Mace BattleAxe Magic wand Crossbow Poison Revenue 5 10 15 20 25 Unit sales
  12. 1. COMMUNICATE A SINGLE FIGURE Used when context is obvious,

    precision is required, and past/future is irrelevant to user. BALANCE $23.00 BALANCE $11.32 BALANCE $11.32 Examples: AA clerk with a waiting list Checking bank balance Sys admin checking current status Notes: Single numbers can have states
  13. 2. SINGLE FIGURE WITH CONTEXT “How are we doing lately?

    Any problems on horizon?” Examples: How were this months sales? Is the network performing well? Hows our user figures looking? Notes: Spark-lines can save space, and READERS 12,247 CHANGE 0.32% READERS 15,231 CHANGE 9.52%
  14. 3. ANALYSIS OF A PERIOD “Show me all the key

    moments this month” Examples: Looking for patterns in longer data sets Looking ahead based on current data Comparison with previous period
  15. 10 20 30 11 12 13 14 15 16 17

    18 19 20 21 22 23 24 25 26 27 28 29 30 31 40 50 1 2 3 4 5 6 7 8 9 10 Work best with precise data (e.g. day to day) GOOD LINE CHART
  16. 10 20 30 40 50 Jan Feb Mar Apri May

    BAR CHART Never imply precision you don’t have.
  17. 10 20 30 40 50 Jan Feb Mar Apri May

    BAR CHART Never imply precision you don’t have. 2nd Takeaway
  18. 4. ANALYSIS OF PERIOD, WITH TARGET Did we hit our

    sales figures? Are we fulfilling our five nines quota? Examples: Are sales were they should be? Are all our employees performing okay? Is our response time better than industry standard?
  19. 0 12500 25000 37500 50000 Jan Feb Mar April May

    June July August September October November December Actual Target BAD LINE CHART
  20. A common error in visualisation is leaving all the processing

    to the reader. At a glance it looks like we’re doing okay here. In this case, we’re talking about a delta, but we’re not showing the delta...
  21. A common error in visualisation is leaving all the processing

    to the reader. At a glance it looks like we’re doing okay here. In this case, we’re talking about a delta, but we’re not showing the delta... 3rd Takeaway
  22. -40% -30% -20% -10% 0% 10% 20% Jan Feb Mar

    April May June July August September October November December FOCUS ON THE DELTA Same data, big difference
  23. 0 12500 25000 37500 50000 Jan Feb Mar April May

    June July August September October November December BAD LINE CHART This guy is getting a bonus
  24. -40% -30% -20% -10% 0% 10% 20% Jan Feb Mar

    April May June July August September October November December FOCUS ON THE DELTA This guy is getting fired.
  25. JUL JUN MAY APR MAR FEB JAN NOV OCT SEP

    AUG DEC 29% 100% 23% 38% 7% 28% 24% 100% 7% 100% 21% 100% 20% 23% 24% 31% 17% 17% 41% 27% 17% 21% 35% 40% 24% 34% 18% 18% 16% 100% 33% 22% 23% 23% 17% 33% 17% 16% 25% 18% 100% 15% 17% 21% 35% 100% 18% 26% 32% 20% 100% 26% 17% 100% 32% 19% 18% 100% 18% 17% 100% 22% 28% 1 2 3 4 5 6 7 8 9 10 11 12 48% Showing: % of total % of prev. month Highlight drops over: 5% A full cohort analysis 24% 23% % Active in months after signup Sign Up 18% of January sign ups are still active in July
  26. 23% 7% 24% 7% 21% 20% 23% 24% 17% 17%

    27% 17% 21% 18% 18% 16% 22% 23% 23% 17% 17% 16% 18% 15% 17% 21% 18% 32% 20% 17% 19% 18% 18% 17% 22% 28% 4 5 6 7 8 9 10 11 signup 18% of January sign ups are still active in July
  27. JUL JUN MAY APR MAR NOV OCT SEP AUG DEC

    29% 23% 38% 28% 24% 100% 100% 21% 100% 23% 24% 31% 41% 27% 35% 40% 34% 100% 33% 23% 23% 33% 25% 100% 17% 21% 35% 100% 32% 100% 26% 100% 32% 19% 18% 100% 22% 28% 48% Showing: % of total % of prev. month
  28. How many stick around for a second month? 35% 30%

    25% 20% 15% 10% 5% January February March April 32.4% Signed up:
  29. Retention using a cycle plot 35% 30% 25% 20% 15%

    10% 5% 0% Month 2 Retention Month 3 Retention Month 4 Retention Month 5 Retention
  30. 35% 30% 25% 20% Signups in April 2011 26% Still

    Active in June 101 retained - 290 lost.
  31. 5. BREAKDOWN OF A VARIABLE “What age groups are buying

    our stuff? What countries are we big in?” Examples: Who are our customers? Whats our awareness like in each demographic? What browsers are people using these days?
  32. 5. BREAKDOWN OF A VARIABLE “Bar charts aren’t sexy, but

    they rely on an innate skill, following a line. ”
  33. 6. BREAKDOWN OVER TIME “How has the composition changed over

    the last year?” Examples: How has the browser market changed? Has our revenue sources shifted recently?
  34. 0 17500 35000 52500 70000 Jan Feb Mar April May

    June July August September October November December Ireland U.K America STACKED BAR CHART
  35. 0 17500 35000 52500 70000 Jan Feb Mar April May

    June July August September October November December STACKED BAR CHART A($!&)* +$,-$" &. J/01? America peaked in July?
  36. 0 17500 35000 52500 70000 Jan Feb Mar April May

    June July August September October November December STACKED BAR CHART A($!&)* +$,-$" &. J/01? How has U.K. done?
  37. 0 17500 35000 52500 70000 Jan Feb Mar April May

    June July August September October November December LYING WITH DIMENSIONS Lots more yellow pixels here now...
  38. LET’S TRY A LINE CHART 0 12500 25000 37500 50000

    Jan Feb Mar April May June July August September October November December Ireland U.K America
  39. LINE CHART OF SAME DATA? 0 12500 25000 37500 50000

    Jan Feb Mar April May June July August September October November December A($!&)* #. 23$ 4+. 5K .$6$! 73*.8$"? Same data. Different story.
  40. 0 12500 25000 37500 50000 Jan Feb Mar April May

    June July August September October November December Ireland U.K America BAR CHARTS AGAIN?
  41. 0 12500 25000 37500 50000 Jan Feb Mar April May

    June July August September October November December BAR CHARTS AGAIN?
  42. 0 12500 25000 37500 50000 Jan Feb Mar April May

    June July August September October November December BAR CHARTS AGAIN?
  43. 0 12500 25000 37500 50000 Jan Feb Mar April May

    June July August September October November December BAR CHARTS AGAIN?
  44. 0 12500 25000 37500 50000 Jan Feb Mar April May

    June July August September October November December INTERACTIVE, REMEMBER? You can adapt based on Interctions
  45. 0 17500 35000 52500 70000 Jan Feb Mar April May

    June July August September October November December STACKED BAR CHART Why is it so hard to follow the U.K here?
  46. TOPIC TIME REMAINING INTRO KNOW YOUR AUDIENCE KNOW YOUR DOMAIN

    KNOW YOUR DATA KNOW YOUR VISUALS KNOW YOUR STYLE CLOSING POINTS FIN KNOW YOUR VISUALS
  47. You’ve just taken over a hotel. You’re handed the accounts.

    Excel hell. Where do we start? HOW TO USE ALL THIS?
  48. Q: Are we making any money? Profit is the delta

    between costs and revenue. Let’s see that for the year. -€9,000.00 -€6,750.00 -€4,500.00 -€2,250.00 €0 €2,250.00 €4,500.00 €6,750.00 €9,000.00 Jan Feb Mar April May June July August September October November December Profit and loss
  49. Q: What makes us money? Rms Wdgs Cfc Buss Rtaurt

    B Gym/Spa 10% 20% 30% 40% 50% Let’s compare the percentage of revenue generated by each category.
  50. King suite Junior Suite Standard Room Hostel €50 €75 €100

    €150 €175 Deluxe Room Q: What sort of prices do we charge per room? Let’s look at the price range the median value
  51. REPORT REVENUE TYPE ROOMS & EXTRAS ROOM TYPE KING SUITES

    PERIOD LAST YEAR MIDWEST HOTELZ PROFIT LOYALTY INCIDENTALS GUEST REPORT WEDDINGS CONFERENCES GUEST TYPE ALL GUESTS Design to support analyst queries...
  52. TOPIC TIME REMAINING INTRO KNOW YOUR AUDIENCE KNOW YOUR DOMAIN

    KNOW YOUR DATA KNOW YOUR VISUALS KNOW YOUR STYLE CLOSING POINTS FIN KNOW YOUR STYLE
  53. Top products Product Orders $ Revenue Books Electronics Magazines Appliances

    e-goods Other 10 20 30 40 Revenue per product Sales Report Jan 2012 ORDERS 12,247 CHANGE 0.32% ACCOUNTS 7,343 CHANGE 4.32% SITE LIVE PAYMENT LIVE FULFILLMENT ON
  54. Top products Product Orders $ Revenue Books Electronics Magazines Appliances

    e-goods Other 10 20 30 40 Revenue per product Sales Report Jan 2012 ORDERS 12,247 CHANGE 0.32% ACCOUNTS 7,343 CHANGE 4.32% SITE LIVE PAYMENT LIVE FULFILLMENT ON Let’s use this strawman
  55. Smallest Effective Difference: the least you can do to highlight

    These colours would get very loud. Unnecessarily so.
  56. Top products Product Orders $ Revenue The girl with the

    dragon tattoo 11 88.50 Inception 9 72.50 The girl who kicked the hornet's nest 15 54.05 Books Electronics Magazines Appliances e-goods Other 10 20 30 40 Revenue per product Sales Report Jan 2012 ORDERS 12,247 CHANGE 0.32% ACCOUNTS 7,343 CHANGE 4.32% SITE LIVE PAYMENT LIVE FULFILLMENT ON Gradients, shadows, colors, gridlines. All non-content
  57. Top products Product Orders $ Revenue The girl with the

    dragon tattoo 11 88.50 Inception 9 72.50 The girl who kicked the hornet's nest 15 54.05 Books Electronics Magazines Appliances e-goods Other 10 20 30 40 Revenue per product Sales Report Jan 2012 ORDERS 12,247 CHANGE 0.32% ACCOUNTS 7,343 CHANGE 4.32% SITE LIVE PAYMENT LIVE FULFILLMENT ON Let’s kill the gradients
  58. Top products Product Orders $ Revenue The girl with the

    dragon tattoo 11 88.50 Inception 9 72.50 The girl who kicked the hornet's nest 15 54.05 Books Electronics Magazines Appliances e-goods Other 10 20 30 40 Revenue per product Sales Report Jan 2012 ORDERS 12,247 CHANGE 0.32% ACCOUNTS 7,343 CHANGE 4.32% SITE LIVE PAYMENT LIVE FULFILLMENT ON Let’s kill the colours
  59. HTML has a <strong>tag but no <weak> tag. As a

    result, we forget to think about what’s less important on the screen. — Ryan Singer
  60. Top products Product Orders $ Revenue The girl with the

    dragon tattoo 11 88.50 Inception 9 72.50 The girl who kicked the hornet's nest 15 54.05 Books Electronics Magazines Appliances e-goods Other 10 20 30 40 Revenue per product Sales Report Jan 2012 ORDERS 12,247 CHANGE 0.32% ACCOUNTS 7,343 CHANGE 4.32% SITE LIVE PAYMENT LIVE FULFILLMENT ON Let’s adjust the shading.
  61. Top products Product Orders $ Revenue The girl with the

    dragon tattoo 11 88.50 Inception 9 72.50 The girl who kicked the hornet's nest 15 54.05 Books Electronics Magazines Appliances e-goods Other 10 20 30 40 Revenue per product Sales Report Jan 2012 ORDERS 12,247 CHANGE 0.32% ACCOUNTS 7,343 CHANGE 4.32% SITE LIVE PAYMENT LIVE FULFILLMENT ON Let’s add the necessary differences
  62. Top products Product Orders $ Revenue The girl with the

    dragon tattoo 11 88.50 Inception 9 72.50 Books Electronics Magazines Appliances e-goods Other 10 20 30 40 Revenue per product Sales Report Jan 2012 ORDERS 12,247 CHANGE 0.32% ACCOUNTS 7,343 CHANGE 4.32% SITE LIVE PAYMENT LIVE FULFILLMENT ON From here we could begin to style
  63. Top products Product Orders $ Revenue The girl with the

    dragon tattoo 11 88.50 Books Electronics Magazines Appliances e-goods Other 10 20 30 40 Revenue per product SALES REPORT MAY 2012 ORDERS 12,247 SITE PAYMENT FULFILLMENT 0.4% ACCOUNTS 2,323 1.4%
  64. 4 Points on Visual Design 1. Remove Chart Junk 2.

    Maximise your data ink ratio 3. Use the “least effective difference” to highlight 4. Remember to quieten down less important parts.
  65. 4 Points on Visual Design 1. Remove Chart Junk 2.

    Maximise your data ink ratio 3. Use the “least effective difference” to highlight 4. Remember to quieten down less important parts. 6th Takeaway
  66. TOPIC TIME REMAINING INTRO KNOW YOUR AUDIENCE KNOW YOUR DOMAIN

    KNOW YOUR DATA KNOW YOUR VISUALS KNOW YOUR STYLE CLOSING POINTS FIN CLOSING POINTS
  67. 3. PRESENTING AN ARGUMENT It’s okay to add visuals if

    your goal is more than the factual presentation of information
  68. The world is not filled with professional statisticians. Many of

    us would like a quick glance just to get a good idea of something. If a graph is made easier to understand by such irrelevancies as a pile of oil cans or cars, then I say all the better. — Don Norman
  69. 0 5 10 15 J Feb M Apr May Jun

    Jul Aug Sep Oct Nov Dec Get your data first.
  70. Usability is not everything. If usability engineers designed a nightclub,

    it would be clean, quiet, brightly lit, with lots of places to sit down, plenty of bartenders, menus written in 18-point sans-serif, and easy-to-find bathrooms. But nobody would be there. They would all be down the street at Coyote Ugly pouring beer on each other. — Joel Spolsky
  71. 4. THEY’RE NOT ALL FIRST TIMERS Like chess players understand

    chessboards, people can learn to understand visualisations
  72. Books Stephen Few - “Dashboard Design” & “Now you see

    it” Brian Suda - “Designing with Data” Edward Tufte - The first two. Blogs Stephen Few -> http://perceptualedge.com Intercom (me) -> http://blog.intercom.io
  73. TOPIC TIME REMAINING INTRO KNOW YOUR AUDIENCE KNOW YOUR DOMAIN

    KNOW YOUR DATA KNOW YOUR VISUALS KNOW YOUR STYLE CLOSING POINTS FIN FIN