Upgrade to Pro — share decks privately, control downloads, hide ads and more …

"Big Data Oceanography" at PyDataLondon 2018

Sponsored · Ship Features Fearlessly Turn features on and off without deploys. Used by thousands of Ruby developers. →

"Big Data Oceanography" at PyDataLondon 2018

A historical challenge in oceanography has been a limited amount of observational data. The ocean is effectively opaque to electromagnetic radiation and in-situ measurements traditionally require very expensive ship-based observations. Recently, there has been an explosive increase in data richness as new initiatives such as cabled ocean observatories and autonomous sensor platforms are deployed. Programs such as the international ARGO program, the international Global Drifter program, and the Ocean Observatory Initiative are producing unprecedented amounts of in-situ oceanographic data at very high resolutions.

Multiplying the ocean data volume growth of observations by a factor of 100 or more is the output produced by numerical ocean-ice-atmosphere analysis and prediction systems. This is being done on high-performance computing in supercomputing centres running on thousands of cores concurrently. The volume of this data output constantly increases in time, as computer capacity increases and ocean-ice model resolution increases. For example, global ocean circulation models are routinely run at one-quarter of a degree resolution and configurations as high as 1/30th of a degree resolution are being proposed. Regional models are being produced up to 1/32nd degree resolution over substantial geographic areas. Such simulations are typically run daily for short period forecasts (2-90 days) and in planned long-term runs of decades or more (projections). Furthermore, there is a move to expand simulations to ensemble runs, where these already large ocean models are run 50 to 100 times using various stochastic perturbations to create an ensemble of ocean conditions.

Accurately and effectively finding meaning in this volume of data poses a substantial challenge. The traditional approach has been to run a model on a supercomputer and then download the output as well as observation data onto a local workstation for further analysis, processing, and synthesis into journal papers and plots to increase our understanding. The challenge here is that the size of the model output can be larger than the physical resources (memory, computing power and storage) of the workstation, and Internet transfer of large data is prohibitively slow. To keep data volume within local workstation limits, the researcher often aggregates data into spatial or temporal means, or re-grids to a coarser numerical grid. The former is a problem if the researcher is studying extreme events, and the latter if she is interested in the detailed ocean conditions in a specific area. Full grid resolution output provides maximum accuracy and the best flexibility for downstream analysis.

Problems introduced by large-scale data are not unique to oceanography, and various approaches exist to manage this data. However, these approaches are often not compatible with existing workflows or the data training scientists receive. A related challenge is the reproducibility of data-intensive computations; there is a fragmentation of software tools and environments render most atmospheric, ocean, and climate research effectively unreproducible and prone to failure. In this talk, I will discuss recent progress in trying to close this technology gap to enable scientists to work with the ever-increasing size of datasets and some ideas on making scientific workflows more reproducible. As a specific example, I will present techniques for performing offline diagnostics for ocean models that are currently limited by insufficient memory or disk space. The Python modules xarray (N-D labelled arrays and datasets) and dask (a parallel computing library) will be discussed as tools that can build scalability into oceanographic analysis.

Avatar for James Munroe

James Munroe

April 29, 2018

Other Decks in Technology

Transcript

  1. BIG DATA OCEANOGRAPHY DATA INTENSIVE WORKFLOWS AND COSIMA COOKBOOK DR.

    JAMES MUNROE MEMORIAL UNIVERSITY OF NEWFOUNDLAND SWEETWATER CONSULTANTS INC. APRIL 2018
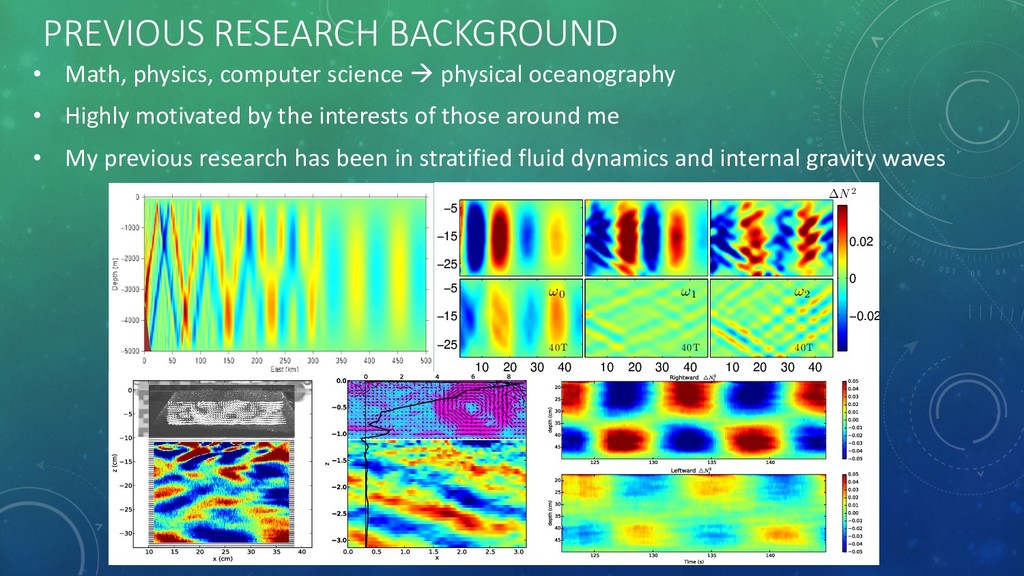
  2. z(cm) −25 −15 −5 ∆N 2 −0.02 0 0.02 x(cm)

    z(cm) 10 20 30 40 −25 −15 −5 x(cm) 10 20 30 40 x(cm) 10 20 30 40 ω0 40T ω1 40T ω2 40T • Math, physics, computer science à physical oceanography • Highly motivated by the interests of those around me • My previous research has been in stratified fluid dynamics and internal gravity waves PREVIOUS RESEARCH BACKGROUND
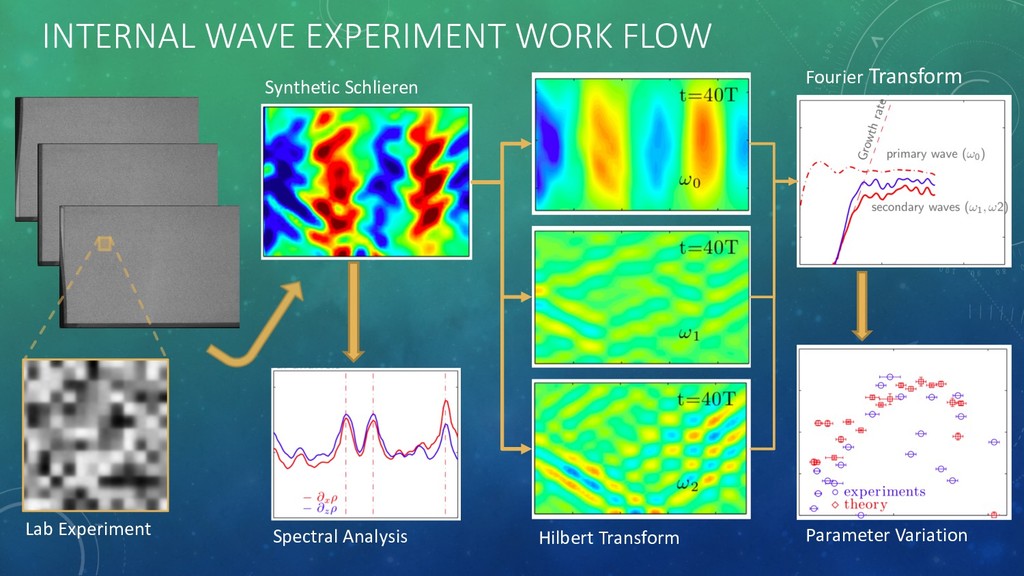
  3. INTERNAL WAVE EXPERIMENT WORK FLOW Synthetic Schlieren Spectral Analysis Hilbert

    Transform Parameter Variation Fourier Transform Lab Experiment
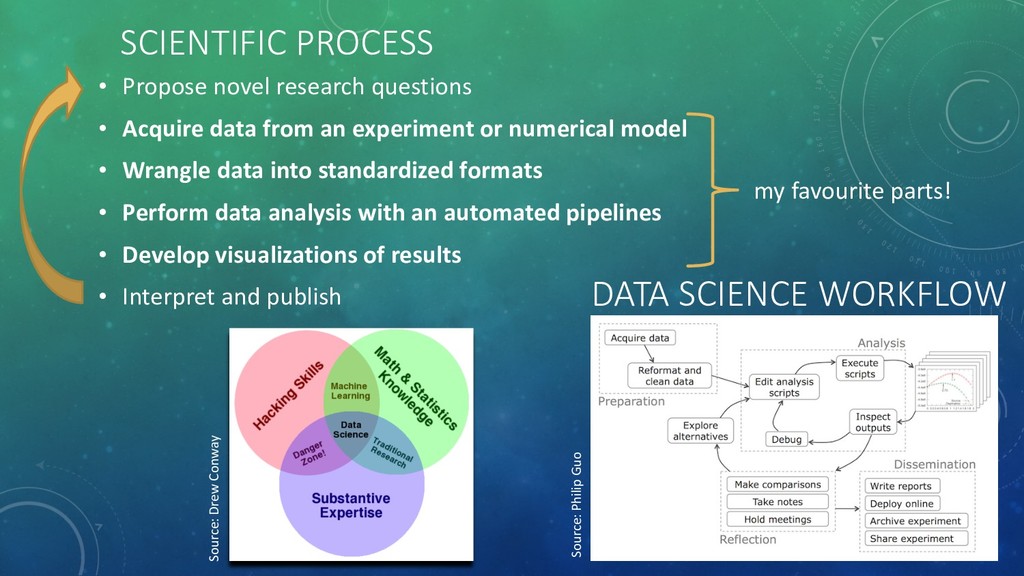
  4. SCIENTIFIC PROCESS • Propose novel research questions • Acquire data

    from an experiment or numerical model • Wrangle data into standardized formats • Perform data analysis with an automated pipelines • Develop visualizations of results • Interpret and publish my favourite parts! Source: Drew Conway DATA SCIENCE WORKFLOW Source: Philip Guo
  5. BIG DATA IN OBSERVATIONAL OCEANOGRAPHY • Historical challenge: limited amount

    of observational data, usually ship-based • New opportunities: cabled ocean observatories and autonomous sensor platforms. • New challenges: in-situ oceanographic data at very high resolutions from programs, like ARGO project and Ocean Observatory Initiatives.
  6. BIG DATA IN OCEANOGRAPHIC MODELLING • Even more data is

    the output produced by numerical ocean-ice-atmosphere analysis and prediction systems. • The volume of this data output constantly increases in time, as computer capacity increases and ocean-ice model resolution increases. • For example, global ocean circulation models are routinely run at 1/4 degree with 1/10 degree models becoming coming. Regional models are being produced up to 1/32nd degree resolution over substantial geographic areas. • Simulations are run daily for short period forecasts (2-90 days) and in planned long-term runs of decades or more (projections). Ensemble forecasts (50-100x) using stochastic perturbations create even larger datasets.
  7. CHALLENGES IN BIG DATA OCEANOGRAPHY • How do we (both

    scientists and other end users) find meaning in this volume of data? • A traditional approach: • run a model on a supercomputer • download the output and observation data onto a local workstation • perform analysis, processing, and synthesis • Challenge: size of the model output is larger than the physical resources of the workstation, and Internet transfer of large data is slow. • Common solutions to local workstation limits: • aggregate data into spatial or temporal means – a problem if studying extreme events • re-grid to a coarser numerical grid – problem if interested in the detailed ocean conditions in a specific area
  8. CHALLENGES IN ATMOSPHERE / OCEAN / LAND / CLIMATE SCIENCE

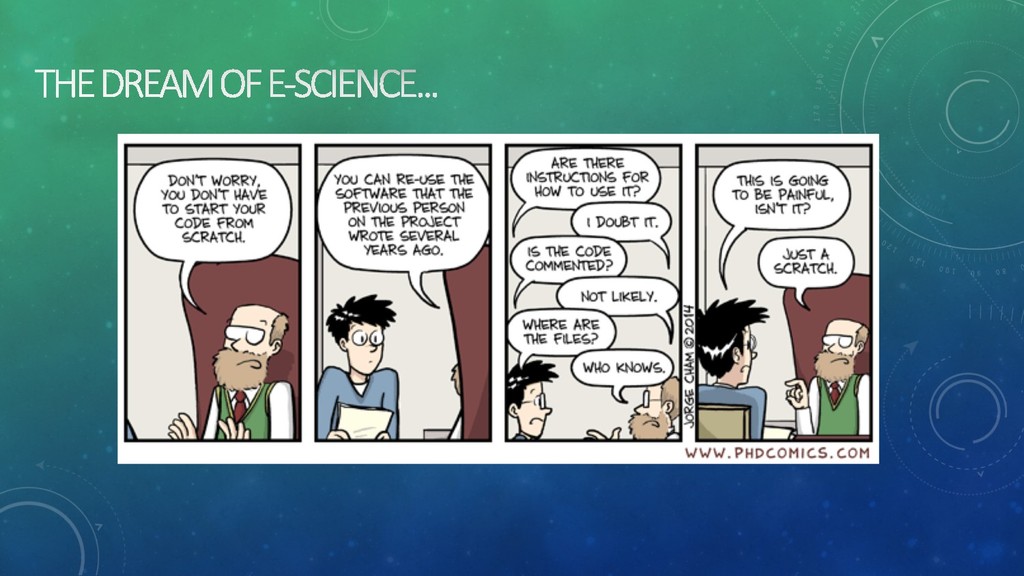
    • Large-scale data issues re not unique to oceanography • various approaches exist to manage this data. • Approaches are often not compatible with existing workflows or the data training scientists receive. • Issues with reproducibility of data-intensive computations • fragmentation of software tools and environments render most atmospheric, ocean, and climate research effectively unreproducible and prone to failure.
  9. PANGEO DATA • Big Data: datasets are growing too rapidly

    and legacy software tools for scientific analysis can’t handle them. This is a major obstacle to scientific progress. • Technology Gap: a growing gap between the technological sophistication of industry solutions (high) and scientific software (low). • Reproducibility: a fragmentation of software tools and environments renders most AOC research effectively unreproducible and prone to failure. https://pangeo-data.github.io
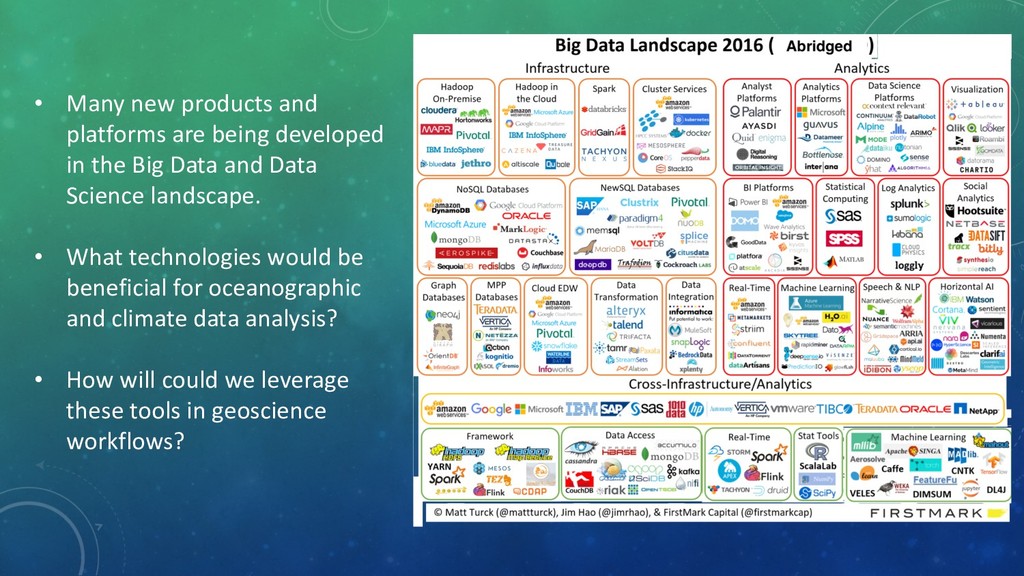
  10. • Many new products and platforms are being developed in

    the Big Data and Data Science landscape. • What technologies would be beneficial for oceanographic and climate data analysis? • How will could we leverage these tools in geoscience workflows?
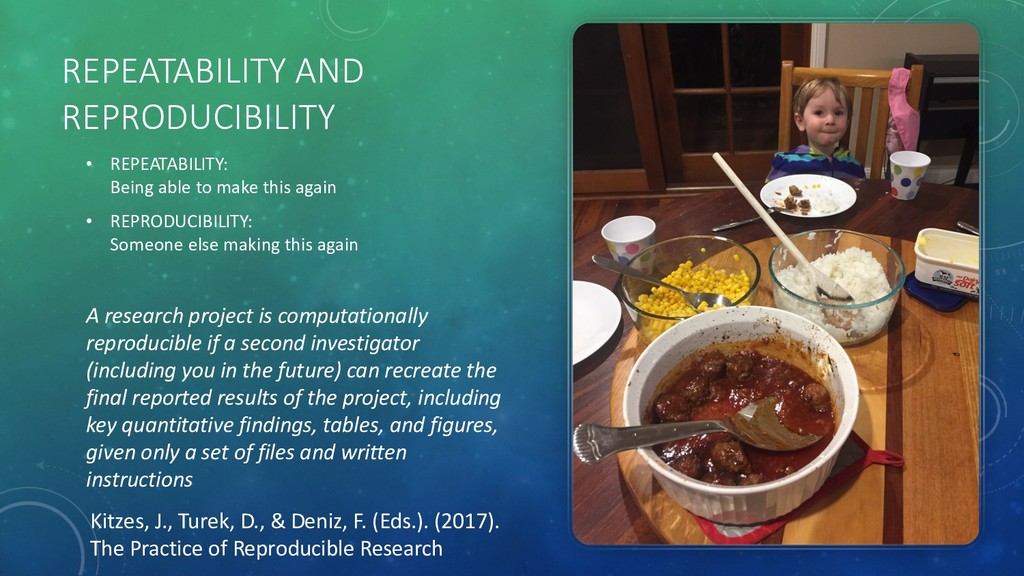
  11. REPEATABILITY AND REPRODUCIBILITY • REPEATABILITY: Being able to make this

    again • REPRODUCIBILITY: Someone else making this again A research project is computationally reproducible if a second investigator (including you in the future) can recreate the final reported results of the project, including key quantitative findings, tables, and figures, given only a set of files and written instructions Kitzes, J., Turek, D., & Deniz, F. (Eds.). (2017). The Practice of Reproducible Research
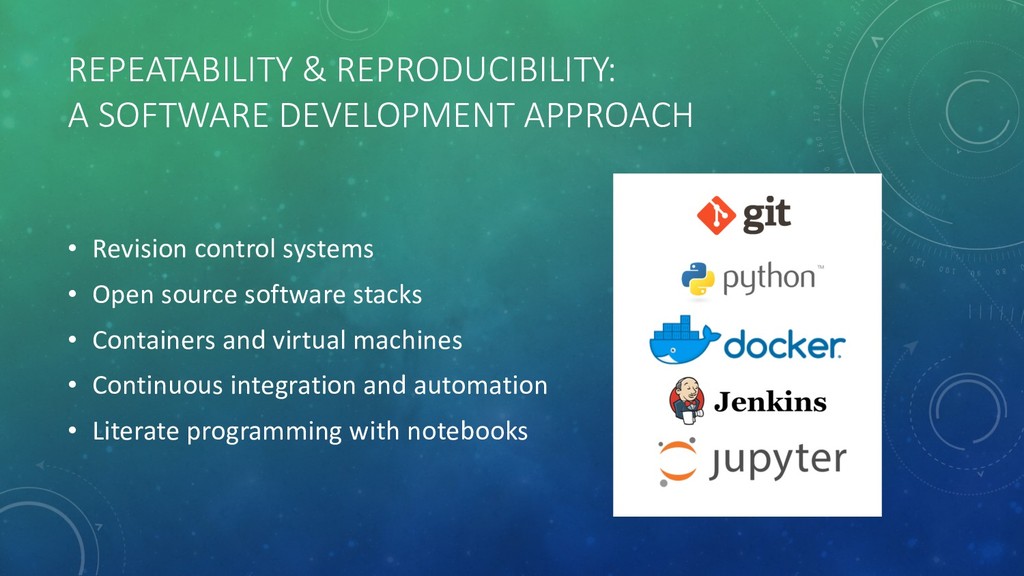
  12. REPEATABILITY & REPRODUCIBILITY: A SOFTWARE DEVELOPMENT APPROACH • Revision control

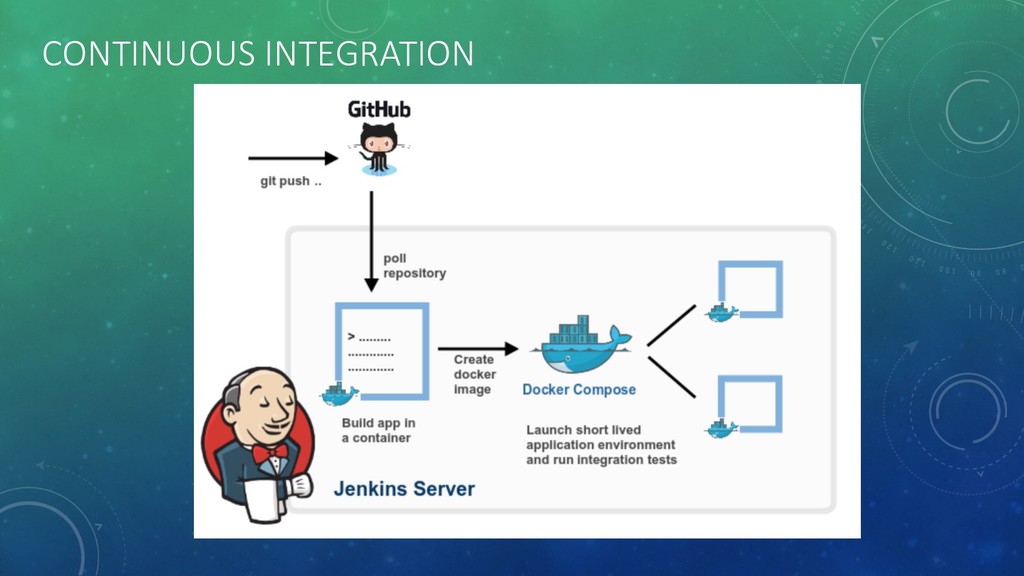
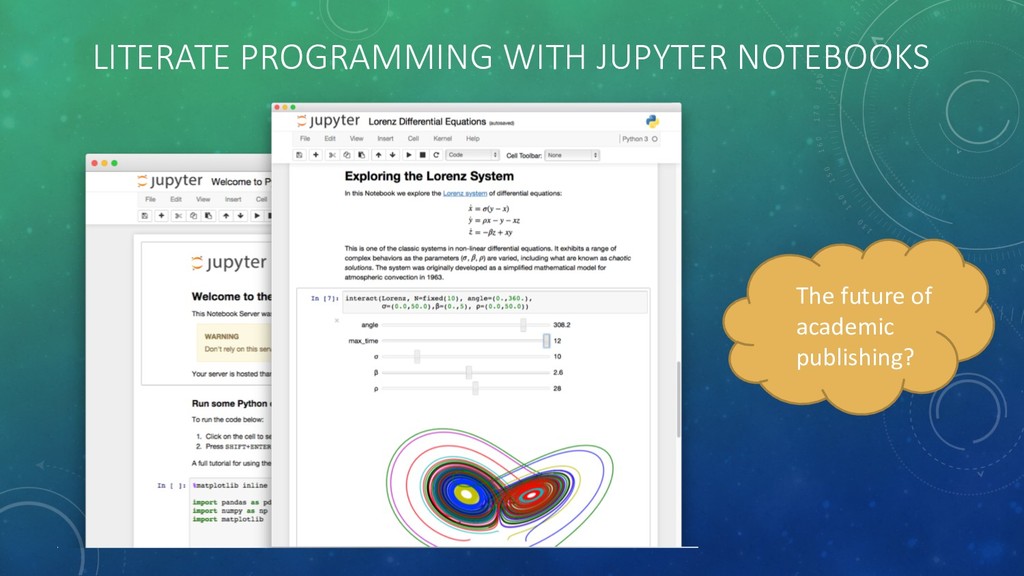
    systems • Open source software stacks • Containers and virtual machines • Continuous integration and automation • Literate programming with notebooks
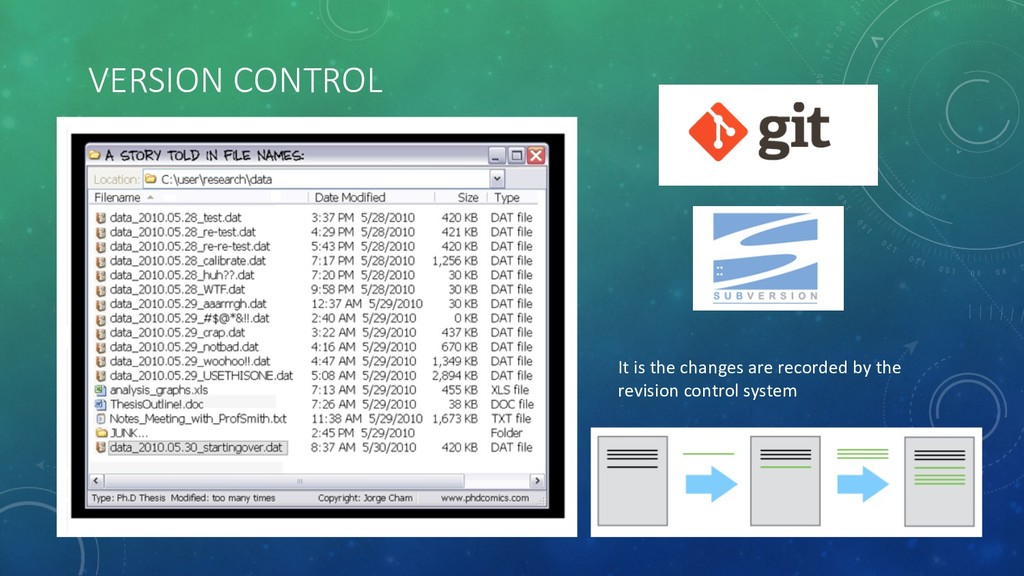
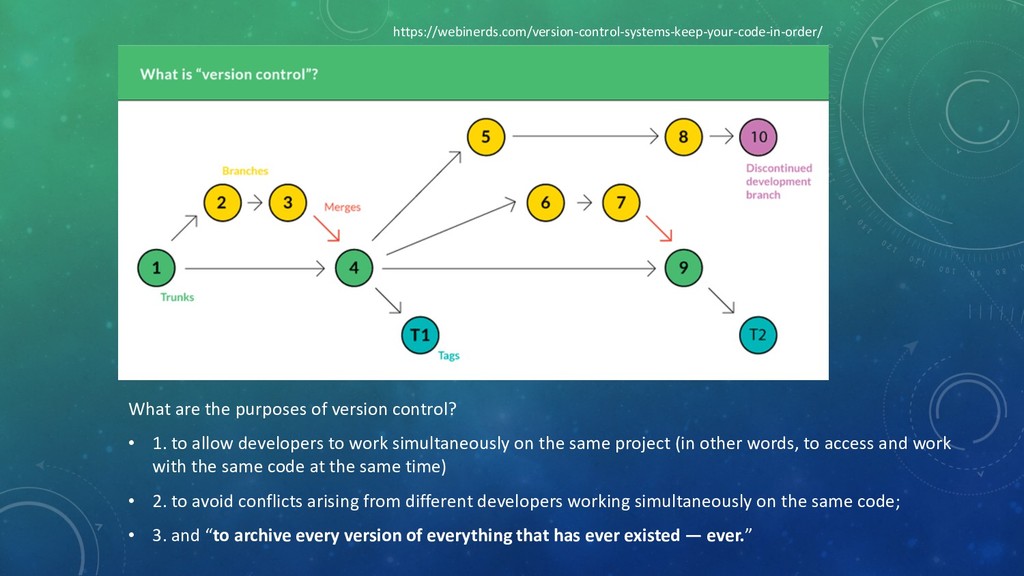
  13. What are the purposes of version control? • 1. to

    allow developers to work simultaneously on the same project (in other words, to access and work with the same code at the same time) • 2. to avoid conflicts arising from different developers working simultaneously on the same code; • 3. and “to archive every version of everything that has ever existed — ever.” https://webinerds.com/version-control-systems-keep-your-code-in-order/
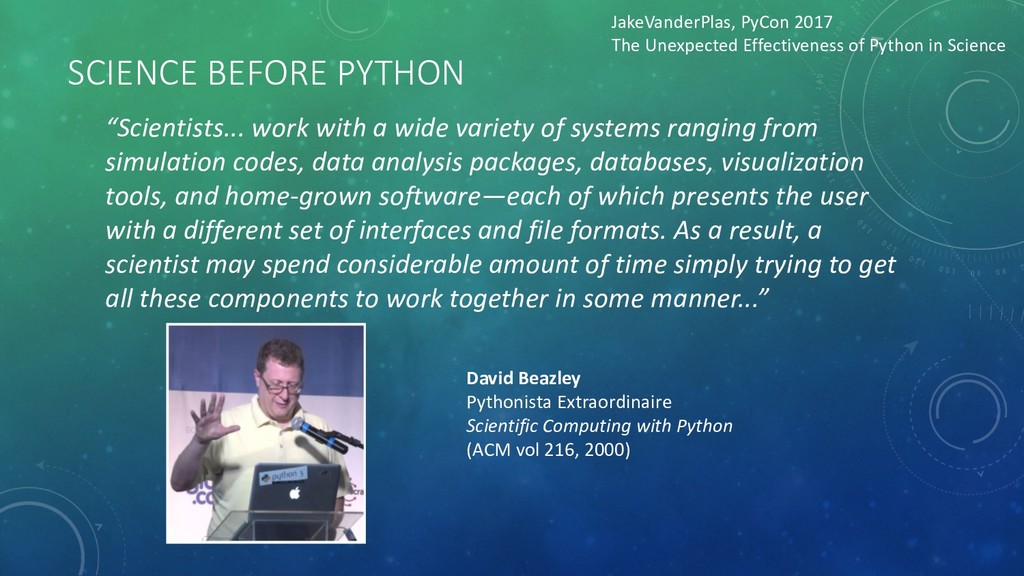
  14. SCIENCE BEFORE PYTHON “Scientists... work with a wide variety of

    systems ranging from simulation codes, data analysis packages, databases, visualization tools, and home-grown software—each of which presents the user with a different set of interfaces and file formats. As a result, a scientist may spend considerable amount of time simply trying to get all these components to work together in some manner...” David Beazley Pythonista Extraordinaire Scientific Computing with Python (ACM vol 216, 2000) JakeVanderPlas, PyCon 2017 The Unexpected Effectiveness of Python in Science
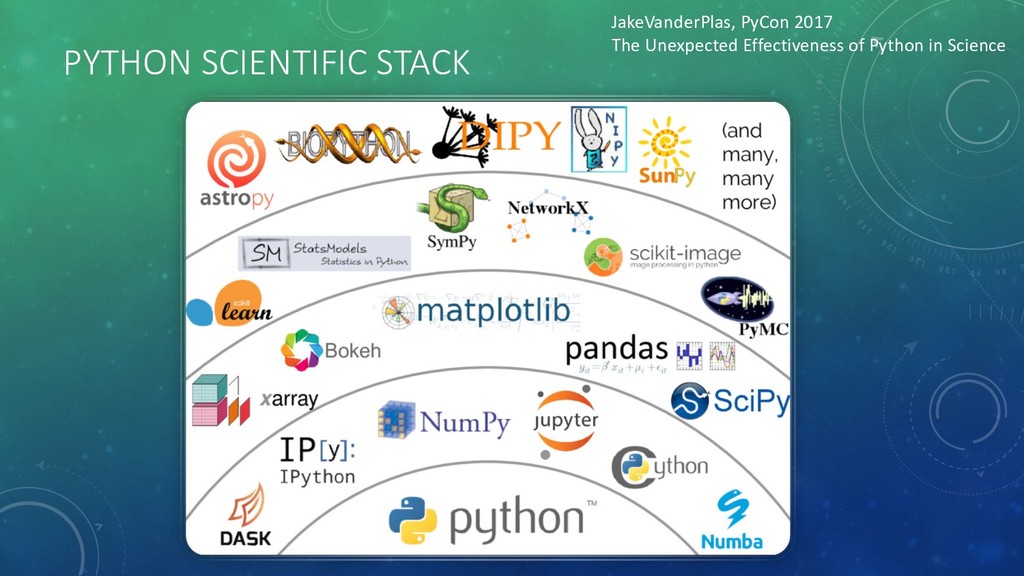
  15. JakeVanderPlas, PyCon 2017 The Unexpected Effectiveness of Python in Science

    WHY IS PYTHON SUCH AN EFFECTIVE TOOL IN SCIENCE? 1. Interoperability with other languages 2. “Batteries included” + third-party modules 3. Simplicity & dynamic nature 4. Open ethos well-fit to science Python glues together this hodge-podge of scientific tools. High-level syntax wraps low-level C/Fortran libraries, which is (mostly) where the computation happens. Python is Glue.
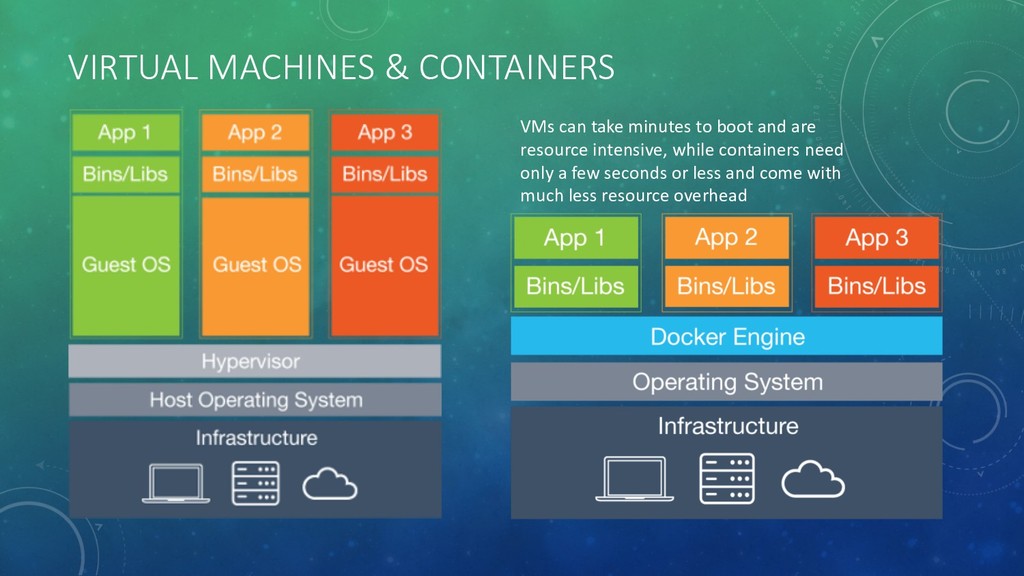
  16. VIRTUAL MACHINES & CONTAINERS VMs can take minutes to boot

    and are resource intensive, while containers need only a few seconds or less and come with much less resource overhead
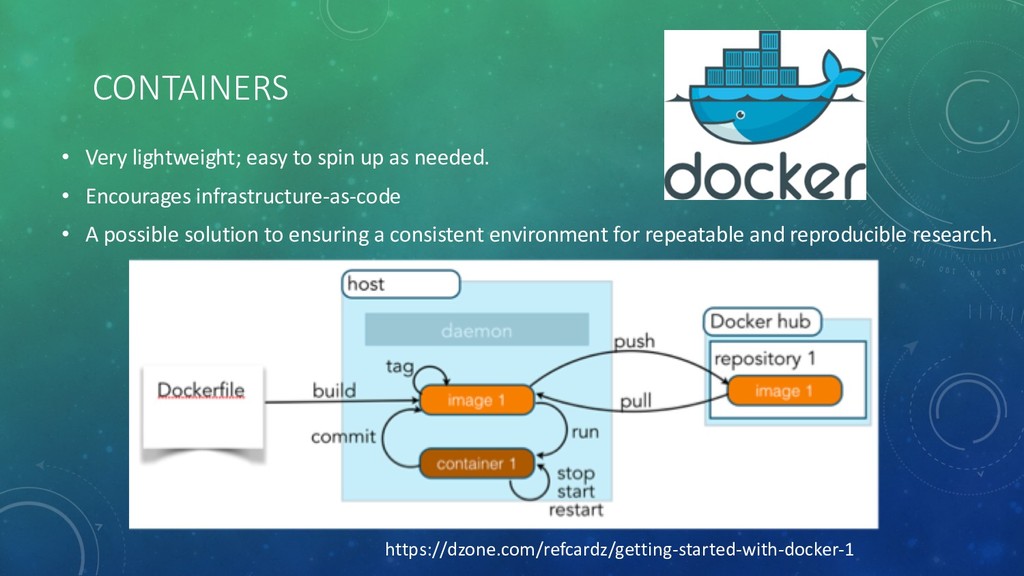
  17. CONTAINERS • Very lightweight; easy to spin up as needed.

    • Encourages infrastructure-as-code • A possible solution to ensuring a consistent environment for repeatable and reproducible research. https://dzone.com/refcardz/getting-started-with-docker-1
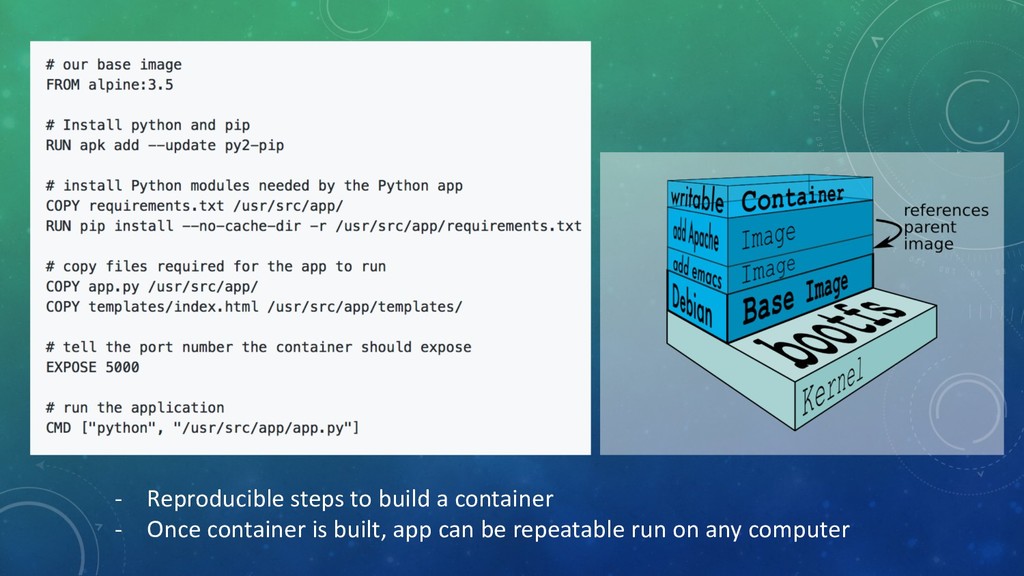
  18. DOCKERFILE - Reproducible steps to build a container - Once

    container is built, app can be repeatable run on any computer
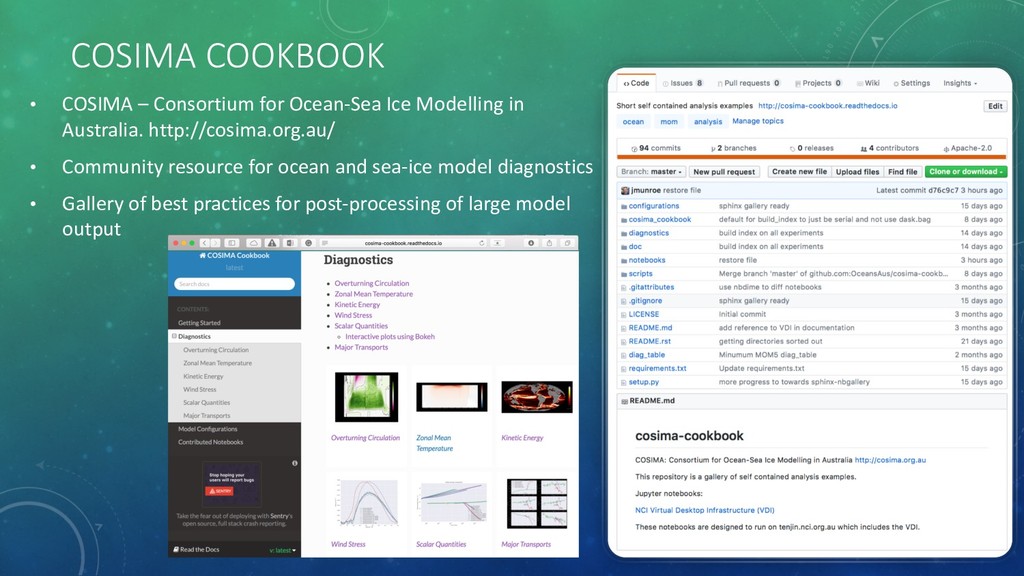
  19. COSIMA COOKBOOK • COSIMA – Consortium for Ocean-Sea Ice Modelling

    in Australia. http://cosima.org.au/ • Community resource for ocean and sea-ice model diagnostics • Gallery of best practices for post-processing of large model output
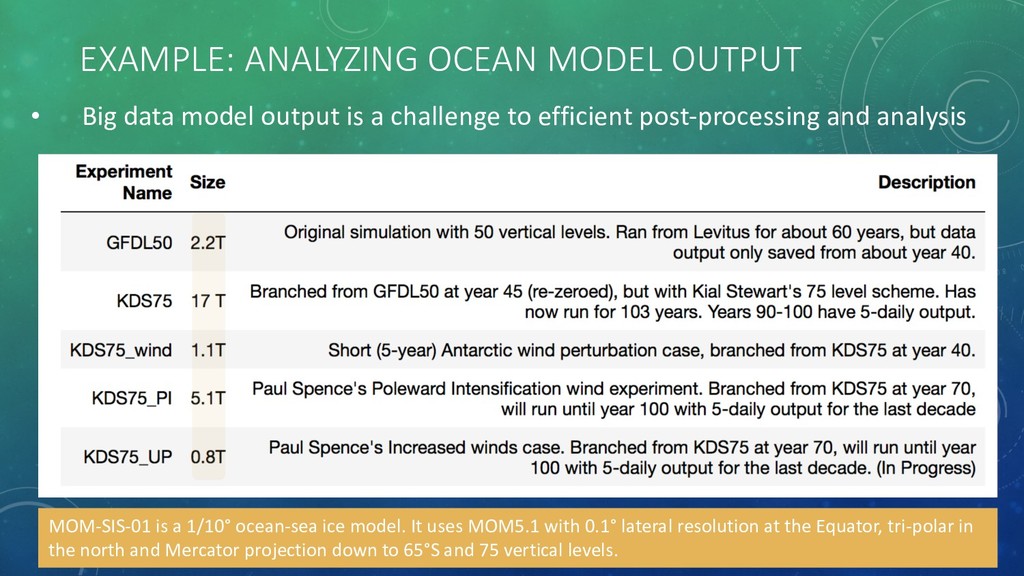
  20. EXAMPLE: ANALYZING OCEAN MODEL OUTPUT • Big data model output

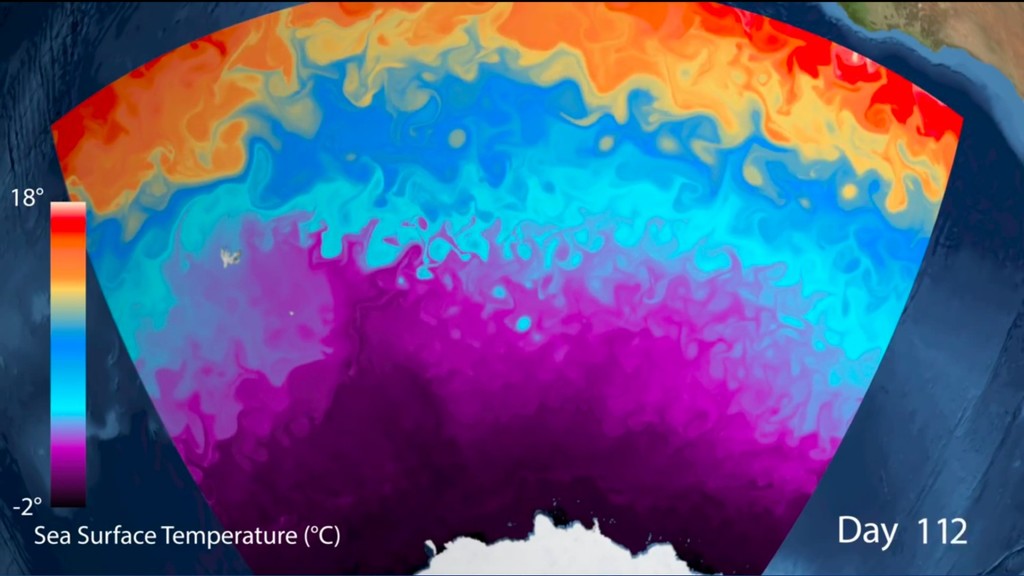
    is a challenge to efficient post-processing and analysis MOM-SIS-01 is a 1/10° ocean-sea ice model. It uses MOM5.1 with 0.1° lateral resolution at the Equator, tri-polar in the north and Mercator projection down to 65°S and 75 vertical levels.
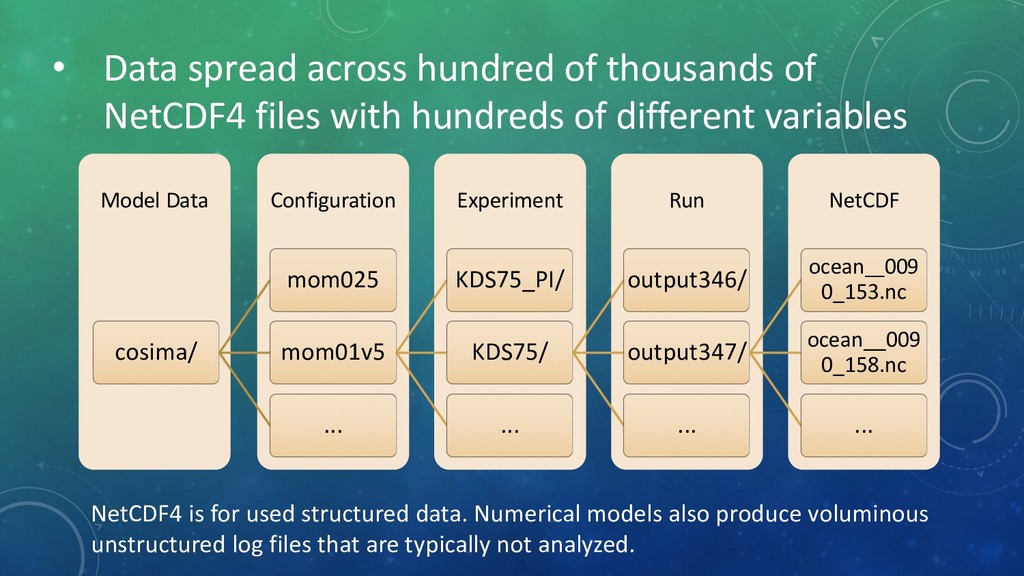
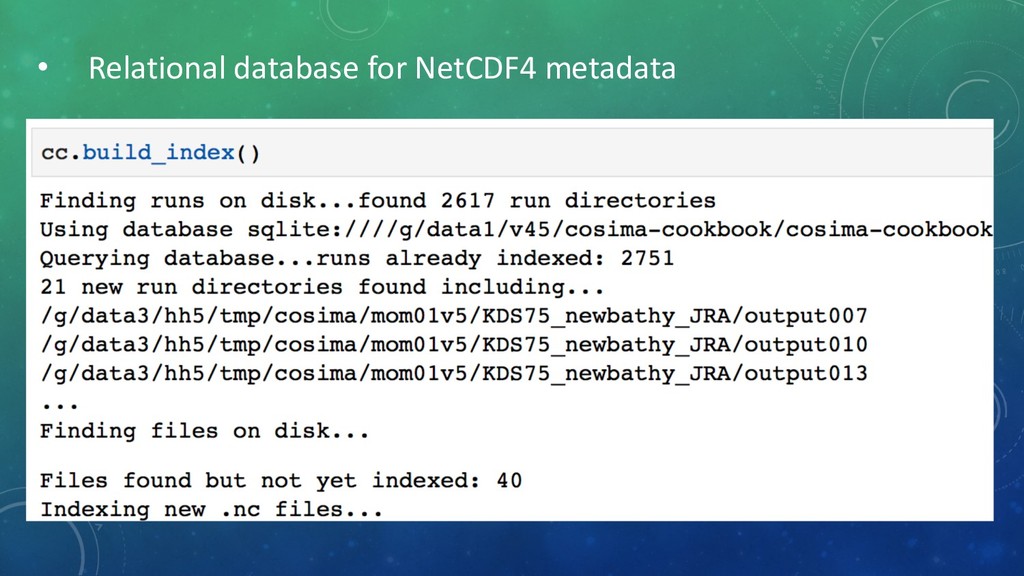
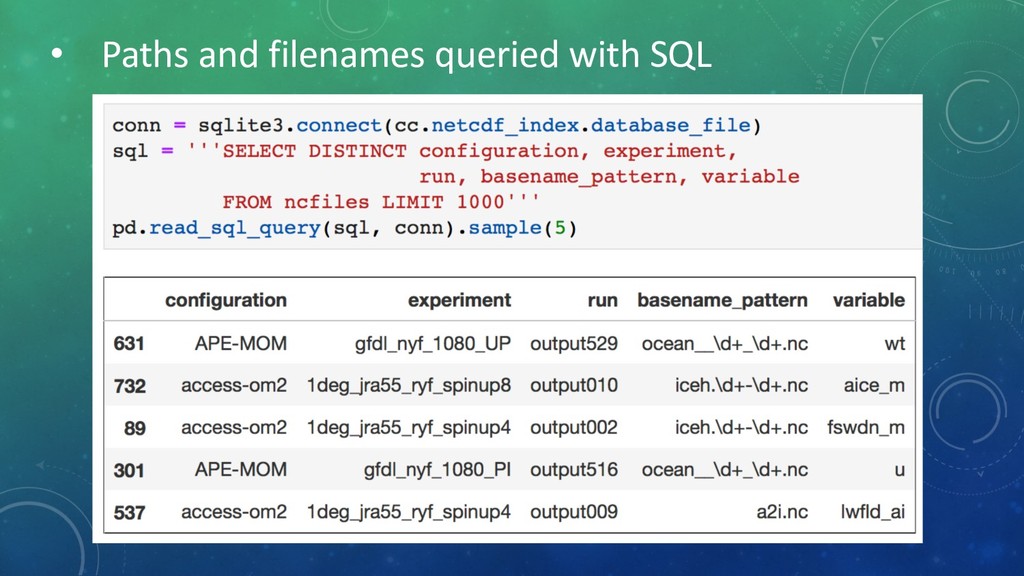
  21. • Data spread across hundred of thousands of NetCDF4 files

    with hundreds of different variables NetCDF Run Experiment Configuration Model Data cosima/ mom025 mom01v5 KDS75_PI/ KDS75/ output346/ output347/ ocean__009 0_153.nc ocean__009 0_158.nc ... ... ... ... NetCDF4 is for used structured data. Numerical models also produce voluminous unstructured log files that are typically not analyzed.
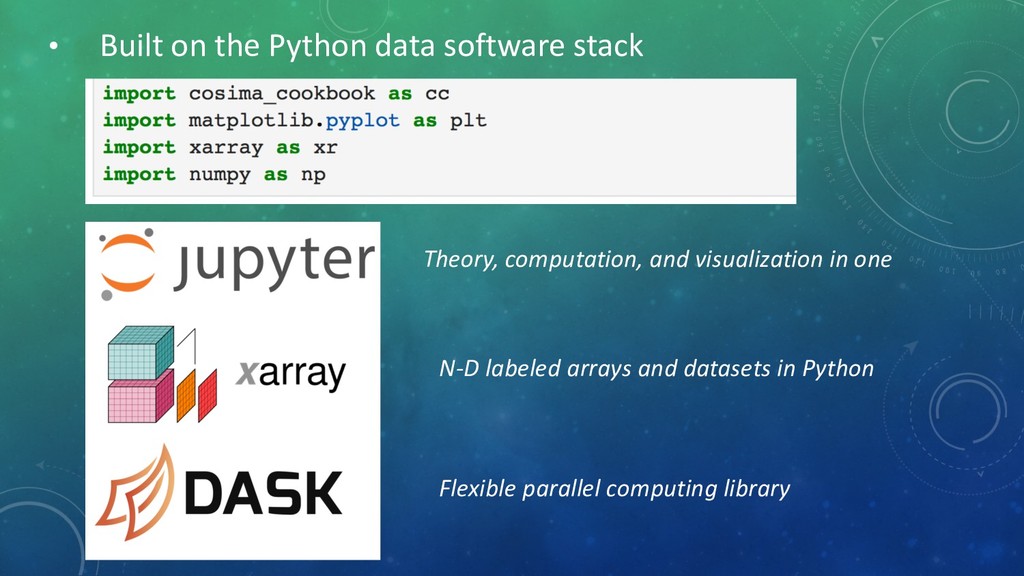
  22. Theory, computation, and visualization in one N-D labeled arrays and

    datasets in Python Flexible parallel computing library • Built on the Python data software stack
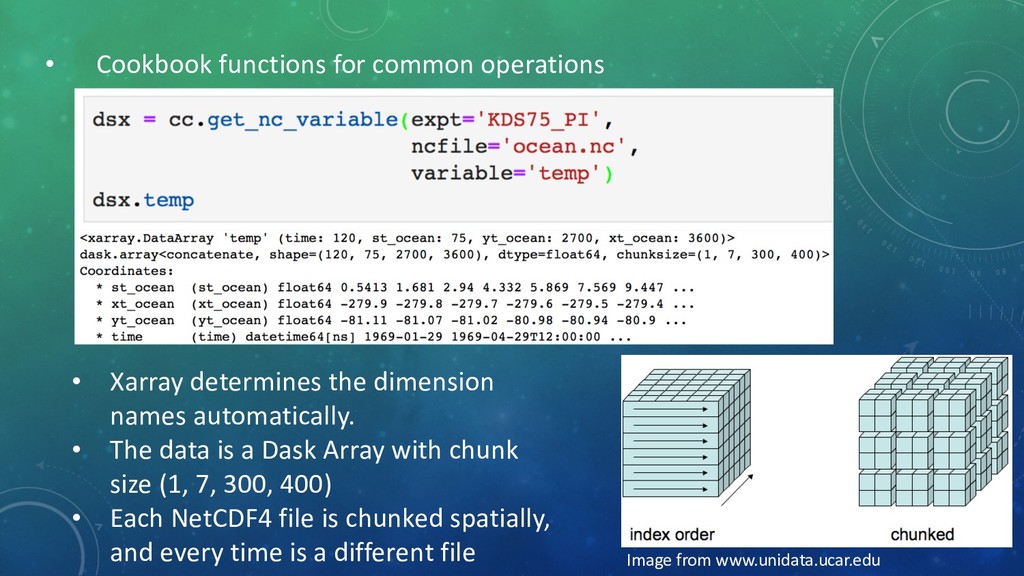
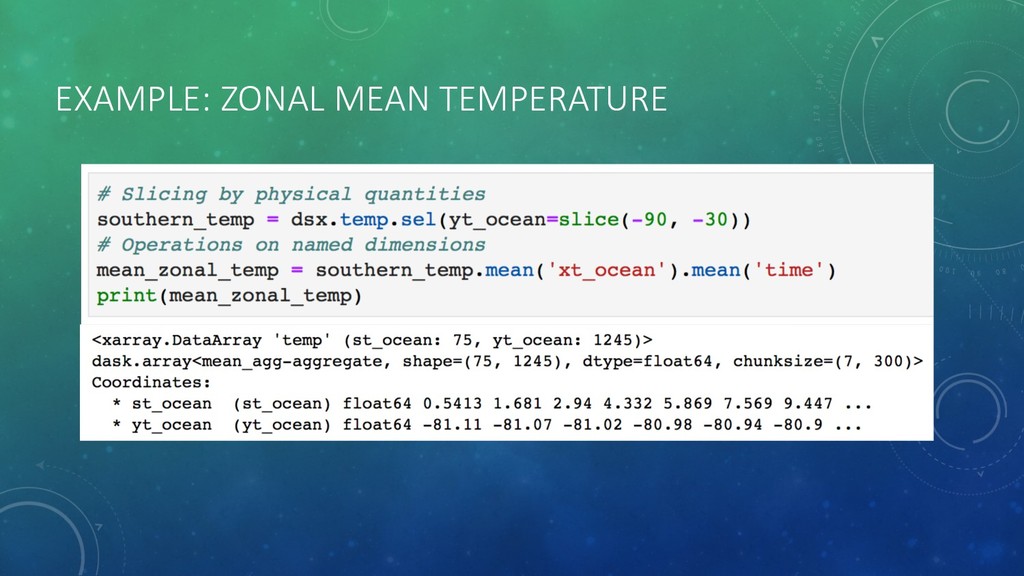
  23. • Xarray determines the dimension names automatically. • The data

    is a Dask Array with chunk size (1, 7, 300, 400) • Each NetCDF4 file is chunked spatially, and every time is a different file • Cookbook functions for common operations Image from www.unidata.ucar.edu
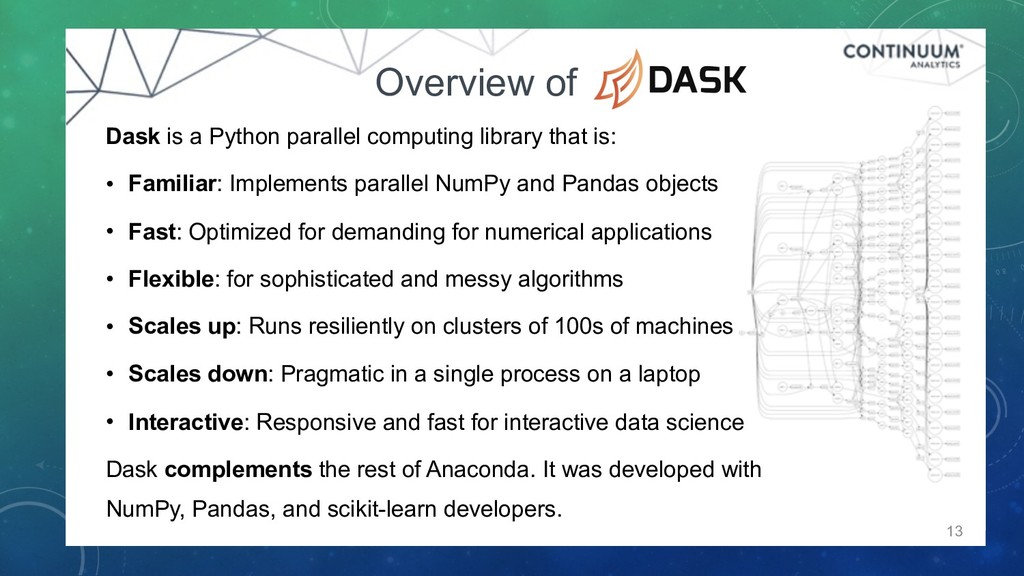
  24. Overview of Dask 13 Dask is a Python parallel computing

    library that is: • Familiar: Implements parallel NumPy and Pandas objects • Fast: Optimized for demanding for numerical applications • Flexible: for sophisticated and messy algorithms • Scales up: Runs resiliently on clusters of 100s of machines • Scales down: Pragmatic in a single process on a laptop • Interactive: Responsive and fast for interactive data science Dask complements the rest of Anaconda. It was developed with
 NumPy, Pandas, and scikit-learn developers.
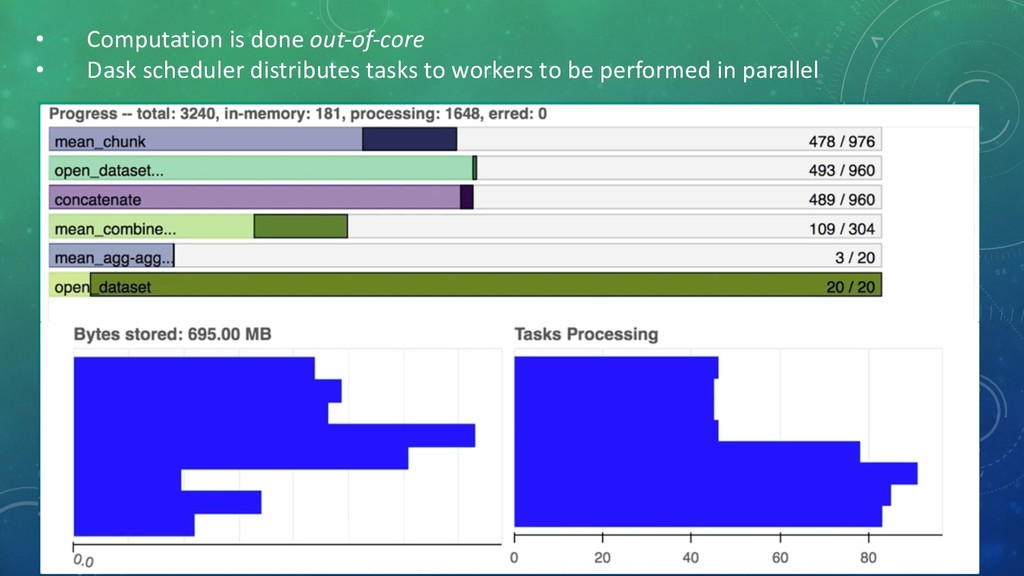
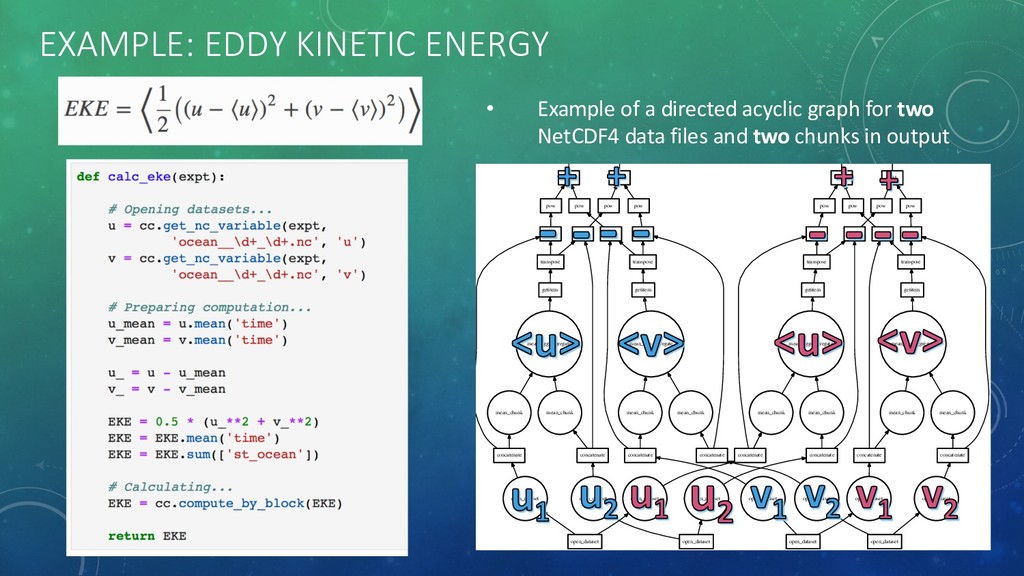
  25. EXAMPLE: EDDY KINETIC ENERGY nansum mean_agg-aggregate nansum mean_agg-aggregate mean_chunk mul

    mean_chunk mul mean_chunk mul mean_chunk mul add add add add pow pow pow pow pow pow pow pow sub sub sub sub concatenate mean_chunk transpose concatenate mean_chunk transpose concatenate mean_chunk concatenate mean_chunk open_dataset open_dataset open_dataset open_dataset open_dataset open_dataset getitem getitem mean_agg-aggregate mean_agg-aggregate sub sub sub sub transpose concatenate mean_chunk transpose concatenate mean_chunk concatenate mean_chunk concatenate mean_chunk open_dataset open_dataset open_dataset open_dataset open_dataset open_dataset getitem getitem mean_agg-aggregate mean_agg-aggregate • Example of a directed acyclic graph for two NetCDF4 data files and two chunks in output
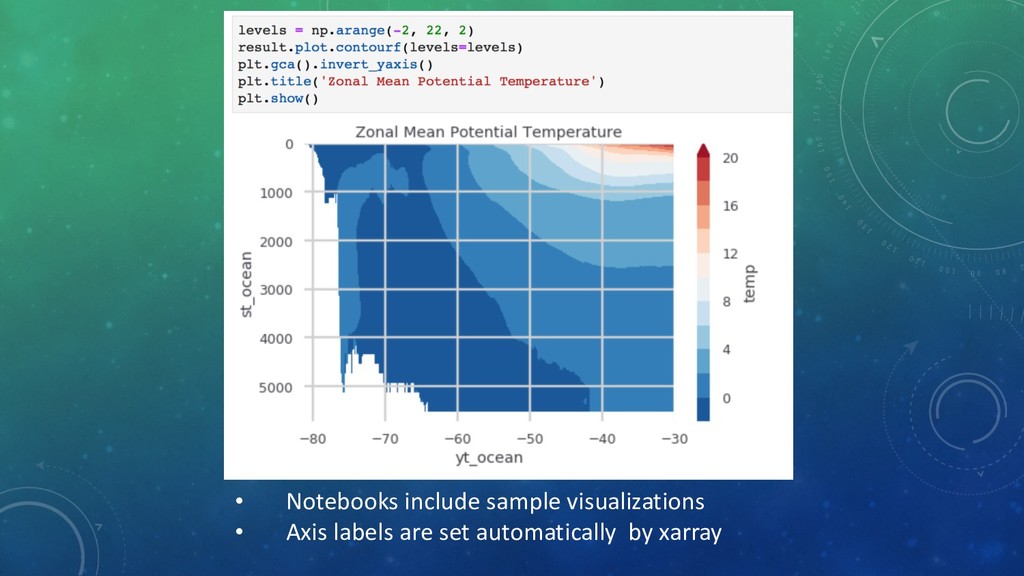
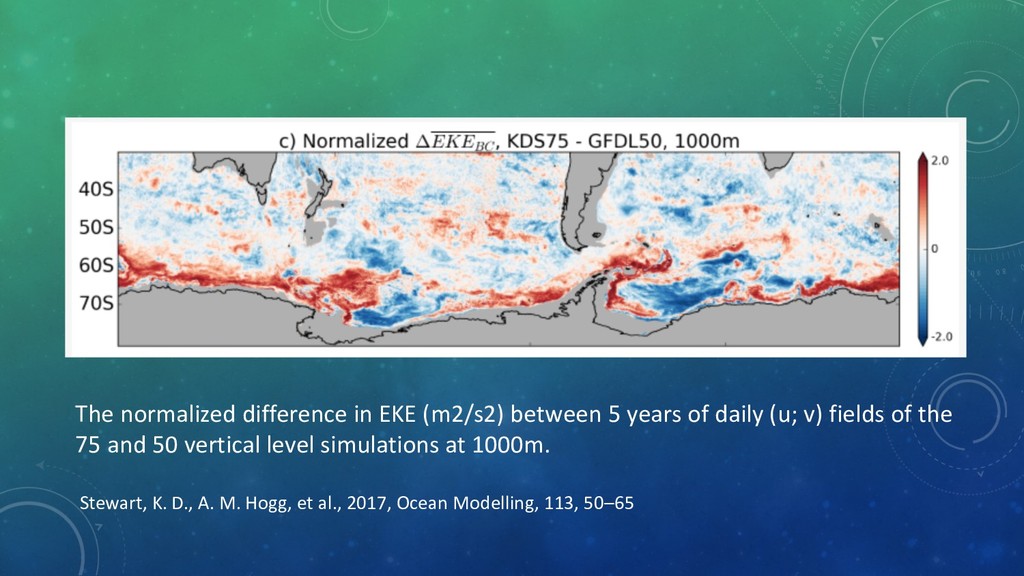
  26. The normalized difference in EKE (m2/s2) between 5 years of

    daily (u; v) fields of the 75 and 50 vertical level simulations at 1000m. Stewart, K. D., A. M. Hogg, et al., 2017, Ocean Modelling, 113, 50–65
  27. SUMMARY • Climate science and oceanography are big data /

    data science disciplines. • New tools, technologies, platforms from data science will need to be adopted to deal with data at scale. • COSIMA Cookbook: A gallery of ocean model diagnostics