Upgrade to Pro — share decks privately, control downloads, hide ads and more …

Monitoring Go Applications with OpenTelemetry

Johannes Liebermann
January 22, 2020
480

Monitoring Go Applications with OpenTelemetry

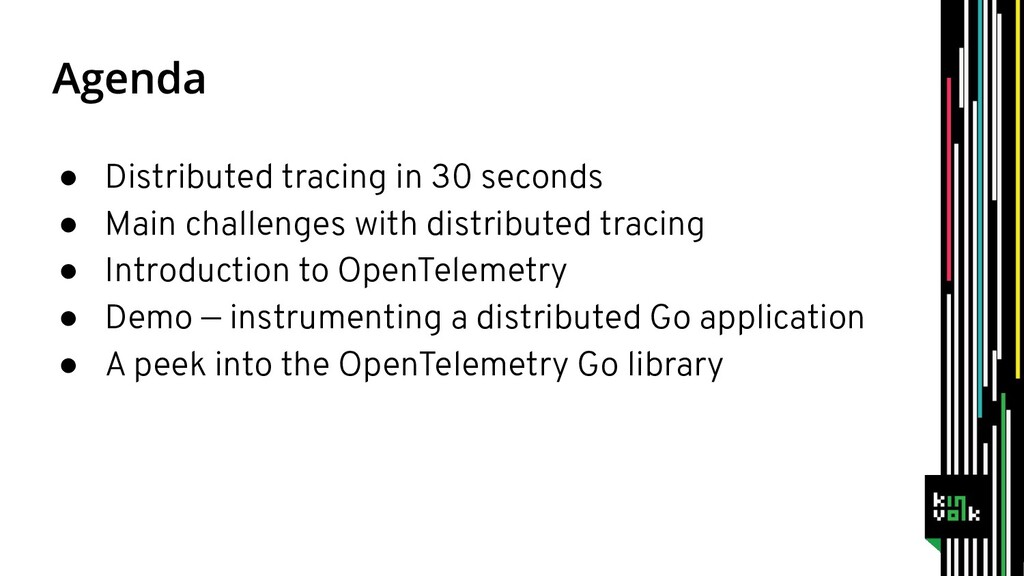
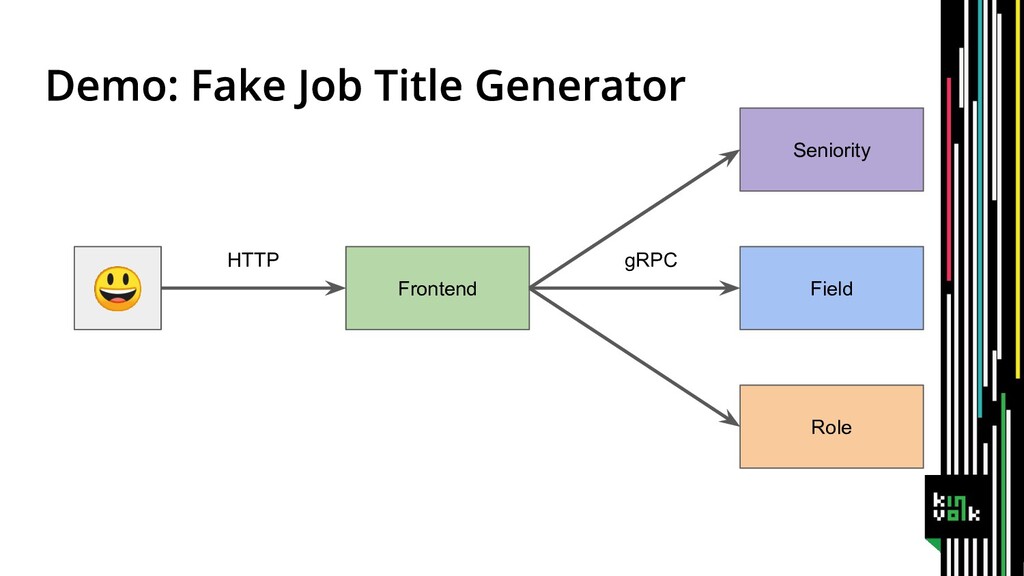
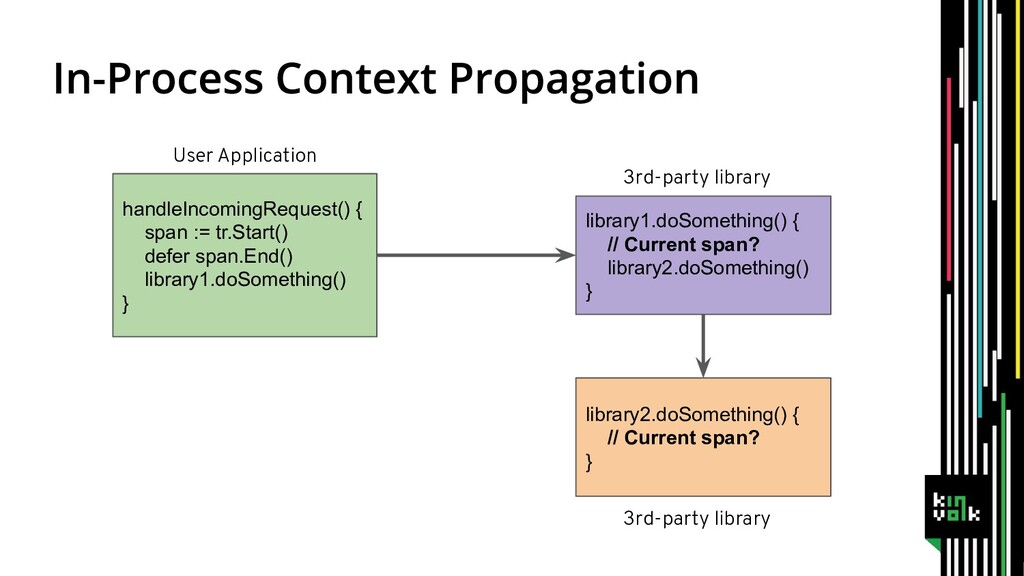
OpenTelemetry is a CNCF sandbox project for standardizing application tracing and monitoring across multiple programming languages, platforms and monitoring vendors. This talk provides a brief introduction to OpenTelemetry, explores the OpenTelemetry Go library and demonstrates how it can be used to make Go applications observable.

Johannes Liebermann

January 22, 2020
Tweet

Transcript

  1. The Kubernetes Linux Experts Engineering services and products for Kubernetes,

    containers, process management and Linux user-space + kernel Blog: kinvolk.io/blog Github: kinvolk Twitter: kinvolkio Email: [email protected]
  2. • Distributed tracing in 30 seconds • Main challenges with

    distributed tracing • Introduction to OpenTelemetry • Demo — instrumenting a distributed Go application • A peek into the OpenTelemetry Go library
  3. helloHandler := func(w http.ResponseWriter, req *http.Request) { ... ctx, span

    := tr.Start( req.Context(), "handle-hello-request", ... ) defer span.End() _, _ = io.WriteString(w, "Hello, world!\n") }
  4. • A span measures a unit of work in a

    service • A trace combines multiple spans together handle-http-request query-database render-response 5ms 3ms 2ms trace span
  5. • Instrumentation == code changes • Hard to justify reducing

    team velocity for tracing • You can’t have “instrumentation holes” ◦ At the very least you must propagate context
  6. • Vendor-locking for tracing is especially problematic • Importing a

    vendor-specific library is scary ◦ What if my monitoring vendor raises prices? • Open-source libraries must remain neutral ◦ You can’t require users to use a specific vendor ◦ Maintaining support for multiple vendors is a lot of work
  7. • Multiple microservices • Multiple programming languages and frameworks •

    Multiple protocols (HTTP, gRPC, messaging, ...) • Multiple tracing backends (Jaeger, Zipkin, Datadog, LightStep, NewRelic, Dynatrace, …)
  8. • A CNCF project which standardizes tracing APIs • API

    only — no implementation! • Released in December 2016 • Notable contributors: ◦ LightStep, Uber, Instana, SolarWinds, NewRelic, Datadog, Red Hat, ... • Supported by: ◦ LightStep, Datadog, Instana, Dynatrace, Jaeger, ...
  9. • A Google project which has been open-sourced • API

    and implementation • Released in January 2018 • Notable contributors: ◦ Google, Microsoft, Splunk, Honeycomb, SignalFx, ... • Supported by: ◦ Stackdriver, Datadog, Honeycomb, AWS X-Ray, Zipkin, ... OpenCensus
  10. • Announced May 2019 • The next major version of

    both OpenTracing and OpenCensus • A real community effort • A spec and a set of libraries • API and implementation • Tracing and metrics
  11. • API ◦ Follows the OpenTelemetry specification ◦ Can be

    used without an implementation • SDK ◦ A ready-to-use implementation ◦ Alternative implementations are supported • Exporters • Bridges https://github.com/open-telemetry/opentelemetry-specification/blob/master/specification/library-guidelines.md
  12. • Library developers depend only on the API • Application

    developers depend on the API and on an implementation • Monitoring vendors maintain their own exporters
  13. • I may want to use an instrumented 3rd-party library

    without using OpenTelemetry ◦ If no implementation is plugged in, telemetry data is not produced • My code should not be broken by instrumentation ◦ The API package is self-sufficient thanks to a built-in noop implementation • Performance impact should be minimal ◦ No blocking of end-user application by default ◦ Noop implementation produces negligible overhead ◦ Asynchronous exporting of telemetry data
  14. • Current status: pre-release • Production readiness: 2nd half of

    2020 • Libraries for: Go, Python, Java, C++, Rust, PHP, Ruby, .NET, JavaScript, Erlang
  15. Latest release: v0.2.1 (alpha) ✓ API (tracing + metrics) ✓

    SDK (tracing + metrics) ✓ Context propagation ✓ Exporters: Jaeger, Stackdriver, Prometheus (metrics) ✓ OpenTracing bridge
  16. // Explicit span creation. handler := func(w http.ResponseWriter, r *http.Request)

    { ctx, span := tr.Start(r.Context(), "handle-request") defer span.End() // Handle HTTP request. } // Implicit span creation. err := tr.WithSpan(ctx, "do-stuff", func(context.Context) error { return do_stuff() } )
  17. // Log an event on the span. span.AddEvent(ctx, "Generating response",

    key.New("response").String("stuff") ) // Set key-value pairs on the span. span.SetAttributes( key.New("cool").Bool(true), key.New("usefulness").String("very"), )
  18. • “Context” refers to request-scoped data ◦ Example: request/transaction ID

    • Context is propagated across a request’s path • Distributed tracing relies on context for span correlation ◦ Trace ID and span ID must be propagated • Two types of context propagation: in-process and distributed
  19. • Distributed context propagation is protocol-dependent! // Inject tracing metadata

    on outgoing requests. grpctrace.Inject(ctx, &metadata) // Extract tracing metadata on incoming requests. metadata, spanCtx := grpctrace.Extract(ctx, &metadataCopy)
  20. handleIncomingRequest() { span := tr.Start() defer span.End() library1.doSomething() } library1.doSomething()

    { // Current span? library2.doSomething() } library2.doSomething() { // Current span? } User Application 3rd-party library 3rd-party library
  21. • Used among functions or goroutines within a service •

    Must be thread-safe • Two main approaches: ◦ Implicit — thread-local storage, global variables, … ◦ Explicit — as an argument in function calls
  22. • https://golang.org/pkg/context/ • Commonly employed for cascading request cancellation •

    Can be used for propagating request-scoped data • Thread-safe • You may already be using context anyway
  23. // Set current span. func ContextWithSpan(ctx context.Context, span Span) context.Context

    { return context.WithValue(ctx, currentSpanKey, span) } // Get current span. func SpanFromContext(ctx context.Context) Span { if span, has := ctx.Value(currentSpanKey).(Span); has { return span } return NoopSpan{} } api/trace/current.go
  24. • It’s a lot of work ◦ Hopefully you’ll never

    have to re-instrument your entire codebase ◦ Auto-instrumentation is in the works • We can’t vendor-lock ◦ Architecture encourages separation of concerns • Distributed tracing vs. microservices ◦ A good balance between freedom and uniformity