Upgrade to Pro — share decks privately, control downloads, hide ads and more …

Observable Applications With OpenTelemetry

Johannes Liebermann
April 01, 2020
310

Observable Applications With OpenTelemetry

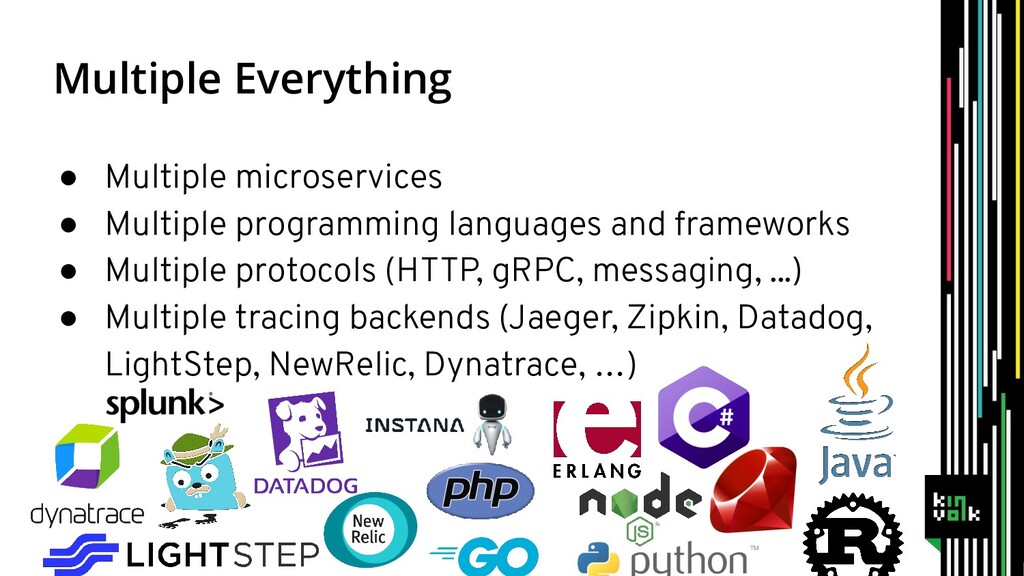
OpenTelemetry is a CNCF sandbox project which standardizes application tracing and monitoring across multiple programming languages, protocols, platforms and vendors. In this talk I provide a brief introduction to the OpenTelemetry project, explore some of its language libraries, demonstrate how they can be used to make distributed applications observable and look into some of the tricky parts in implementing distributed tracing as well as how they are handled by OpenTelemetry.

Johannes Liebermann

April 01, 2020
Tweet

Transcript

  1. The Kubernetes Linux Experts Engineering services and products for Kubernetes,

    containers, process management and Linux user-space + kernel Blog: kinvolk.io/blog Github: kinvolk Twitter: kinvolkio Email: [email protected] Kinvolk
  2. Agenda • Logs, metrics and traces • Distributed tracing: why

    it’s great but also hard • Introduction to OpenTelemetry • A look into the tracing libraries (Go, Python) • Demo — instrumenting a distributed application • Context propagation
  3. Distributed Tracing in 30 Seconds helloHandler := func(w http.ResponseWriter, req

    *http.Request) { ... ctx, span := tr.Start( req.Context(), "handle-hello-request", ... ) defer span.End() _, _ = io.WriteString(w, "Hello, world!\n") }
  4. Distributed Tracing in 30 Seconds • A span measures a

    unit of work in a service • A trace combines multiple spans together handle-http-request query-database render-response 5ms 3ms 2ms trace span
  5. Logs, Metrics, Traces Generating Processing & Storing Querying Scope Logs

    Easy Hard Hard Node Metrics So-so Easy Easy Node / Service Traces Hard So-so Easy Request
  6. Logs, Metrics, Traces Generating Processing & Storing Querying Scope Logs

    Easy Hard Hard Node Metrics So-so Easy Easy Node / Service Traces Hard So-so Easy Request
  7. What Is the Question? • Why did this node crash?

    • Was function X on the node called? • Is my service healthy? • How much traffic do we have? • Why was this request slow? • Where should I optimize performance? • Which services are involved?
  8. What Is the Question? • Why did this node crash?

    • Was function X on the node called? • Is my service healthy? • How much traffic do we have? • Why was this request slow? • Where should I optimize performance? • Which services are involved? Logs Metrics Traces
  9. What Is the Question? • Why did this node crash?

    • Was function X on the node called? • Is my service healthy? • How much traffic do we have? • Why was this request slow? • Where should I optimize performance? • Which services are involved?
  10. Logs, Metrics, Traces Generating Processing & Storing Querying Scope Logs

    Easy Hard Hard Service Metrics So-so Easy Easy Service / system Traces Hard So-so Easy Request
  11. 1. It’s a Lot of Work • Instrumentation == code

    changes • Hard to justify reducing team velocity for tracing • You can’t have “instrumentation holes” ◦ At the very least you must propagate context
  12. 2. We Can’t Vendor-Lock • Vendor-locking for tracing is especially

    problematic • Importing a vendor-specific library is scary ◦ What if my monitoring vendor raises prices? • Open-source libraries must remain neutral ◦ You can’t require users to use a specific vendor ◦ Maintaining support for multiple vendors is a lot of work
  13. • Multiple microservices • Multiple programming languages and frameworks •

    Multiple protocols (HTTP, gRPC, messaging, ...) • Multiple tracing backends (Jaeger, Zipkin, Datadog, LightStep, NewRelic, Dynatrace, …) Multiple Everything
  14. Introducing OpenTelemetry • opentelemetry.io • Announced May 2019 • The

    next major version of both OpenTracing and OpenCensus • A real community effort • A spec and a set of libraries • API and implementation • Tracing and metrics
  15. OpenTelemetry — Architecture • API ◦ Follows the OpenTelemetry specification

    ◦ Can be used without an implementation • SDK ◦ A ready-to-use implementation ◦ Alternative implementations are supported • Exporters • Bridges https://github.com/open-telemetry/opentelemetry-specification/blob/master/specification/library-guidelines.md
  16. Separation of Concerns • Library developers depend only on the

    API • Application developers depend on the API and on an implementation • Monitoring vendors maintain their own exporters
  17. Protecting User Applications • I may want to use an

    instrumented 3rd-party library without using OpenTelemetry ◦ If no implementation is plugged in, telemetry data is not produced • My code should not be broken by instrumentation ◦ The API package is self-sufficient thanks to a built-in noop implementation • Performance impact should be minimal ◦ No blocking of end-user application by default ◦ Noop implementation produces negligible overhead ◦ Asynchronous exporting of telemetry data
  18. • Current status: beta • Production readiness: 2nd half of

    2020 • Libraries for: Go, Python, Java, C++, Rust, PHP, Ruby, .NET, JavaScript, Erlang Project Status
  19. Go Library Status Latest release: v0.4.2 (beta) ✓ API (tracing

    + metrics) ✓ SDK (tracing + metrics) ✓ Context propagation ✓ Exporters: Jaeger, Zipkin, Prometheus (metrics) ✓ OpenTracing bridge
  20. Python Library Status Latest release: v0.6.0 (beta) ✓ API (tracing

    + metrics) ✓ SDK (tracing + metrics) ✓ Context propagation ✓ Exporters: Jaeger, Zipkin, Prometheus (metrics) ✓ OpenTracing bridge
  21. Instrumenting Go Code // Explicit span creation. handler := func(w

    http.ResponseWriter, r *http.Request) { ctx, span := tr.Start(r.Context(), "handle-request") defer span.End() // Handle HTTP request. } // Implicit span creation. err := tr.WithSpan(ctx, "do-stuff", func(context.Context) error { return do_stuff() } )
  22. Instrumenting Go Code // Log an event on the span.

    span.AddEvent(ctx, "Generating response", key.New("response").String("stuff") ) // Set key-value pairs on the span. span.SetAttributes( key.New("cool").Bool(true), key.New("usefulness").String("very"), )
  23. // Inject tracing metadata on outgoing requests. grpctrace.Inject(ctx, &metadata) //

    Extract tracing metadata on incoming requests. metadata, spanCtx := grpctrace.Extract(ctx, &metadataCopy) Propagating Context Between Processes Protocol dependent!
  24. Instrumenting Python Code # Implicit span creation. with tracer.start_as_current_span("do-stuff") as

    span: do_stuff() # Log an event on the span. span.add_event(“something happened”, {‘foo’: ‘bar’}) # Set key-value pairs on the span. span.set_attribute(‘cool’: True)
  25. Context — Request-Scoped Data • “Context” refers to request-scoped data

    ◦ Example: request/transaction ID • Context is propagated across a request’s path • Needed for span correlation ◦ Trace ID and span ID must be propagated • Two types of context propagation: in-process and distributed
  26. In-Process Context Propagation handleIncomingRequest() { span := tr.Start() defer span.End()

    library1.doSomething() } library1.doSomething() { // Current span? library2.doSomething() } library2.doSomething() { // Current span? } User Application 3rd-party library 3rd-party library
  27. In-Process Context Propagation • Used among functions or goroutines within

    a service • Must be thread-safe • Two main approaches: ◦ Implicit — thread-local storage, global variables, … ◦ Explicit — as an argument in function calls • Go uses the context standard library package • Python uses context vars
  28. In-Process Context Propagation—Go // Set current span. func ContextWithSpan(ctx context.Context,

    span Span) context.Context { return context.WithValue(ctx, currentSpanKey, span) } // Get current span. func SpanFromContext(ctx context.Context) Span { if span, has := ctx.Value(currentSpanKey).(Span); has { return span } return NoopSpan{} } api/trace/context.go
  29. Conclusion • Tracing is tricky—but may well be worth it

    • It’s much easier than before ◦ Hopefully you’ll never have to re-instrument ◦ Auto-instrumentation is in the works • No vendor locking ◦ Architecture encourages separation of concerns • A good balance between freedom and uniformity ◦ Simple APIs ◦ Support for arbitrary implementations ◦ A real community effort