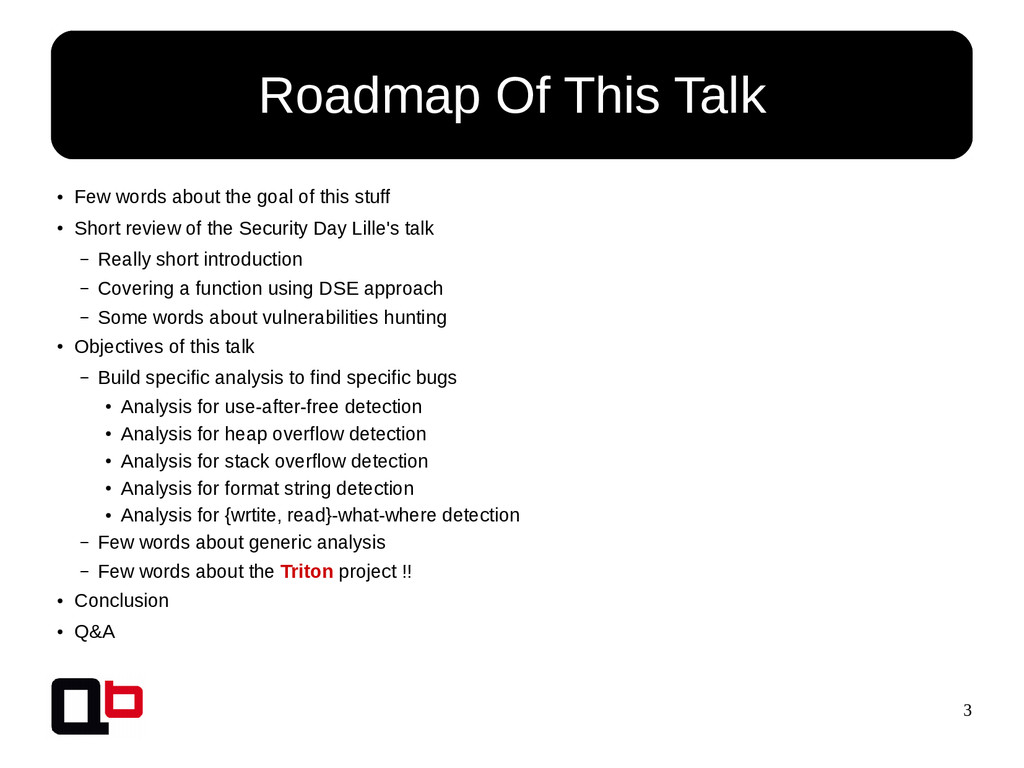
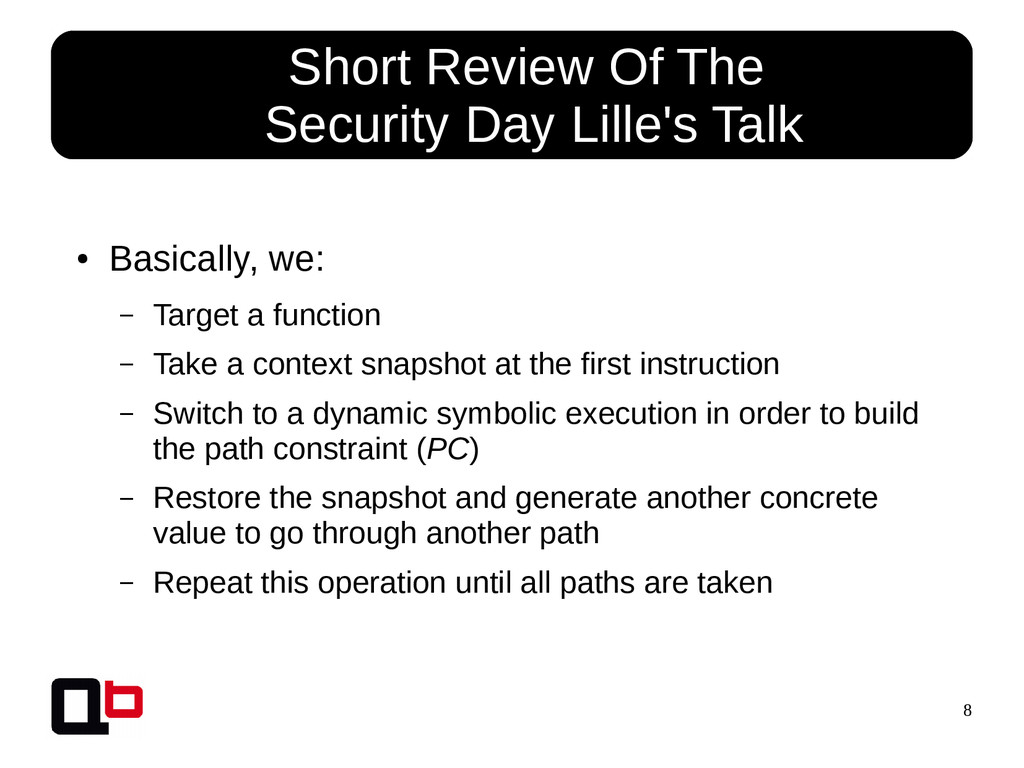
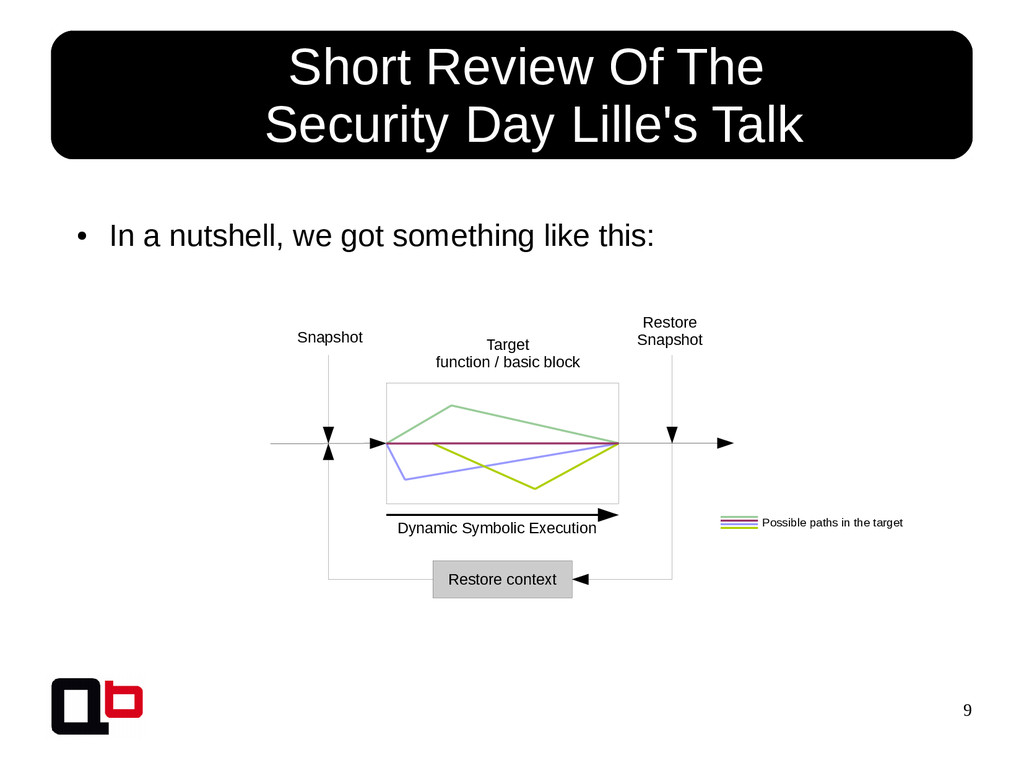
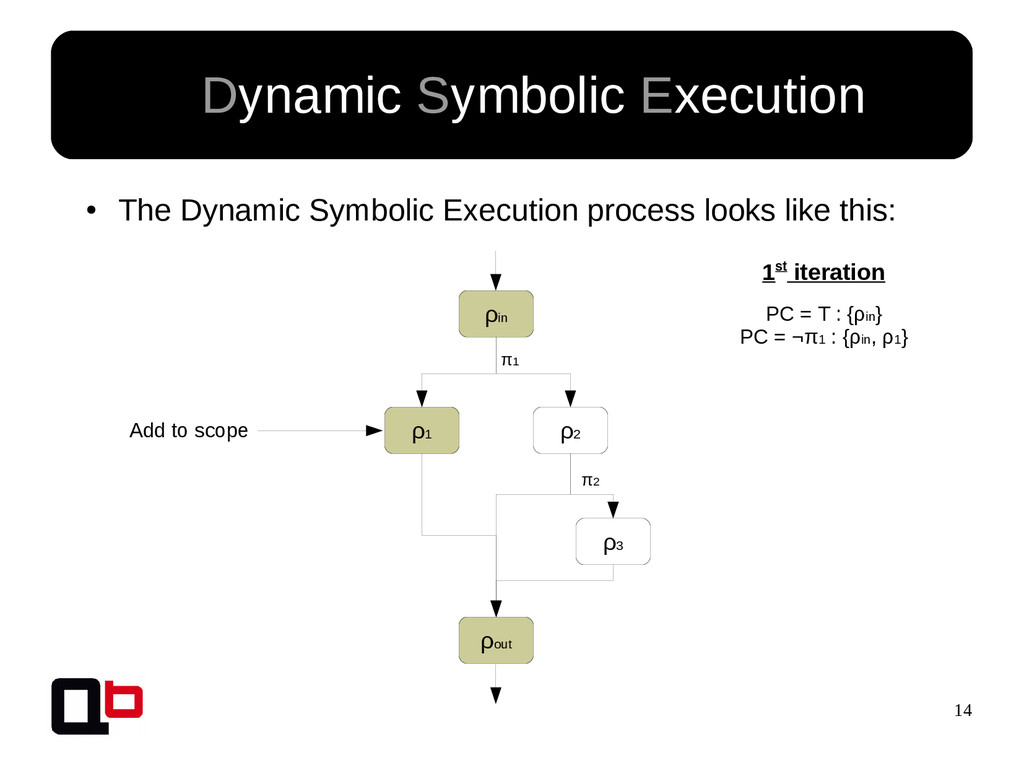
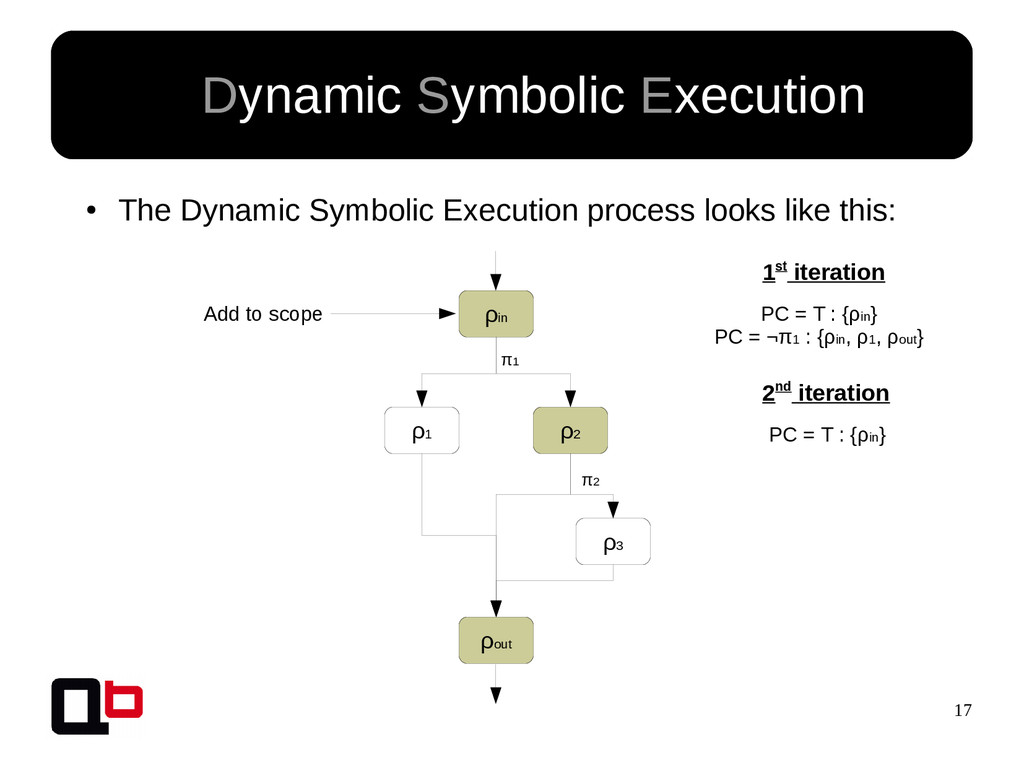
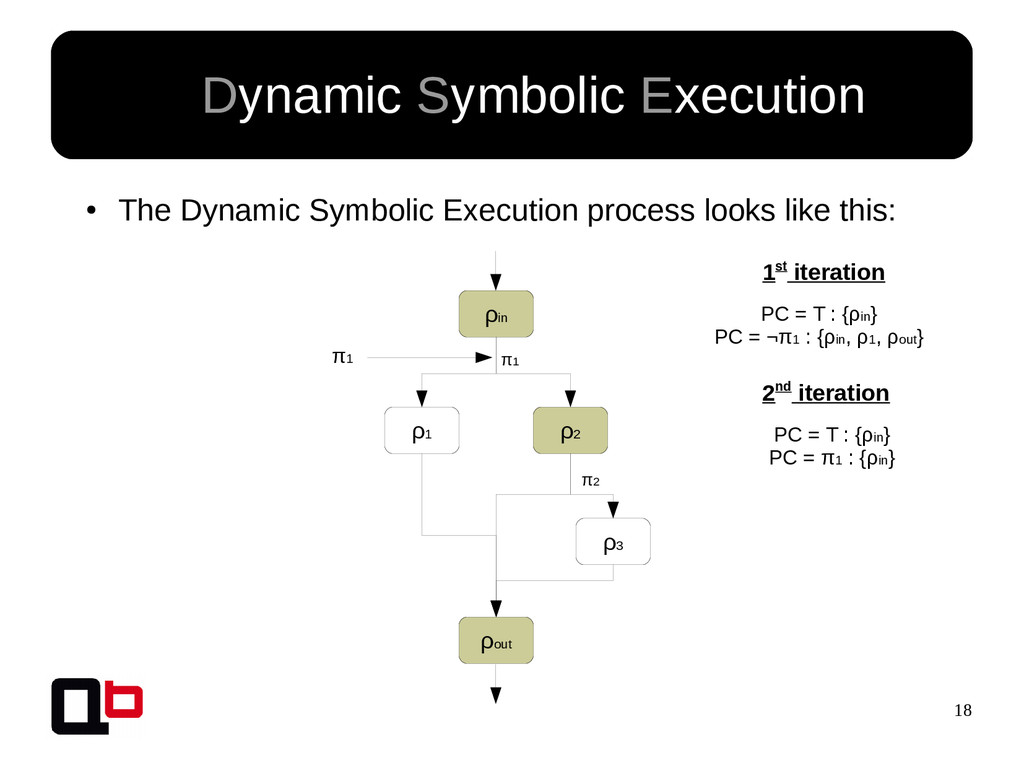
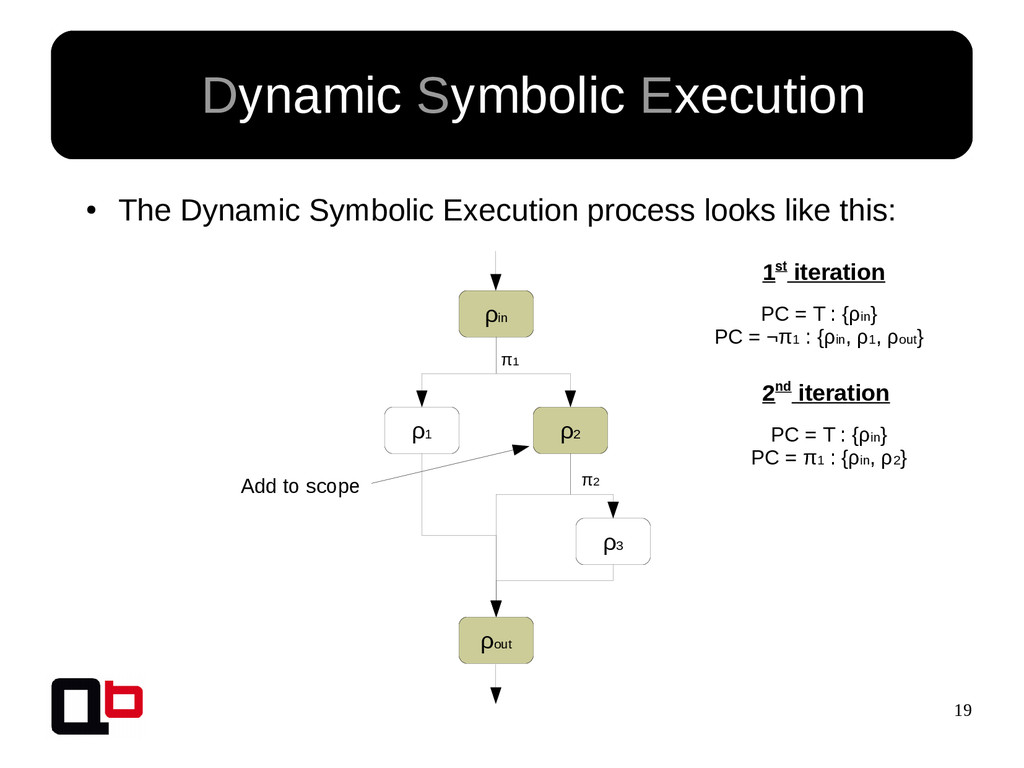
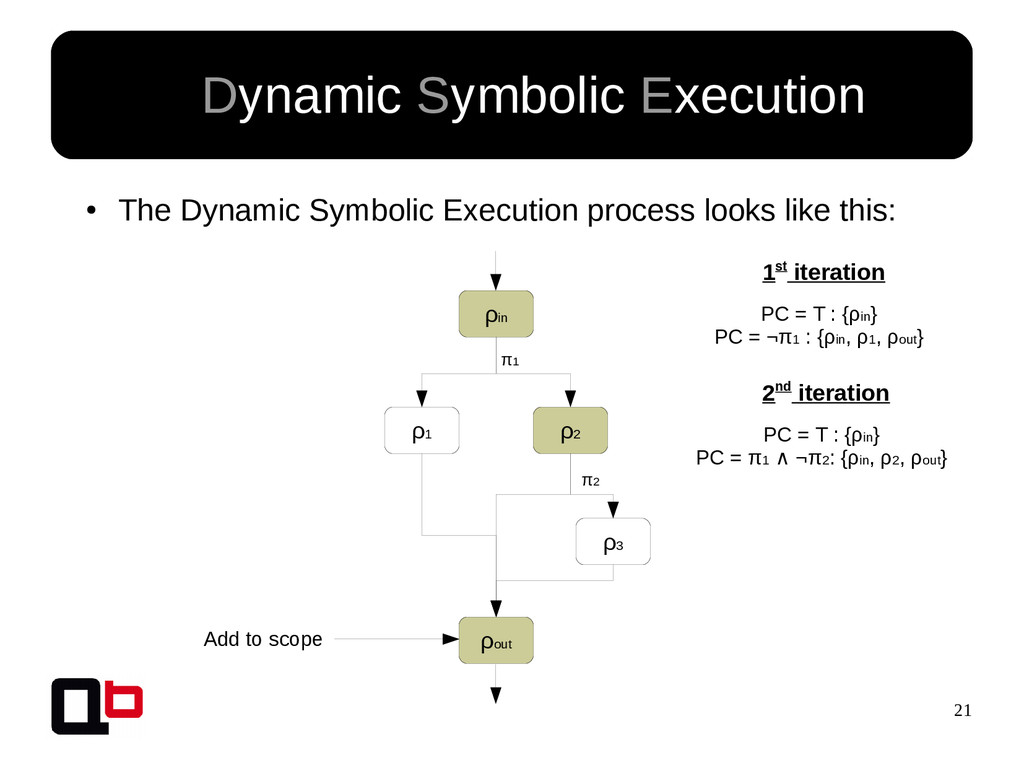
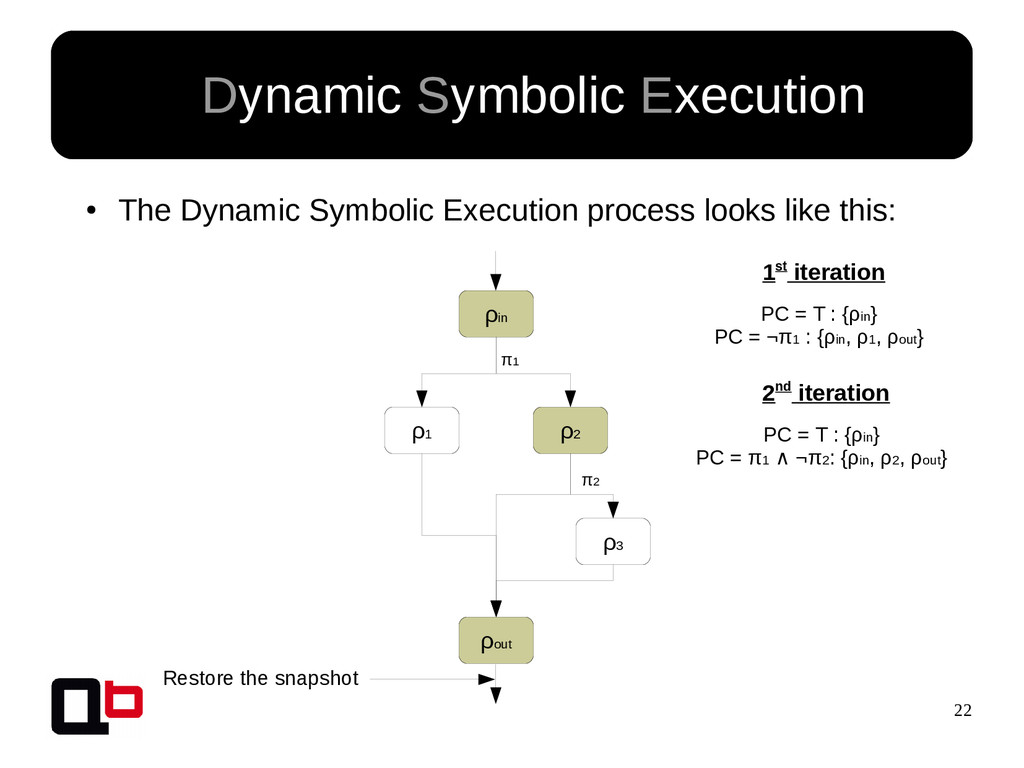
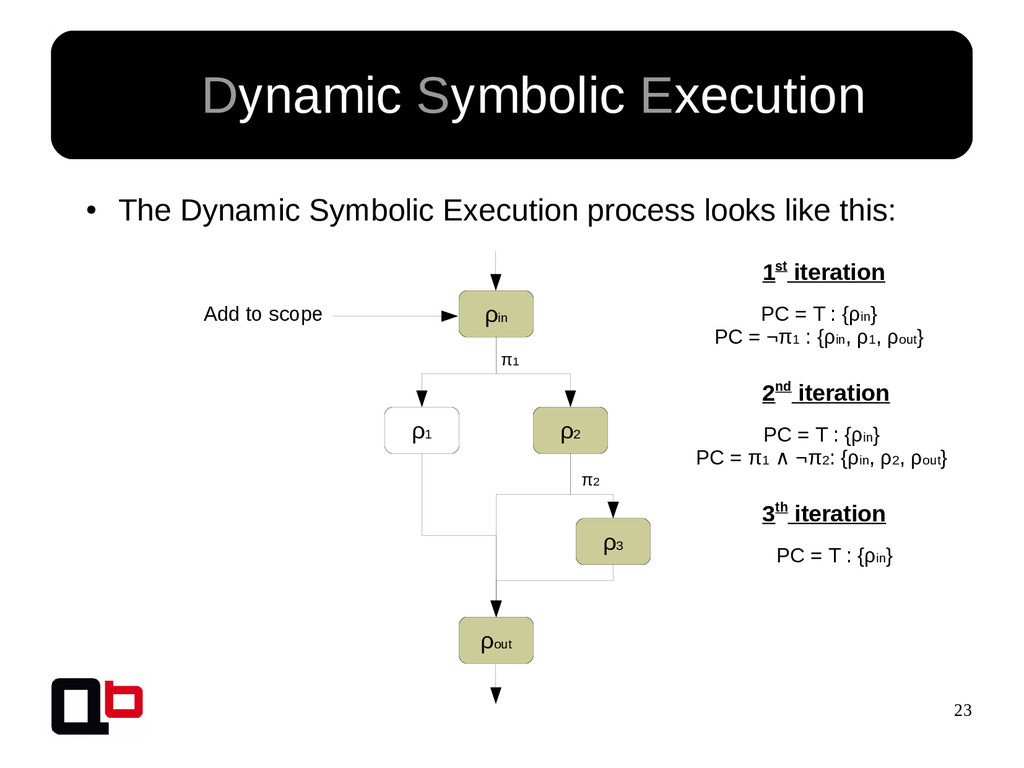
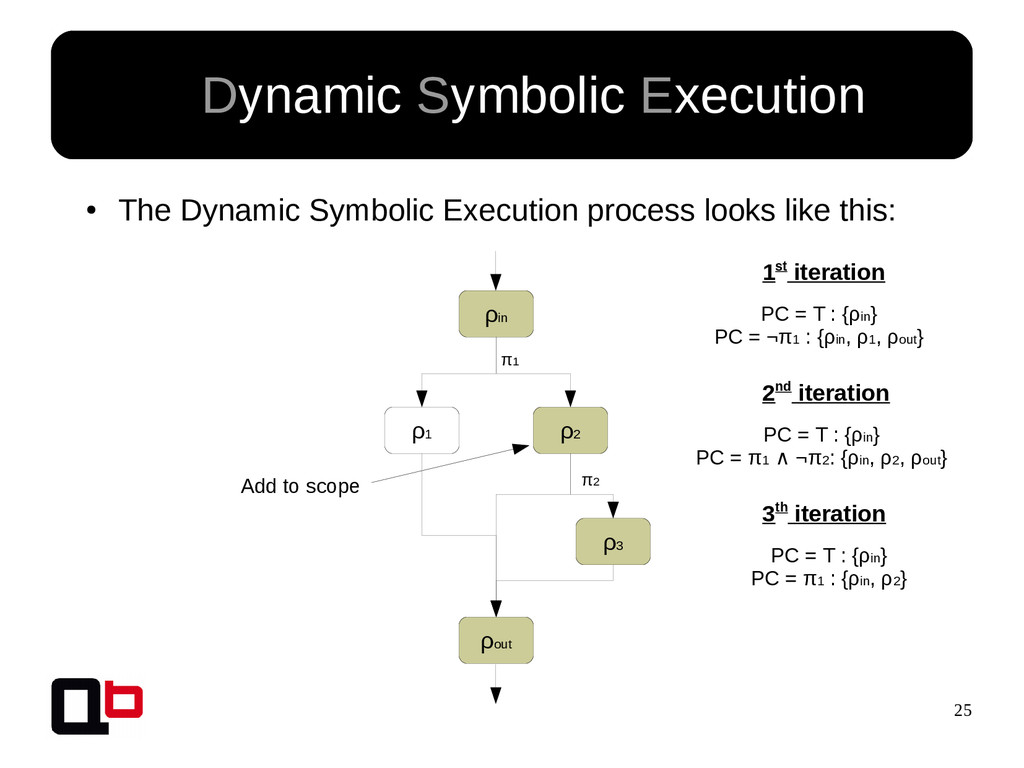
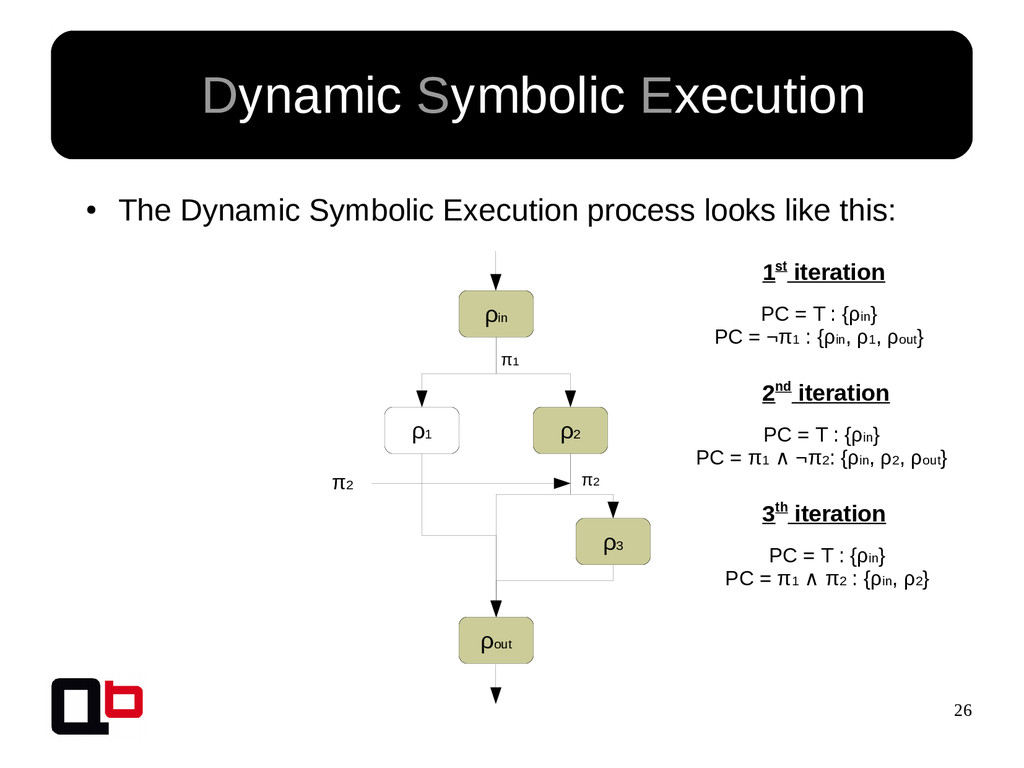
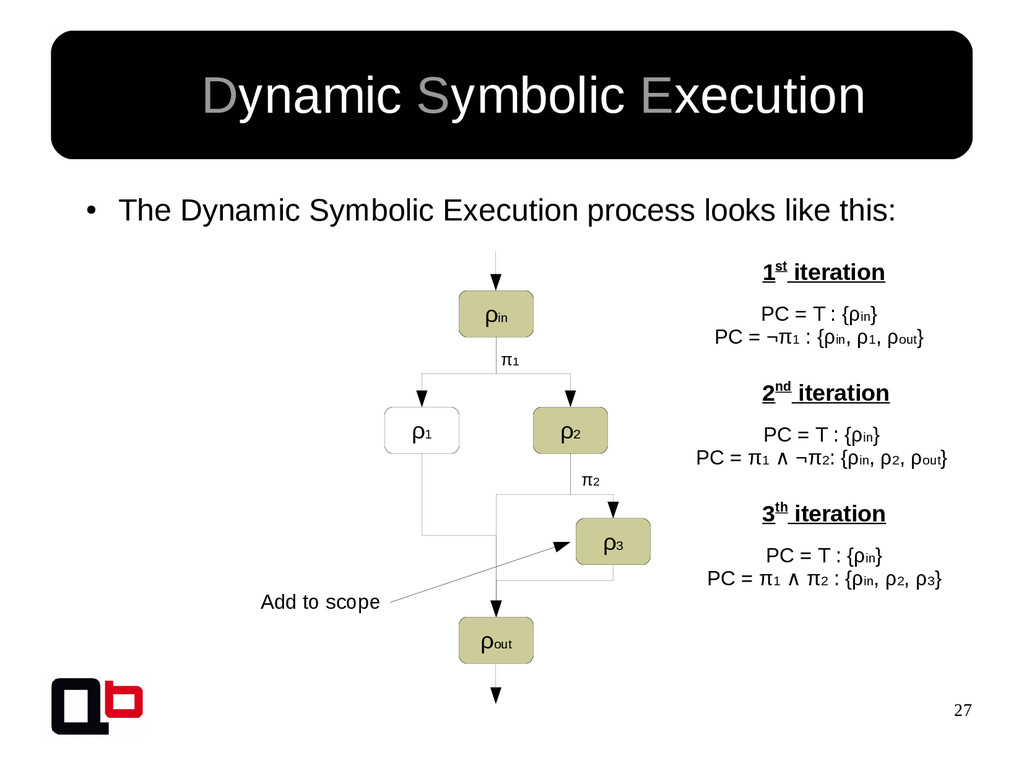
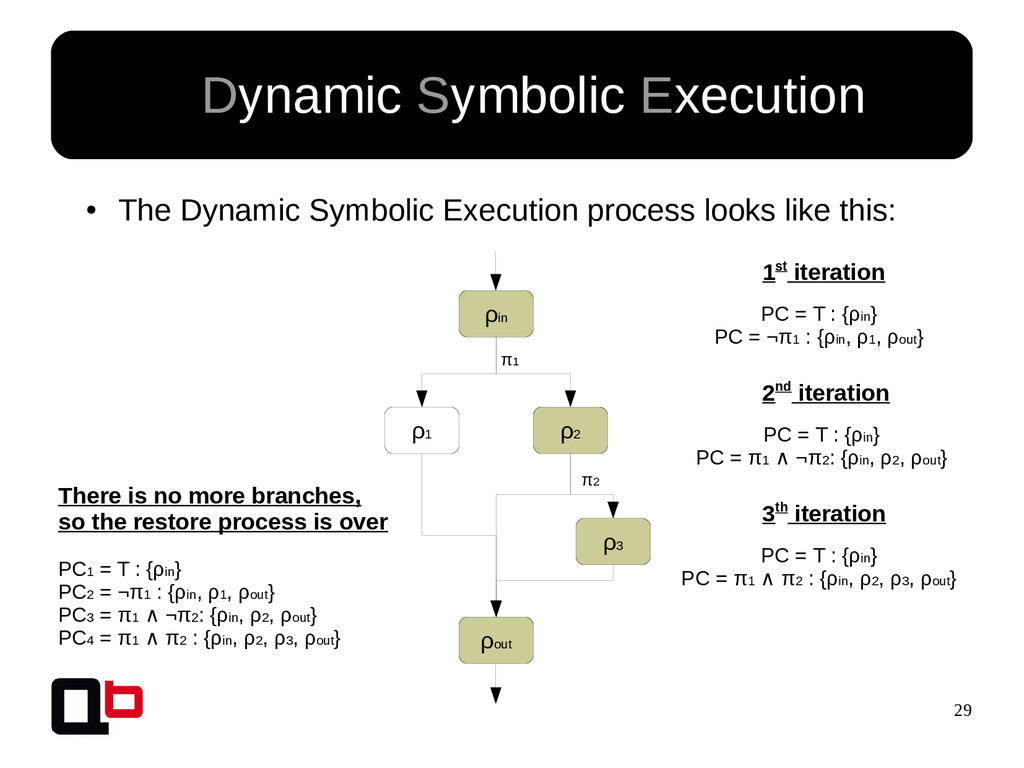
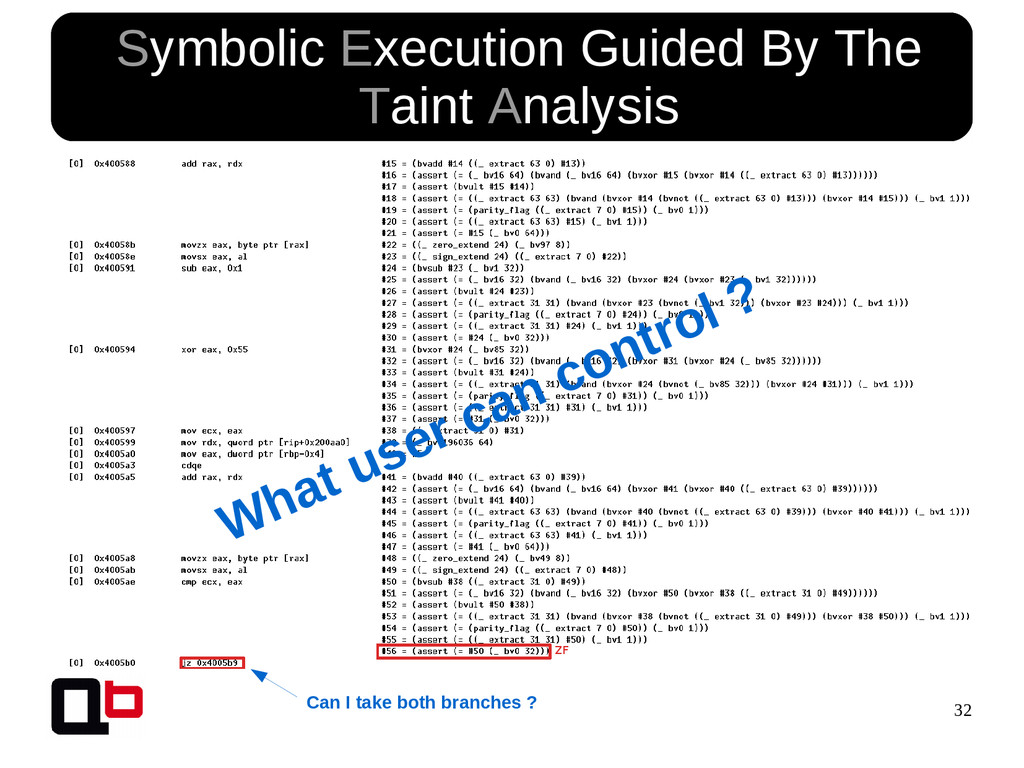
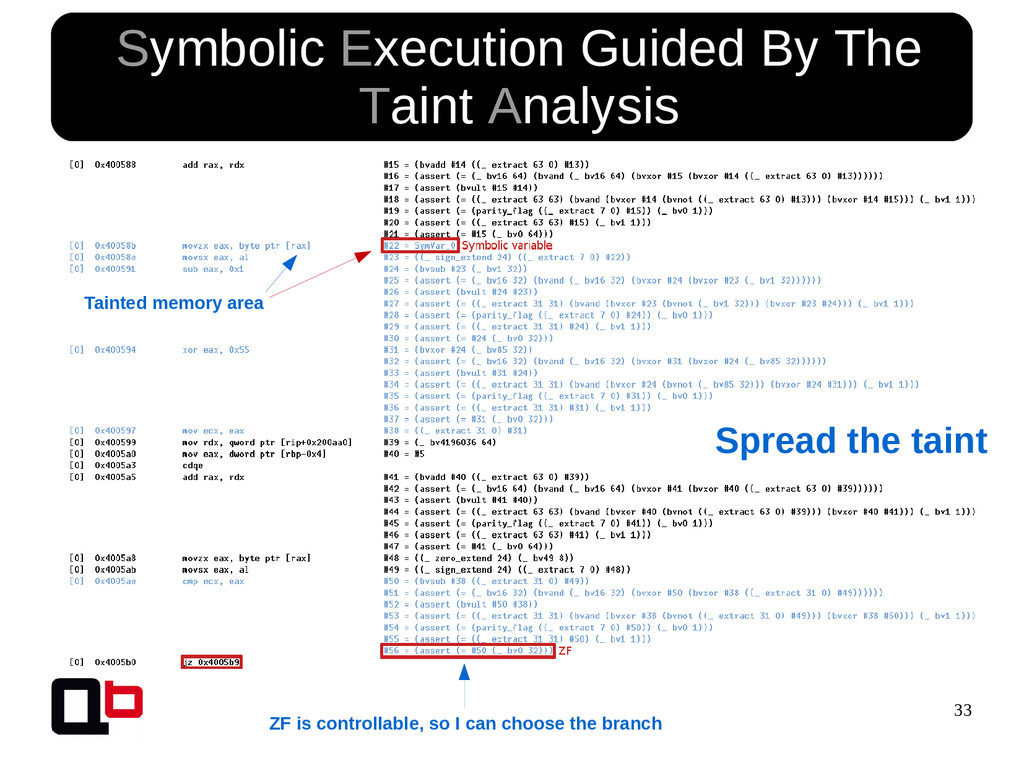
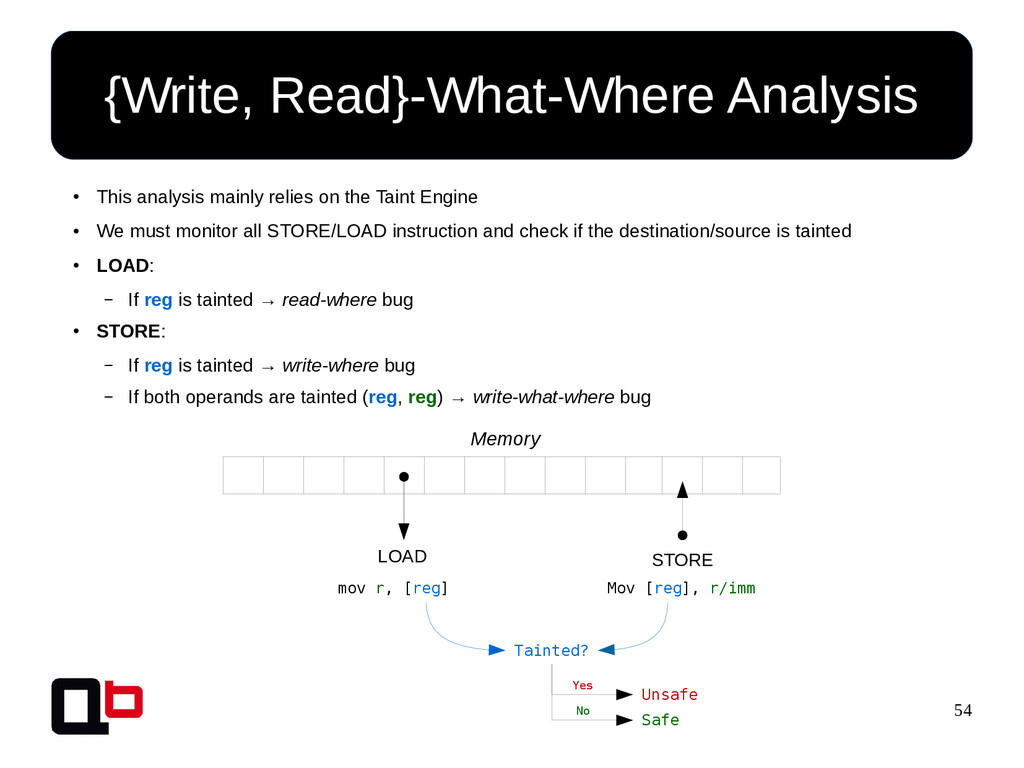
This talk can be considered like the part 2 of my talk at SecurityDay. In the previous part, I talked about how it was possible to cover a targeted function in memory using the DSE (Dynamic Symbolic Execution) approach. Cover a function (or its states) doesn't mean find all vulnerabilities, some vulnerability doesn't crashes the program. That's why we must implement specific analysis to find specific bugs. These analysis are based on the binary instrumentation and the runtime behavior analysis of the program. In this talk, we will see how it's possible to find these following kind of bugs : off-by-one, stack / heap overflow, use-after-free, format string and {write, read}-what-where.
![Dynamic Behavior Analysis Using Binary Instrumentation Jonathan Salwan [email protected] St'Hack](https://files.speakerdeck.com/presentations/f4482e57a8cb4224846f457f143a5281/slide_0.jpg)
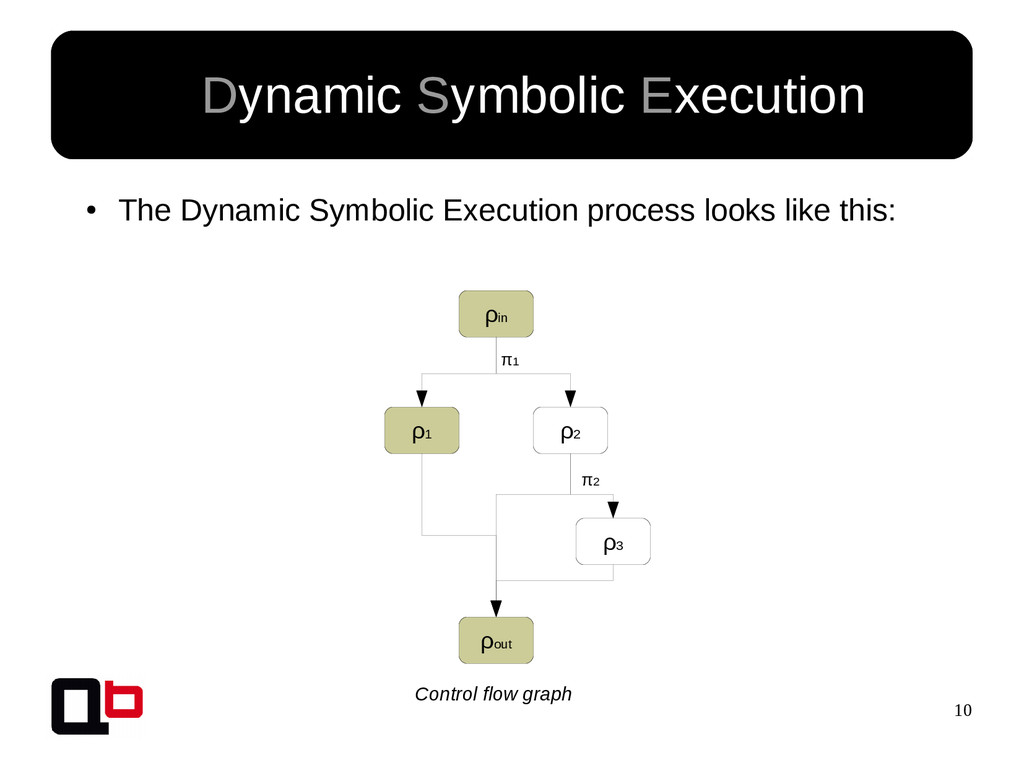
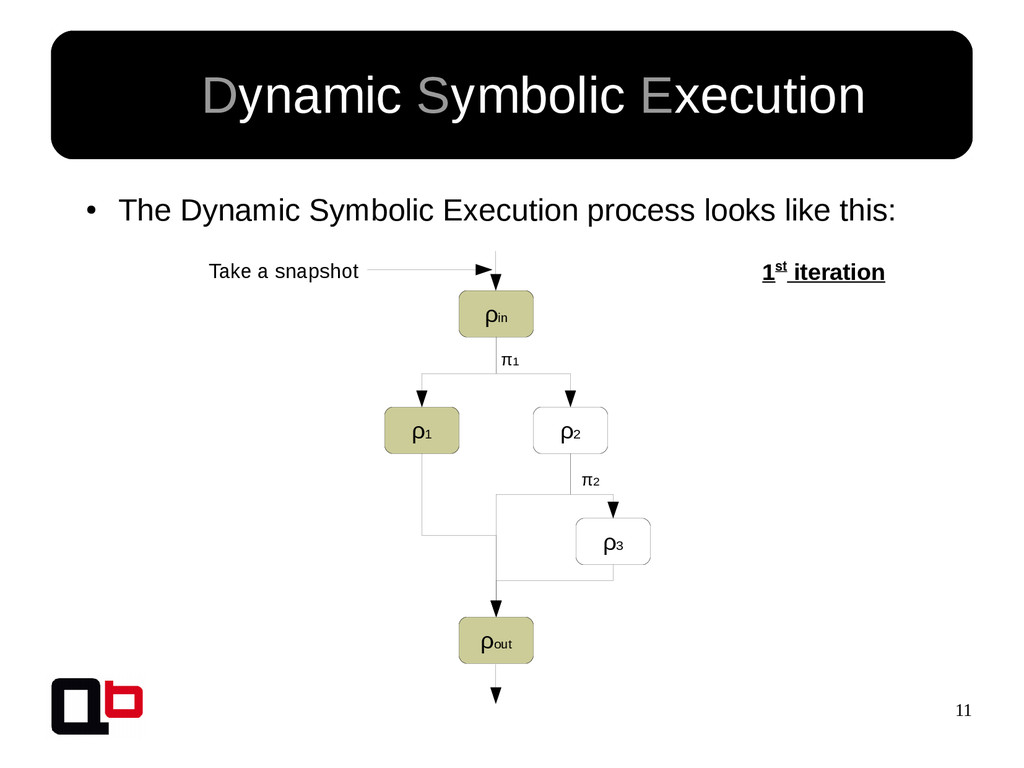
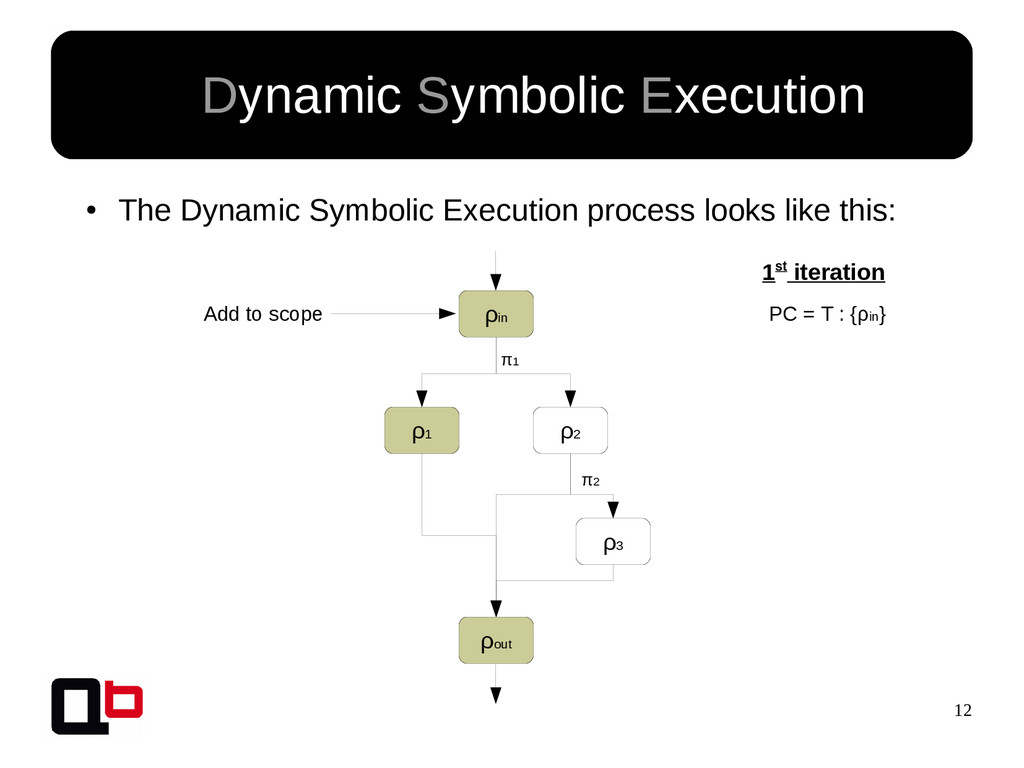
![7 • In the last talk [0] , we saw](https://files.speakerdeck.com/presentations/f4482e57a8cb4224846f457f143a5281/slide_6.jpg)
![48 Stack Overflow Analysis 01. 4006d4: mov qword ptr [rbp-0x10],](https://files.speakerdeck.com/presentations/f4482e57a8cb4224846f457f143a5281/slide_47.jpg)
![61 • Contact – Mail: [email protected] – Twitter: @JonathanSalwan •](https://files.speakerdeck.com/presentations/f4482e57a8cb4224846f457f143a5281/slide_60.jpg)