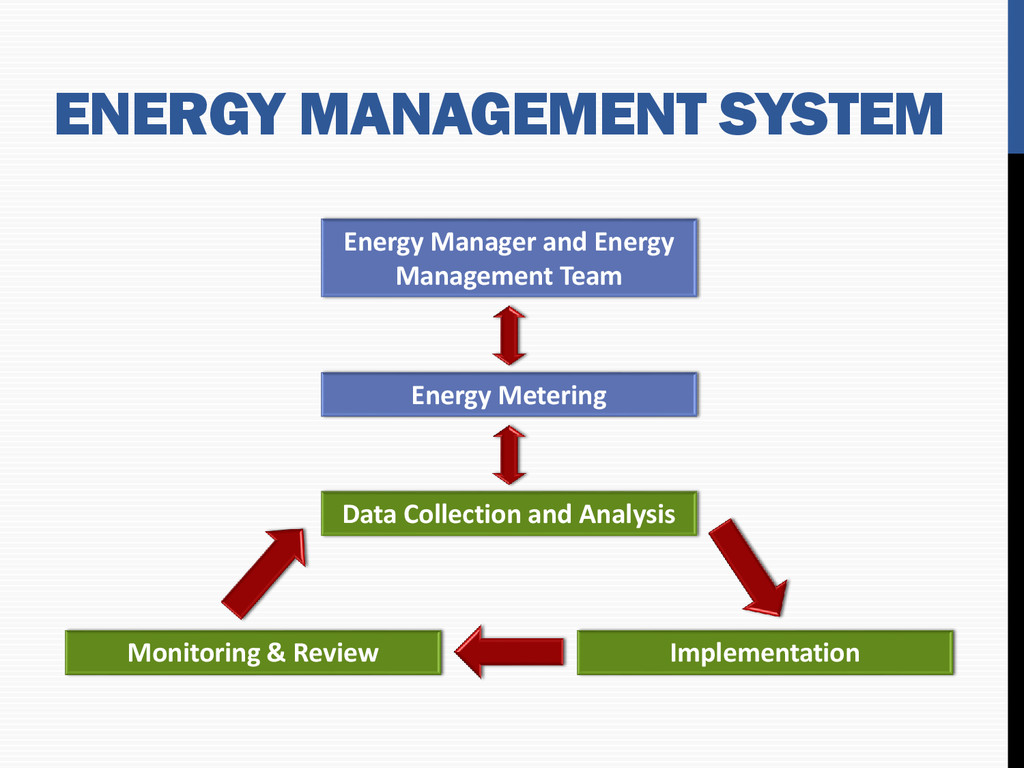
Energy Efficiency & Energy Conservation Energy Management in CEB Loss Reduction • Technical Loss Reduction • Non-Technical Loss Reduction • Commercial Loss Reduction Energy Auditing & Conservation Energy Awareness
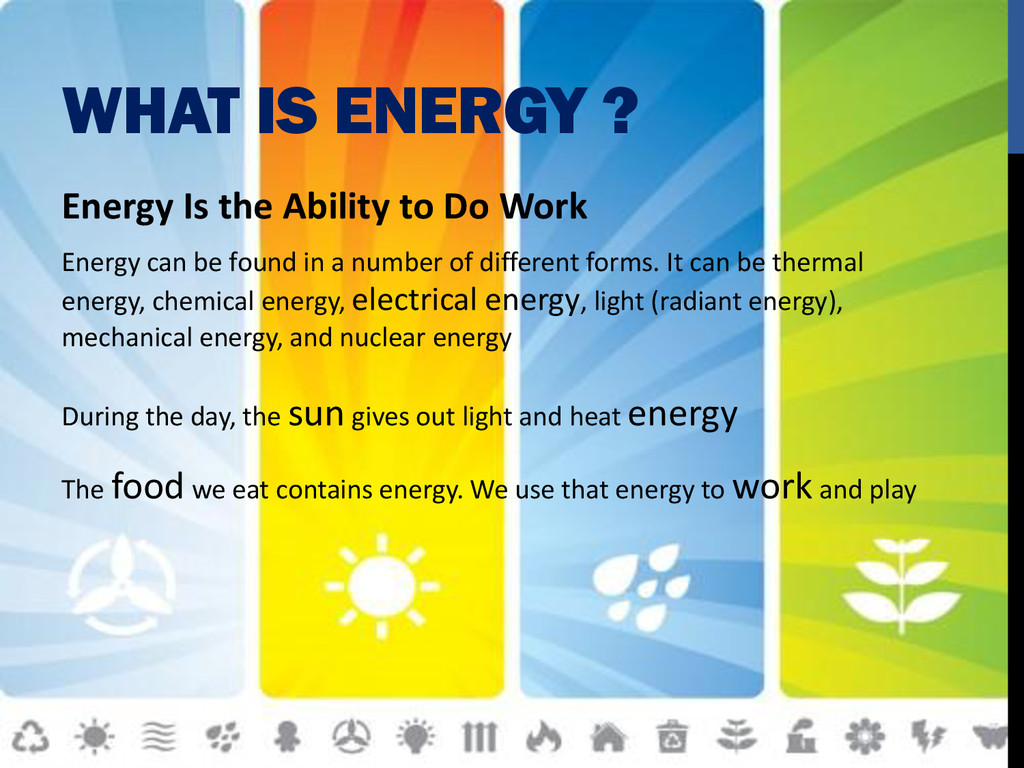
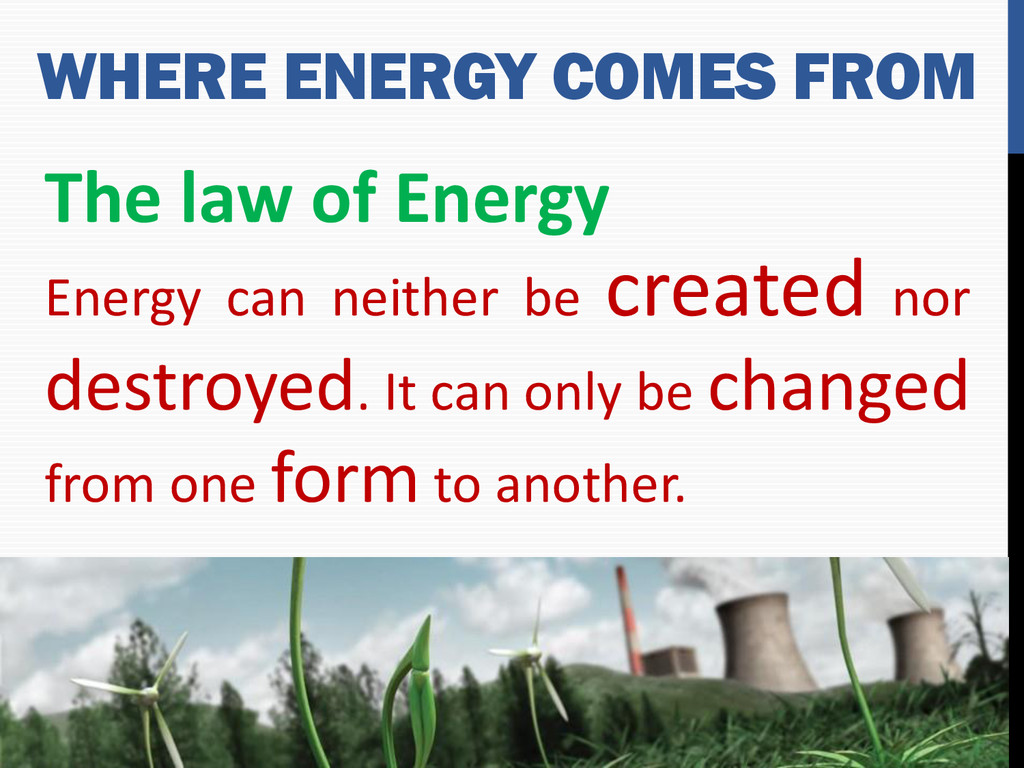
Work Energy can be found in a number of different forms. It can be thermal energy, chemical energy, electrical energy, light (radiant energy), mechanical energy, and nuclear energy During the day, the sun gives out light and heat energy The food we eat contains energy. We use that energy to work and play
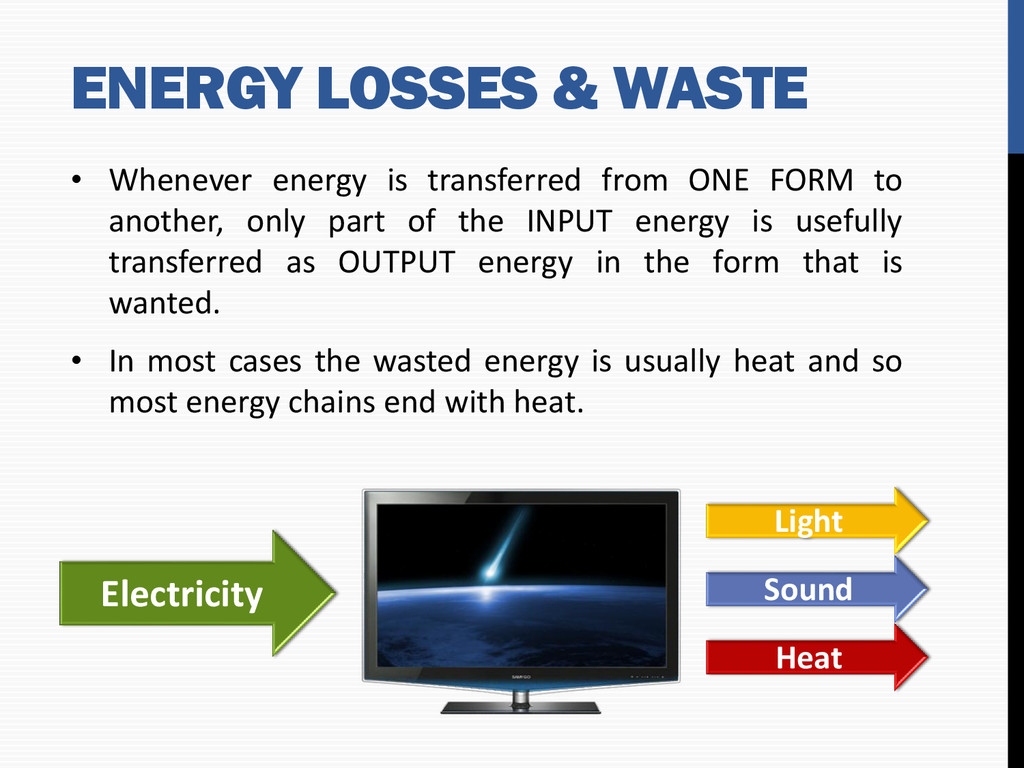
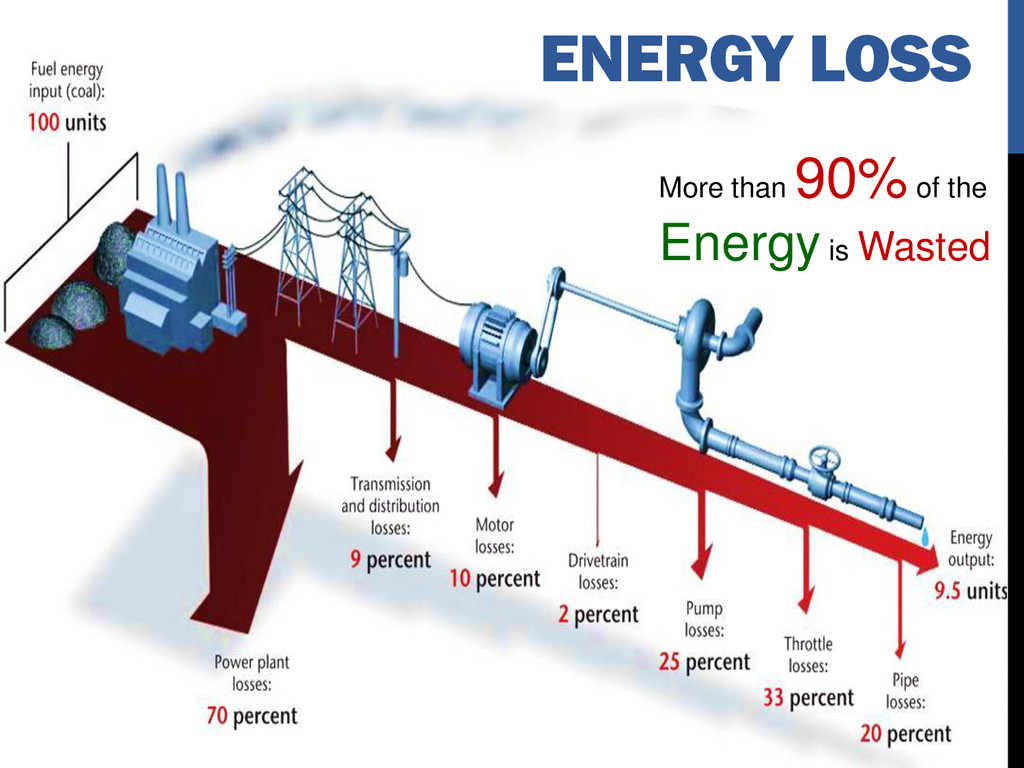
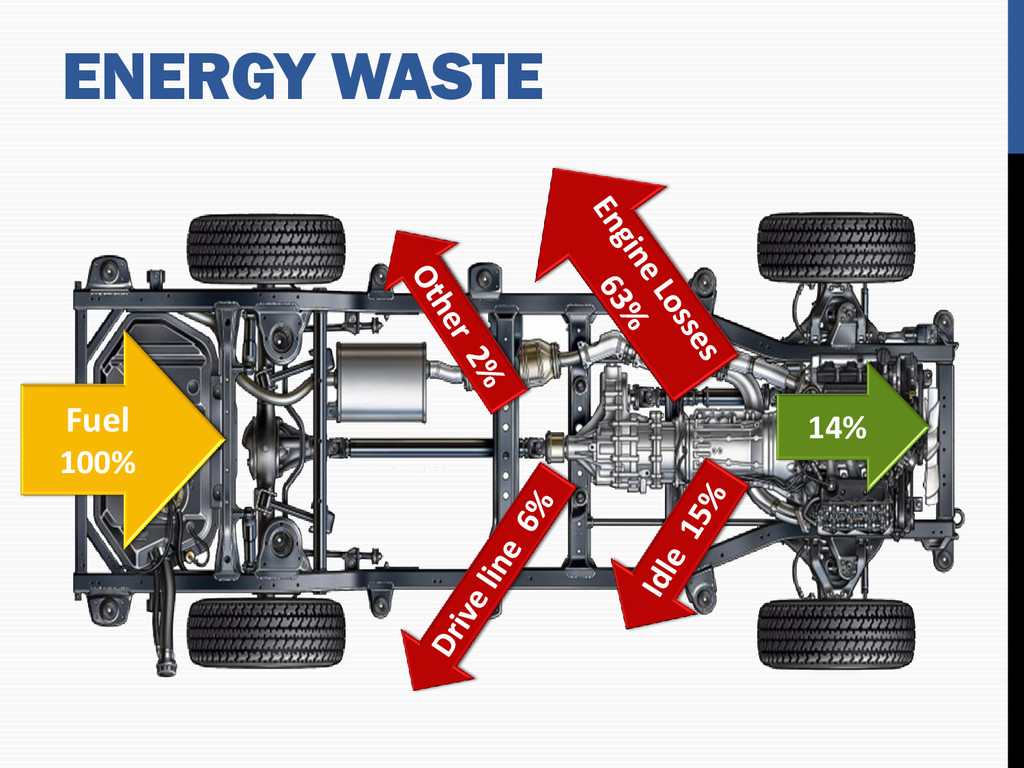
ONE FORM to another, only part of the INPUT energy is usefully transferred as OUTPUT energy in the form that is wanted. • In most cases the wasted energy is usually heat and so most energy chains end with heat. Electricity Light Sound Heat
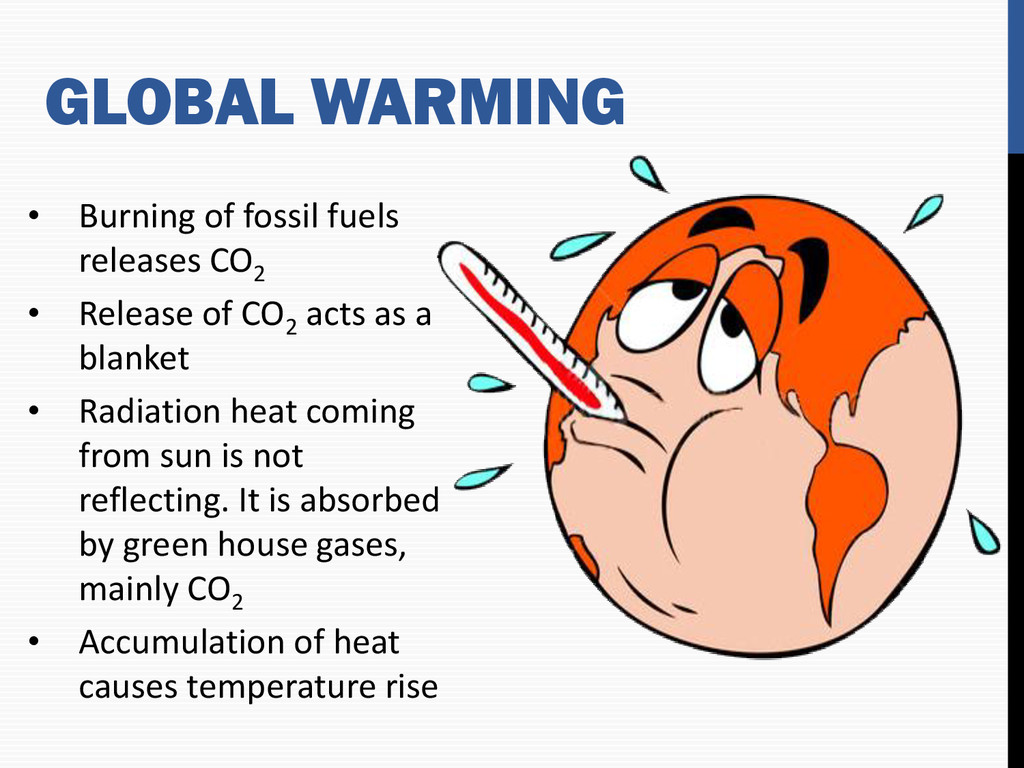
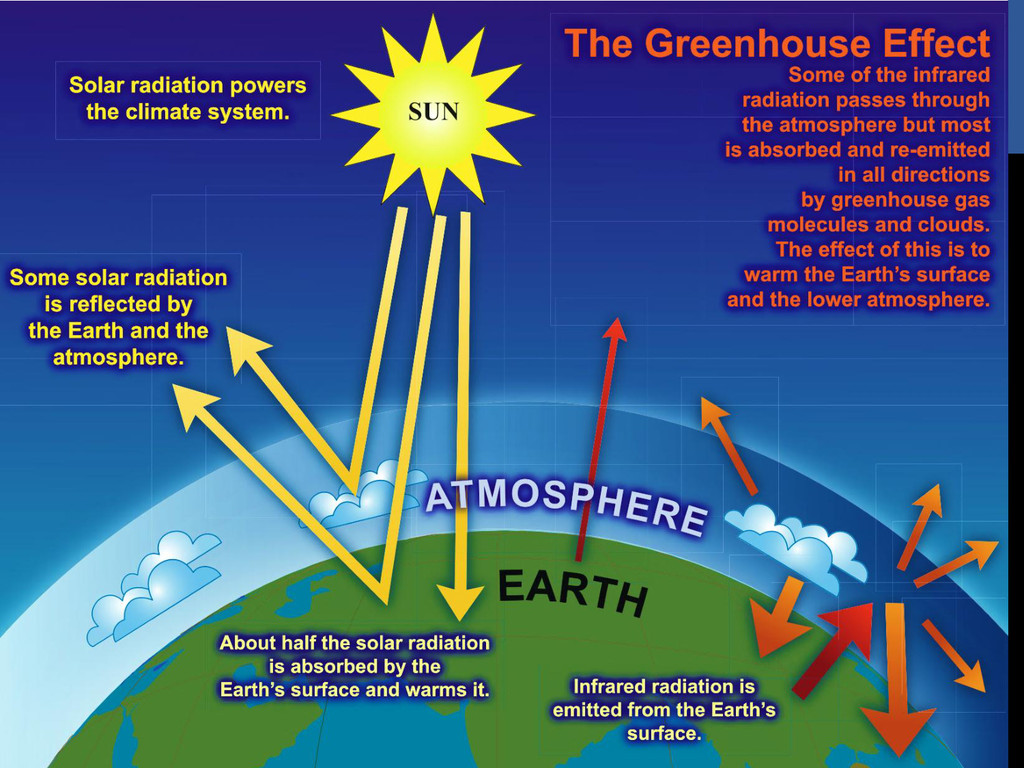
Release of CO2 acts as a blanket • Radiation heat coming from sun is not reflecting. It is absorbed by green house gases, mainly CO2 • Accumulation of heat causes temperature rise
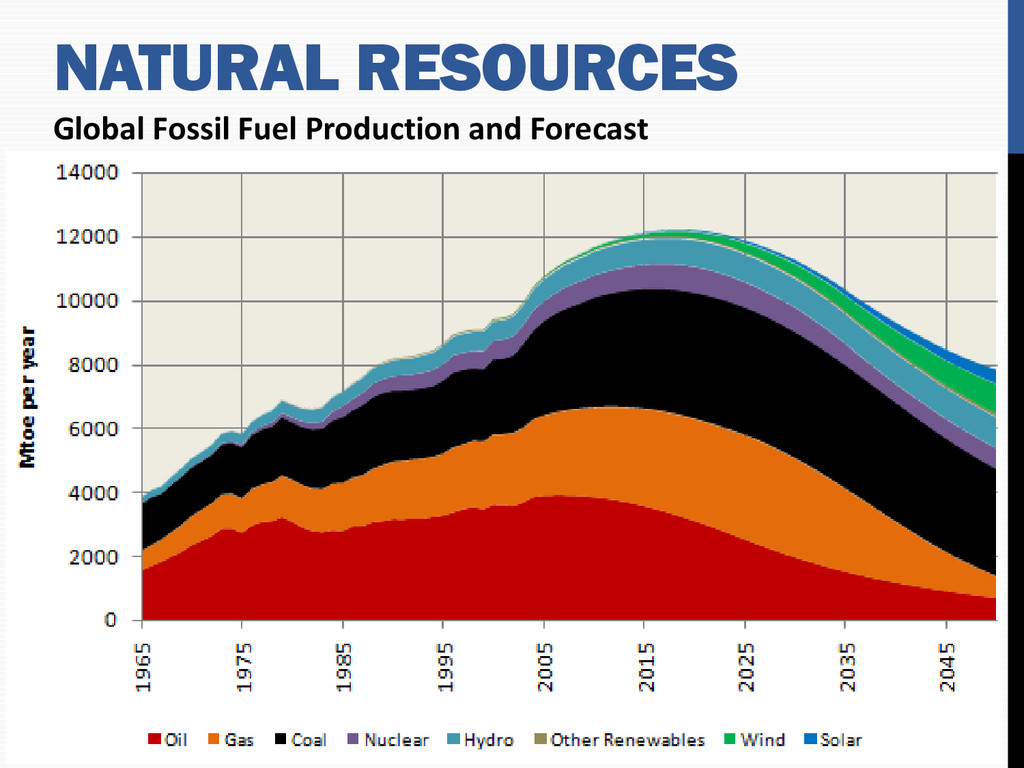
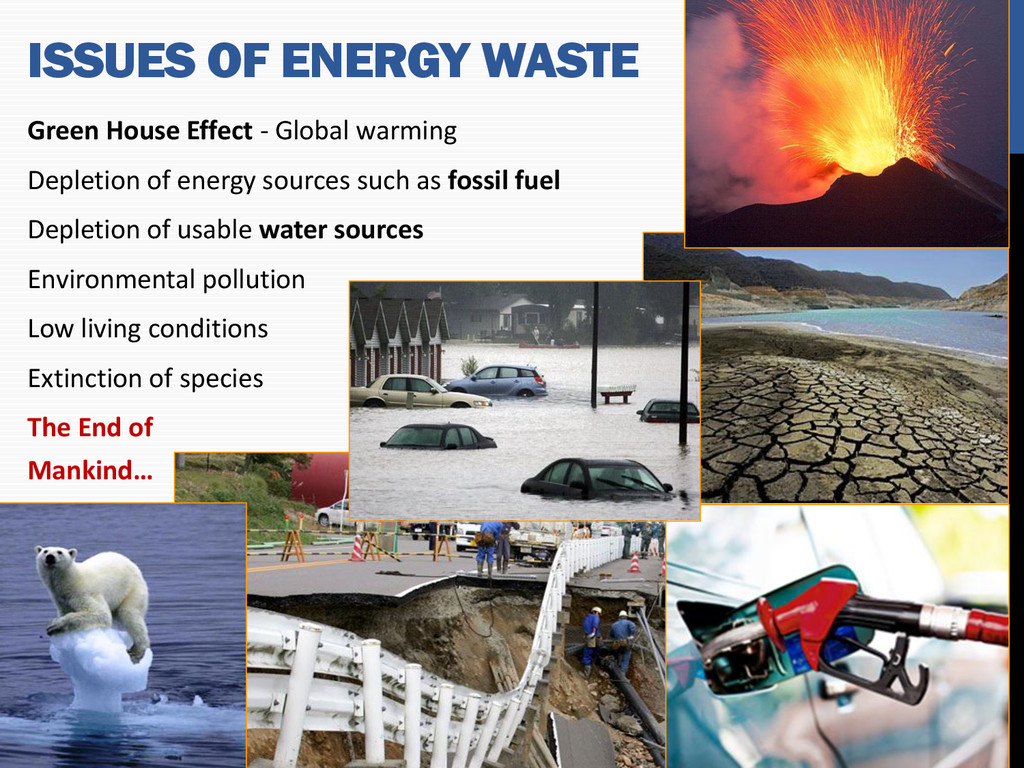
Depletion of energy sources such as fossil fuel Depletion of usable water sources Environmental pollution Low living conditions Extinction of species The End of Mankind…
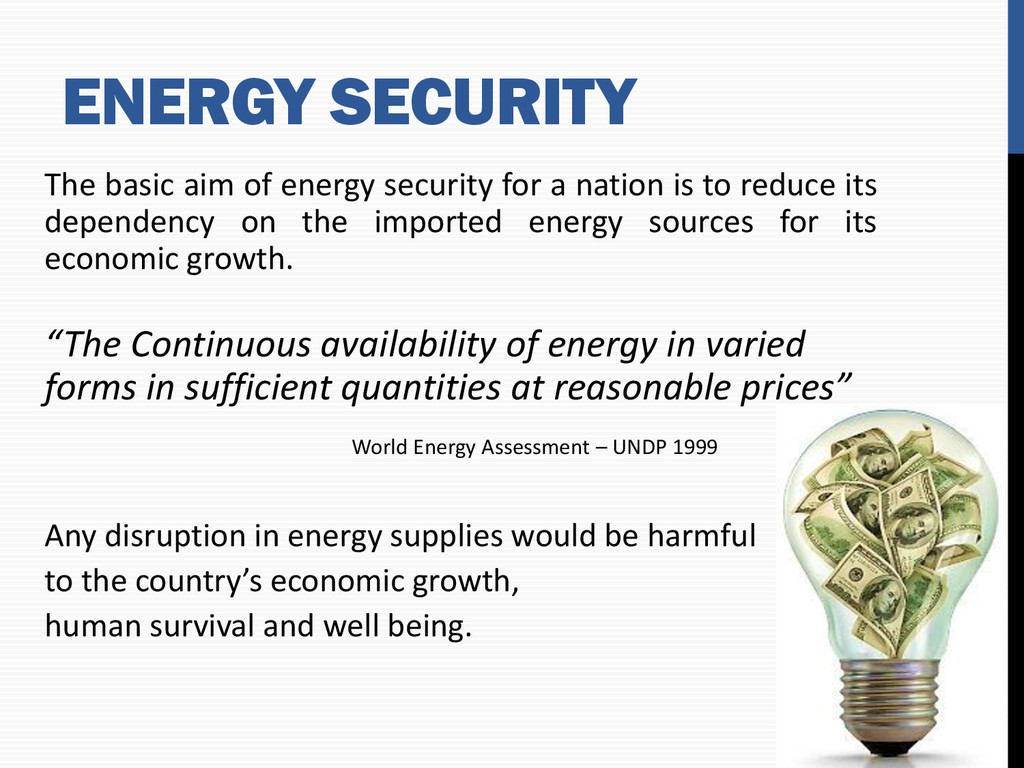
nation is to reduce its dependency on the imported energy sources for its economic growth. “The Continuous availability of energy in varied forms in sufficient quantities at reasonable prices” World Energy Assessment – UNDP 1999 Any disruption in energy supplies would be harmful to the country’s economic growth, human survival and well being.
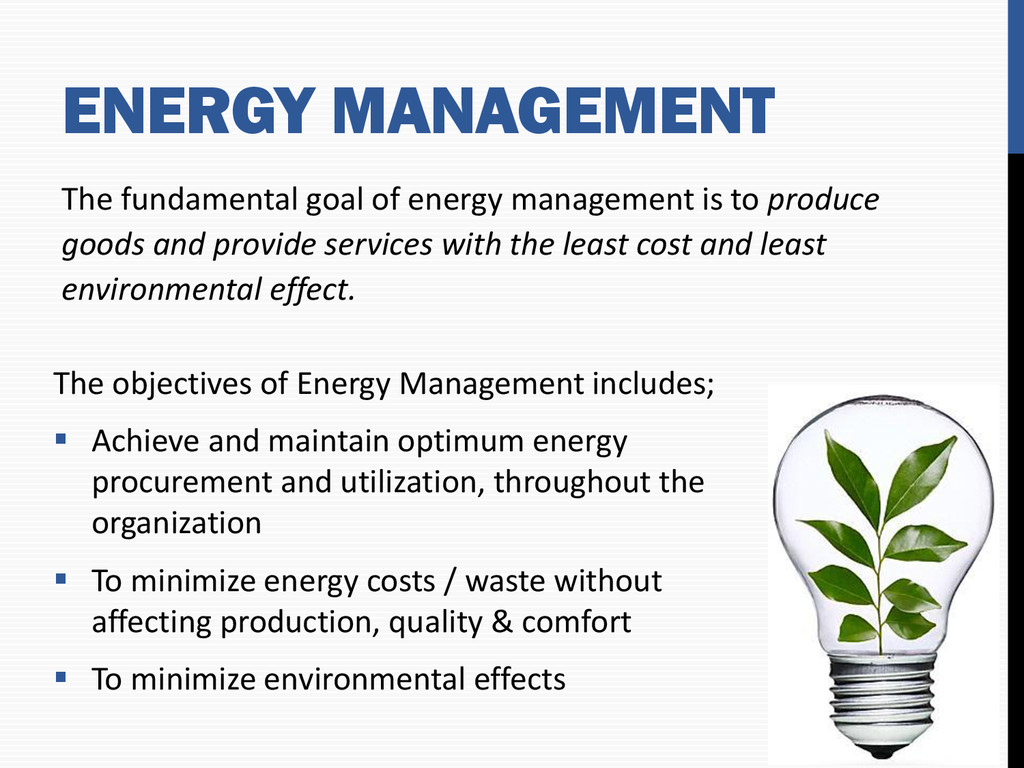
produce goods and provide services with the least cost and least environmental effect. The objectives of Energy Management includes; Achieve and maintain optimum energy procurement and utilization, throughout the organization To minimize energy costs / waste without affecting production, quality & comfort To minimize environmental effects
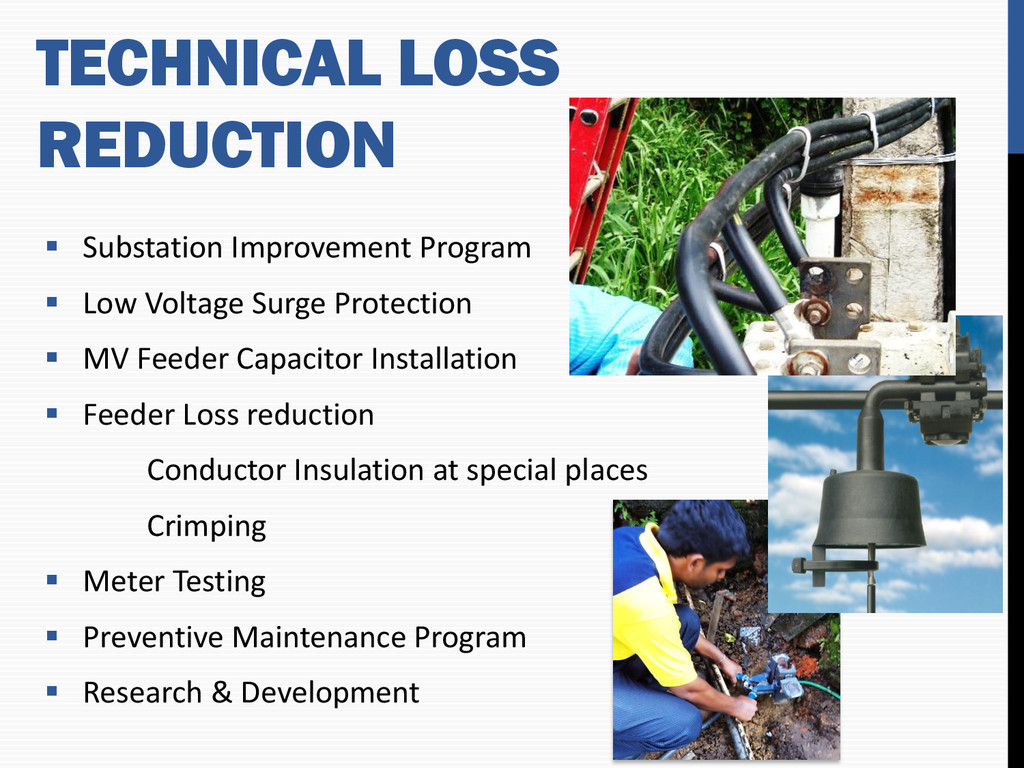
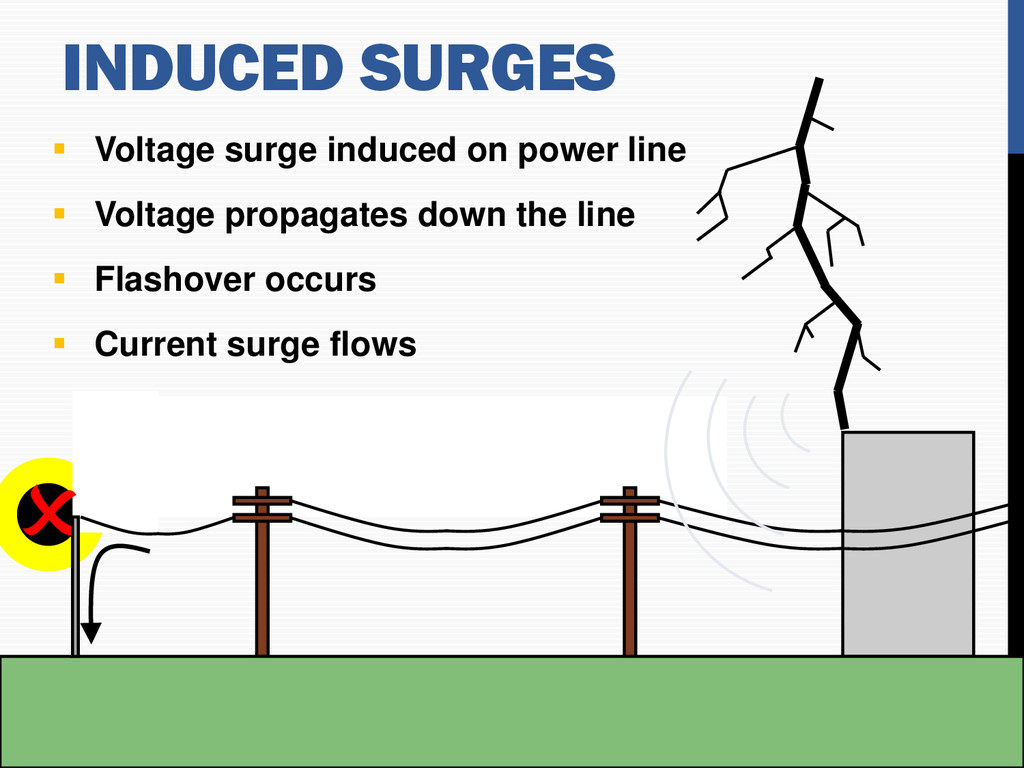
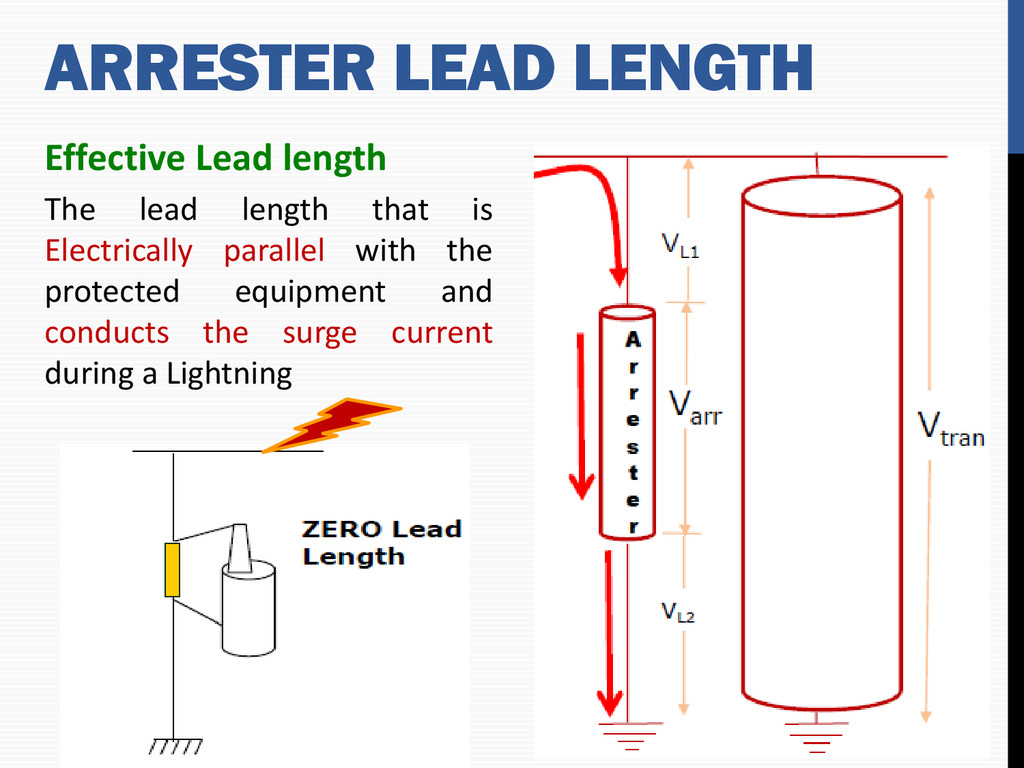
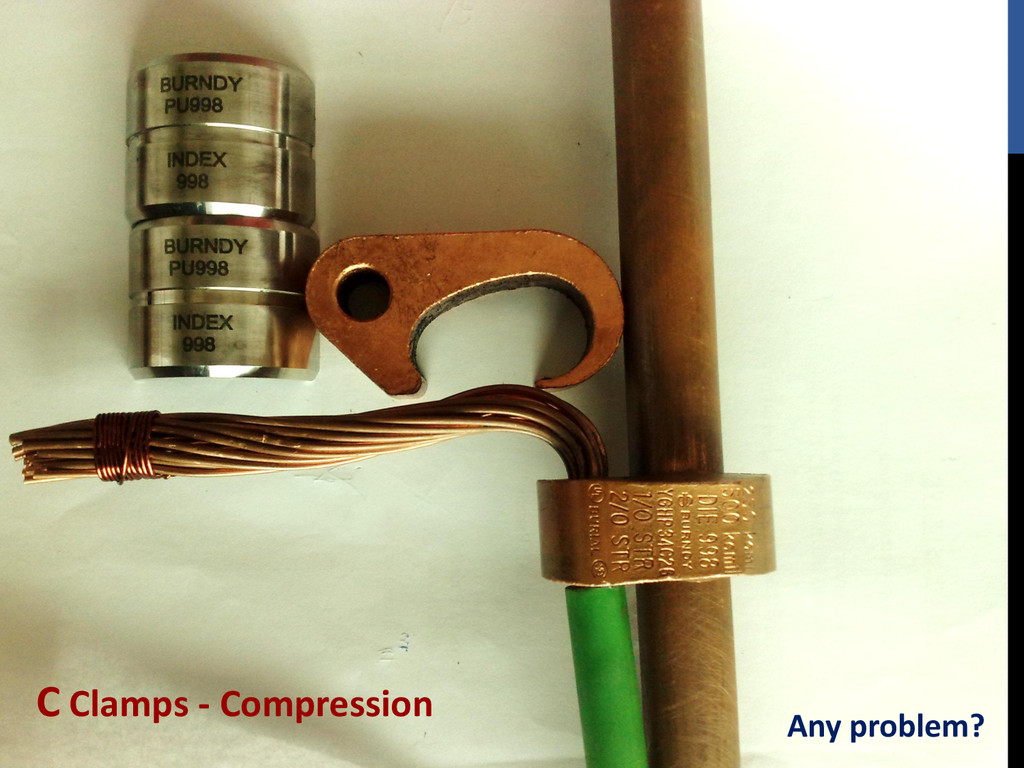
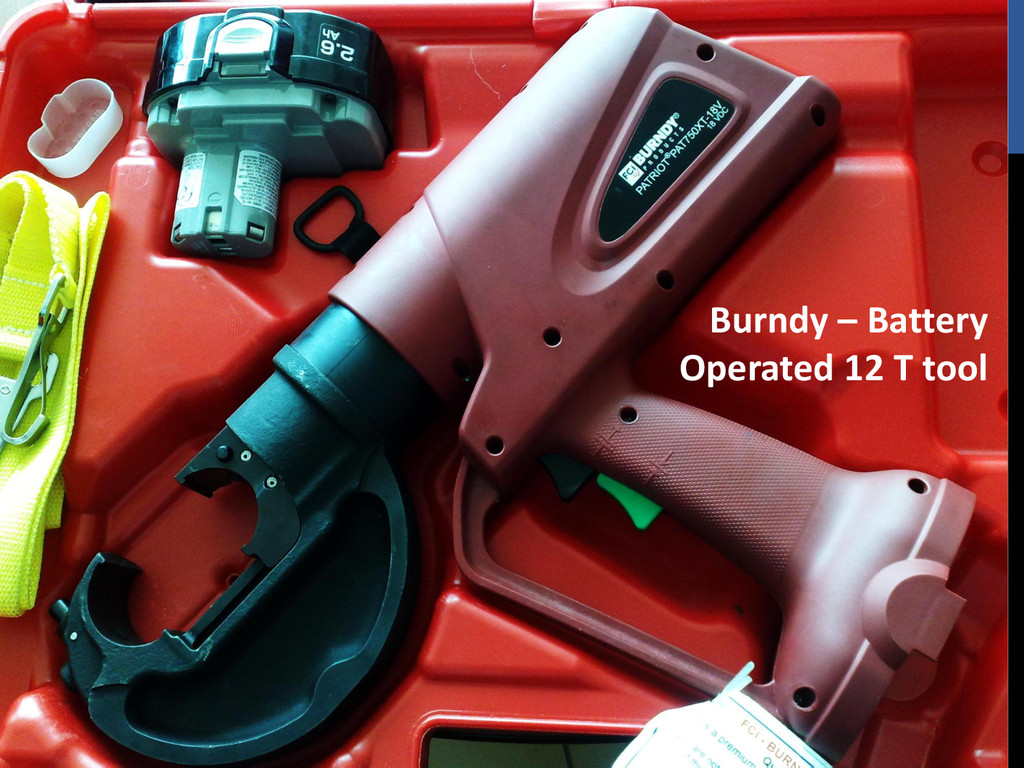
Surge Protection MV Feeder Capacitor Installation Feeder Loss reduction Conductor Insulation at special places Crimping Meter Testing Preventive Maintenance Program Research & Development
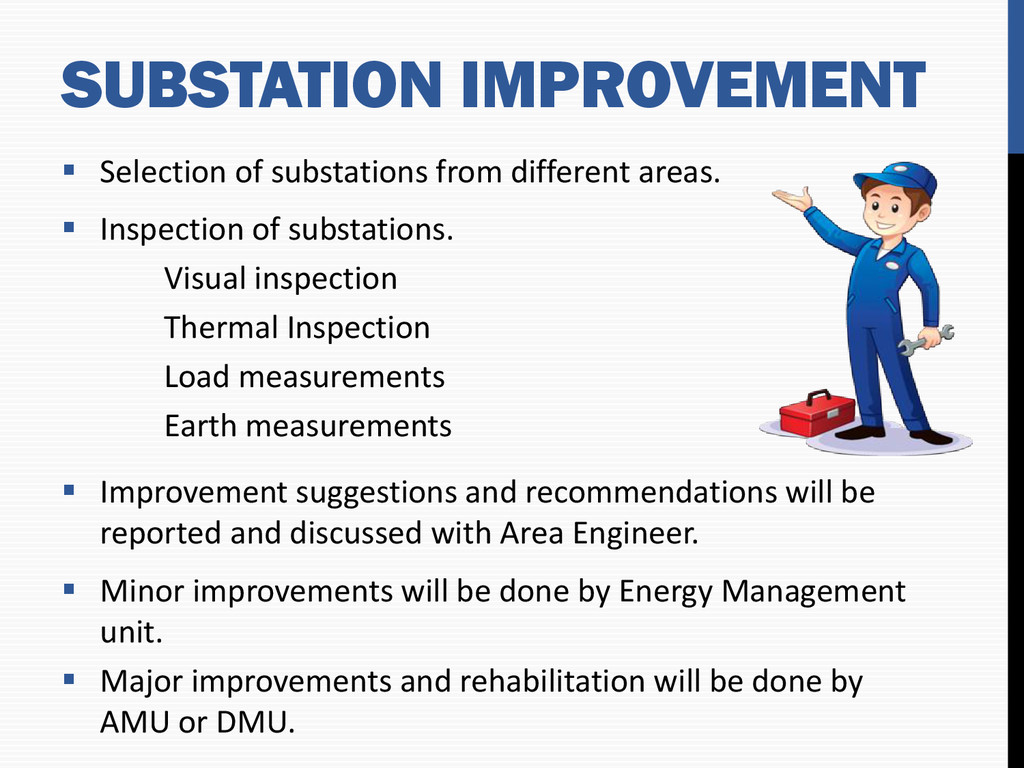
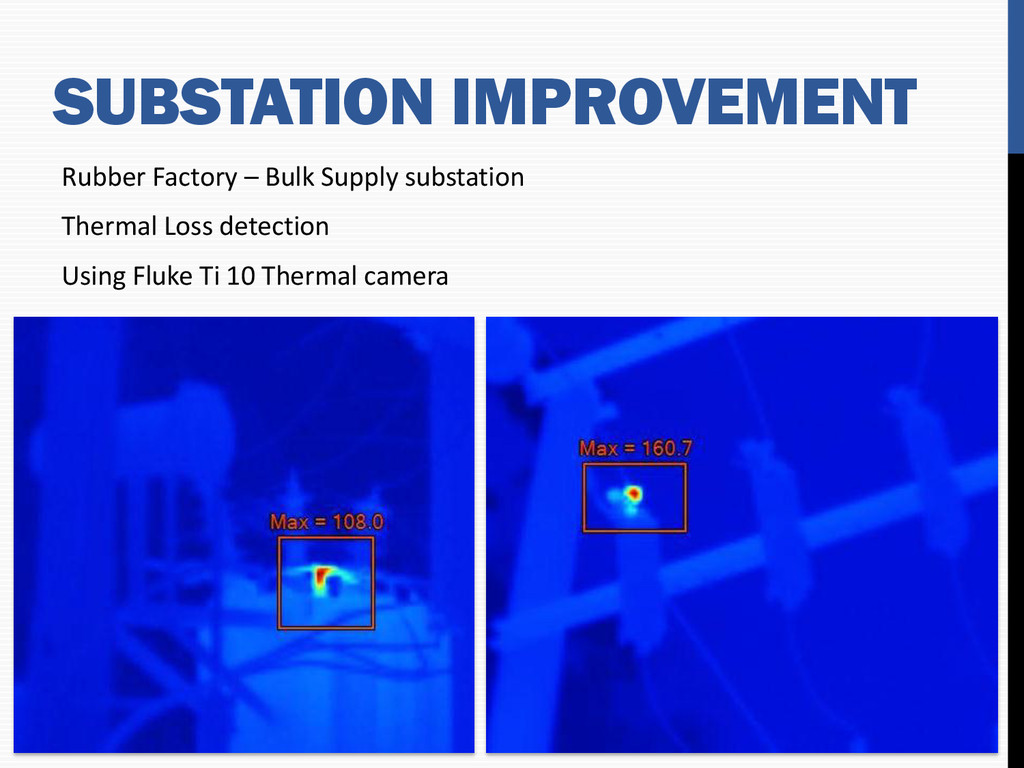
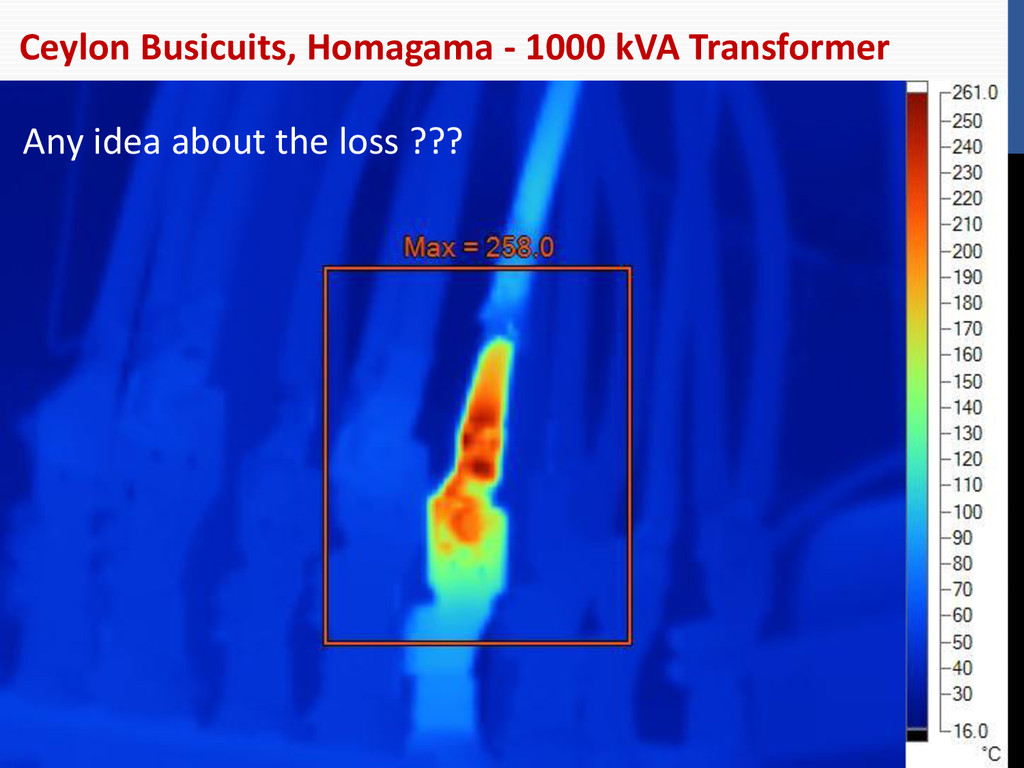
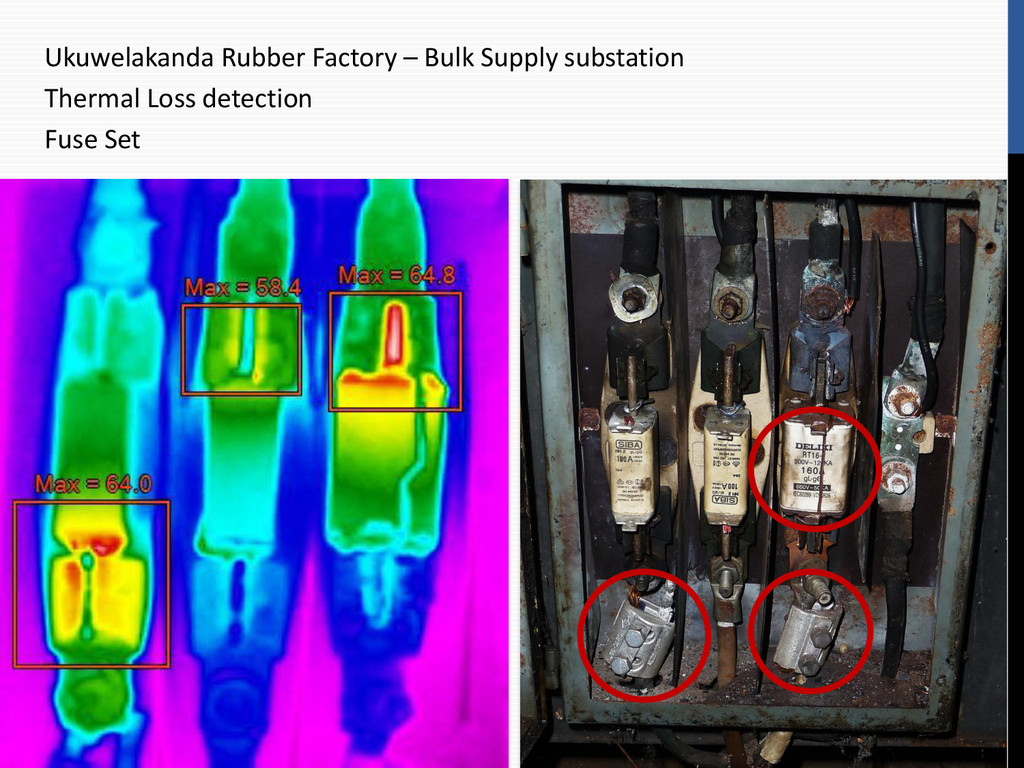
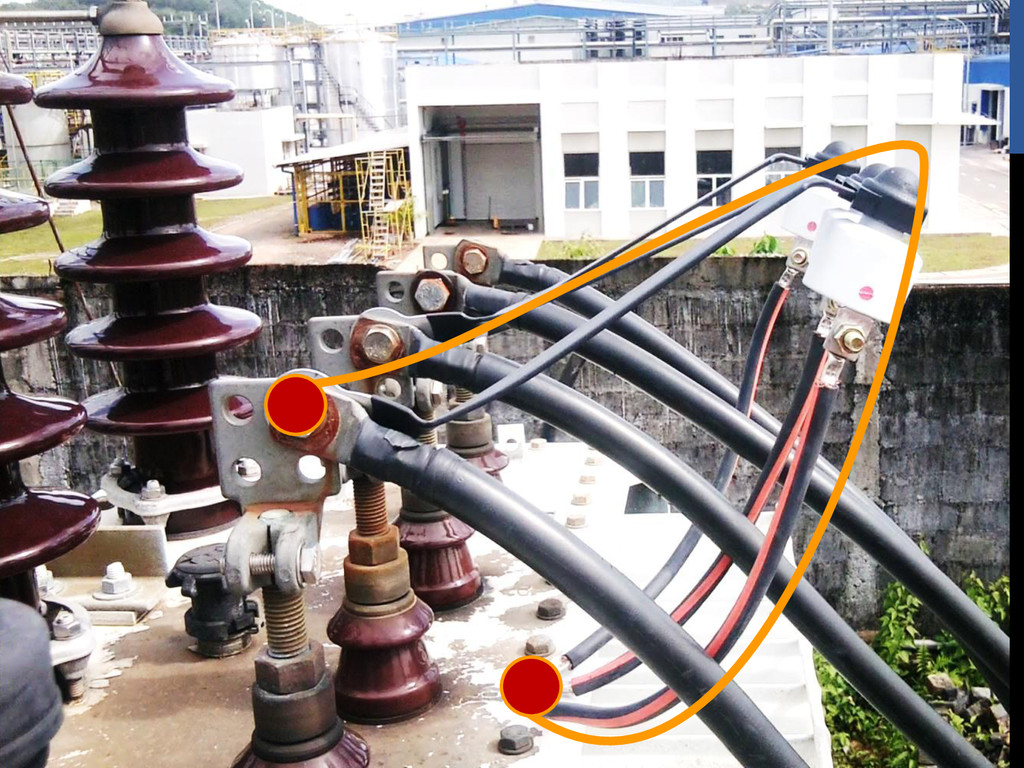
Inspection of substations. Visual inspection Thermal Inspection Load measurements Earth measurements Improvement suggestions and recommendations will be reported and discussed with Area Engineer. Minor improvements will be done by Energy Management unit. Major improvements and rehabilitation will be done by AMU or DMU.
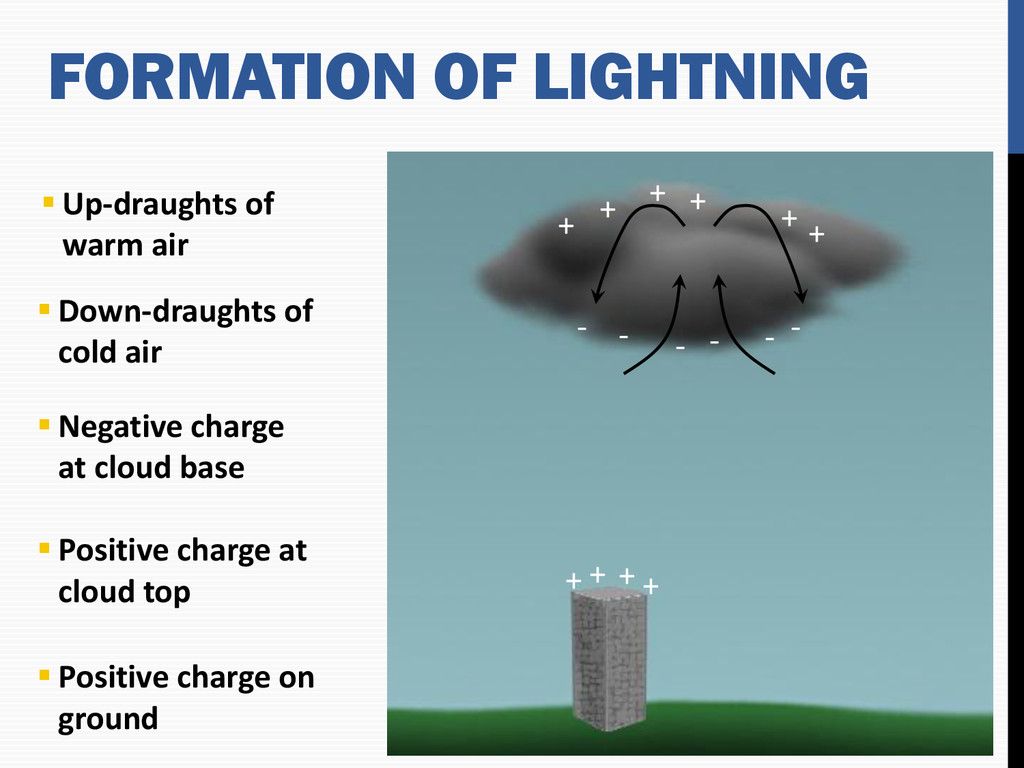
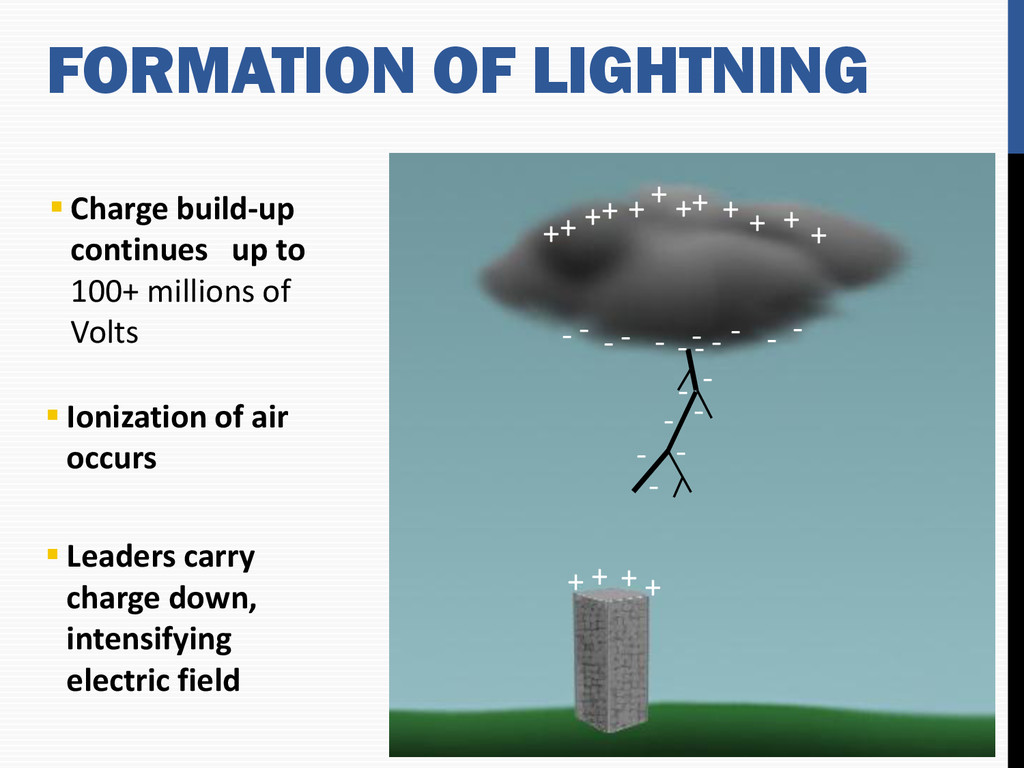
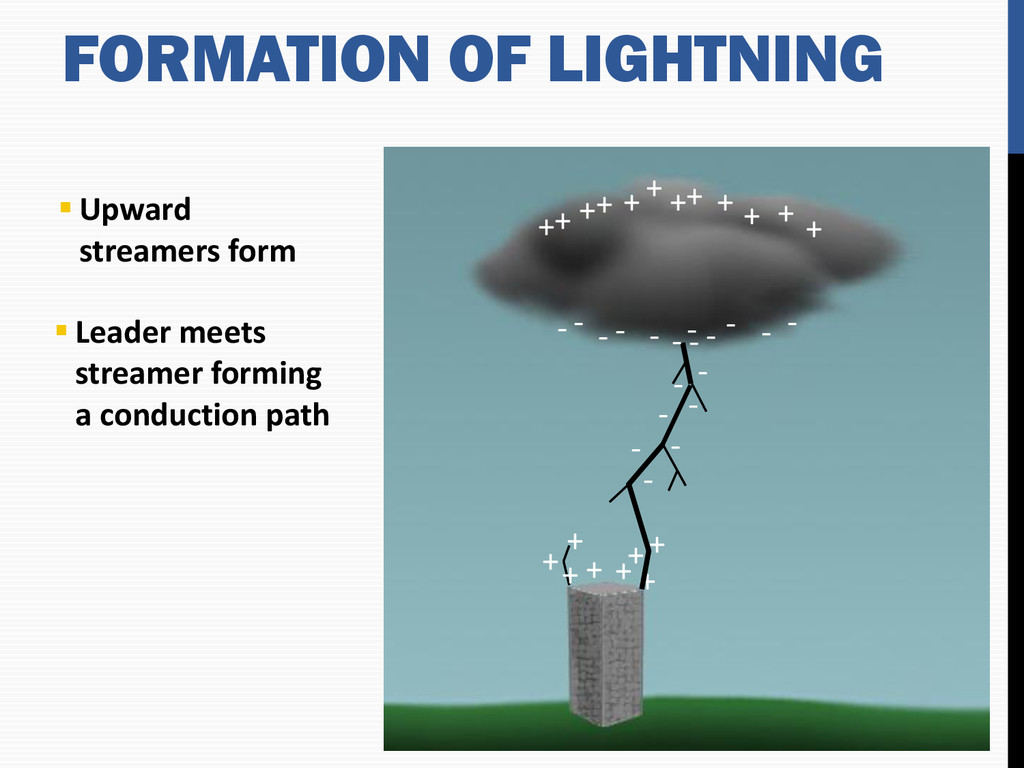
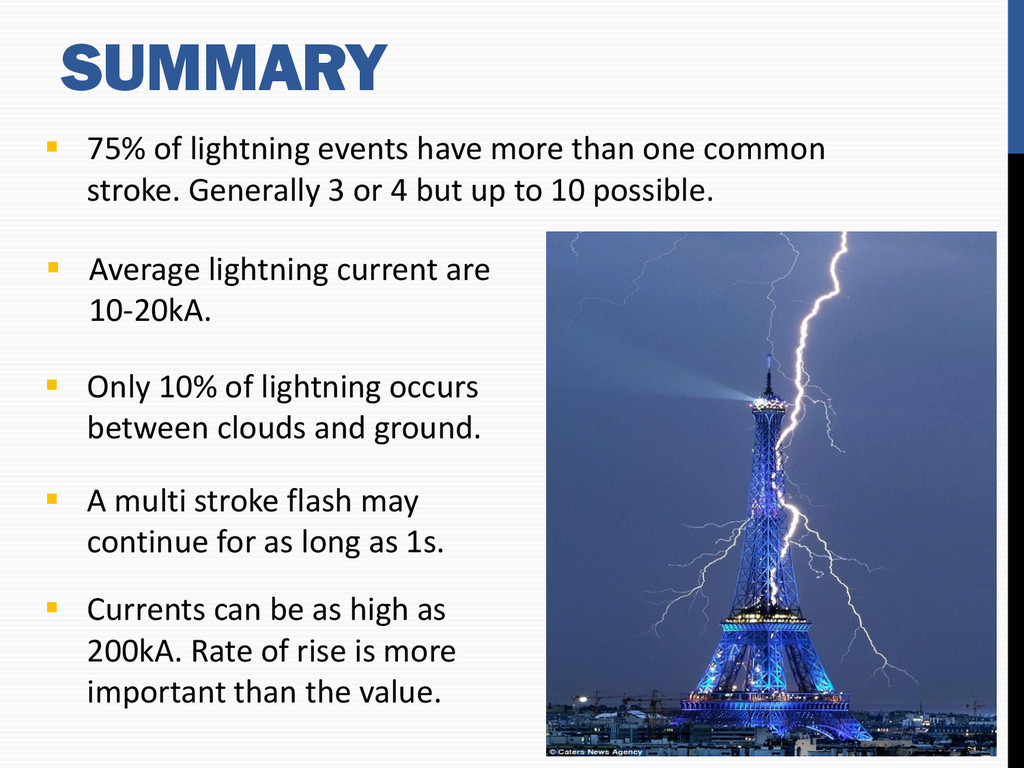
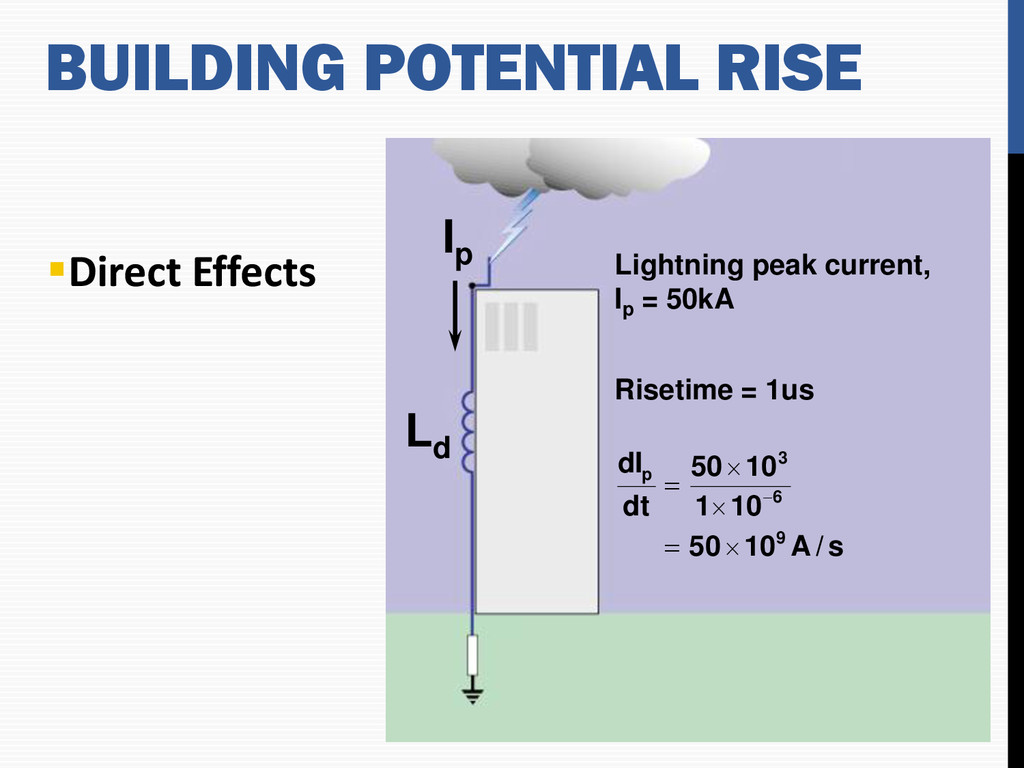
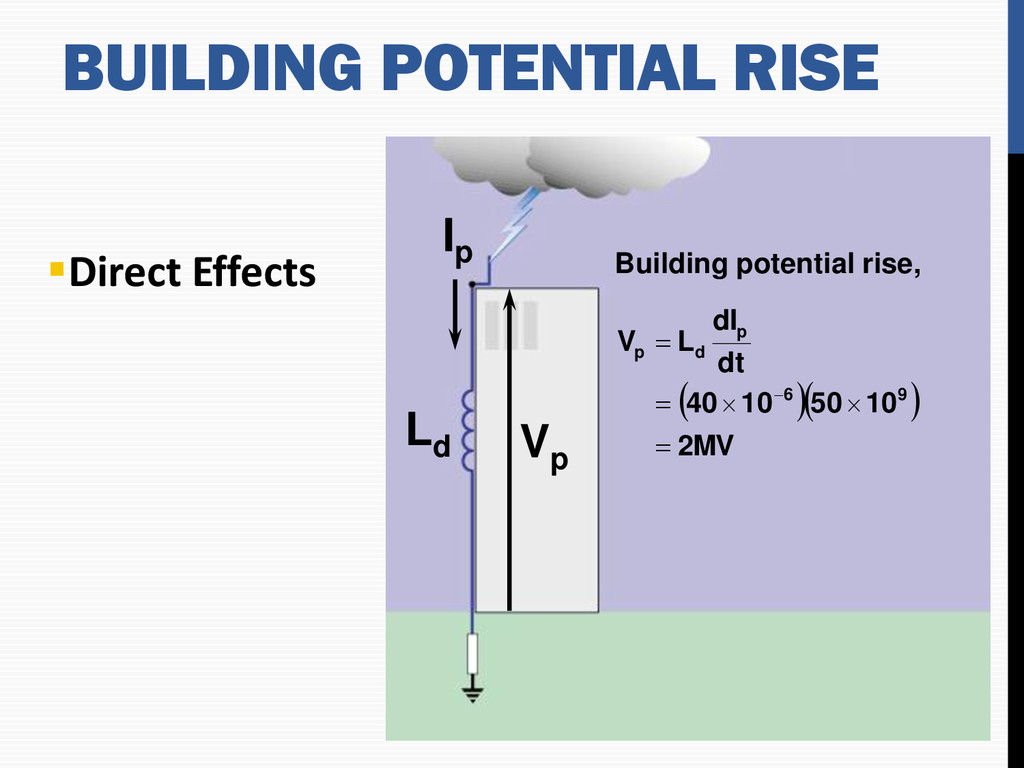
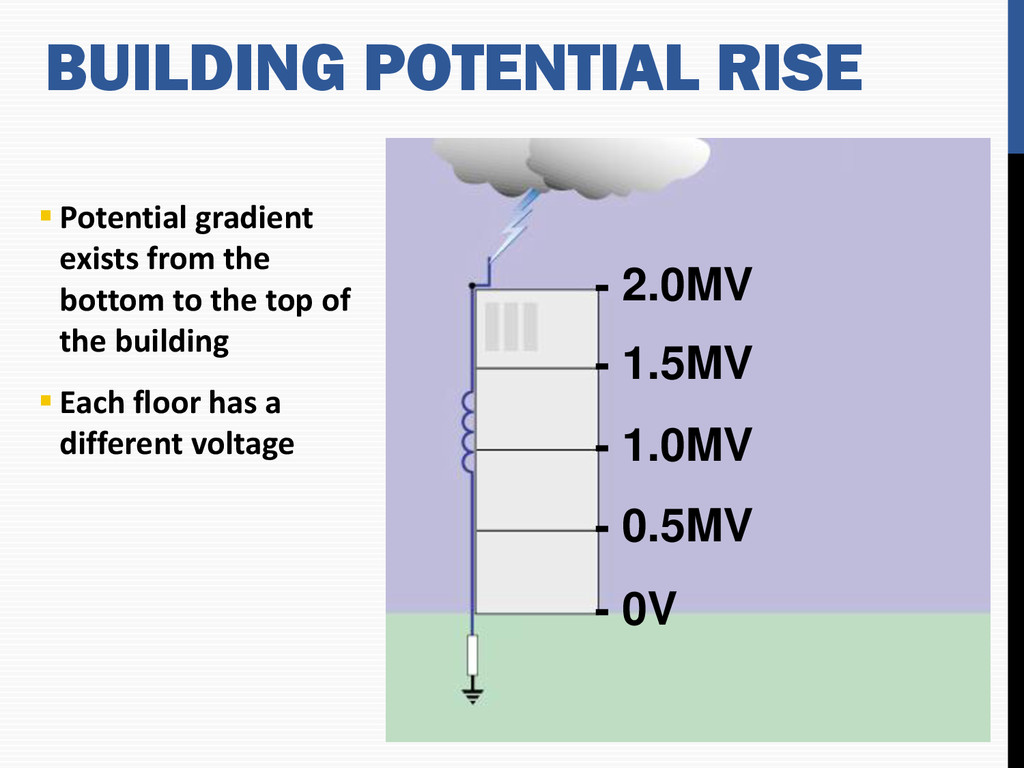
Currents can be as high as 200kA. Rate of rise is more important than the value. A multi stroke flash may continue for as long as 1s. Average lightning current are 10-20kA. 75% of lightning events have more than one common stroke. Generally 3 or 4 but up to 10 possible. SUMMARY
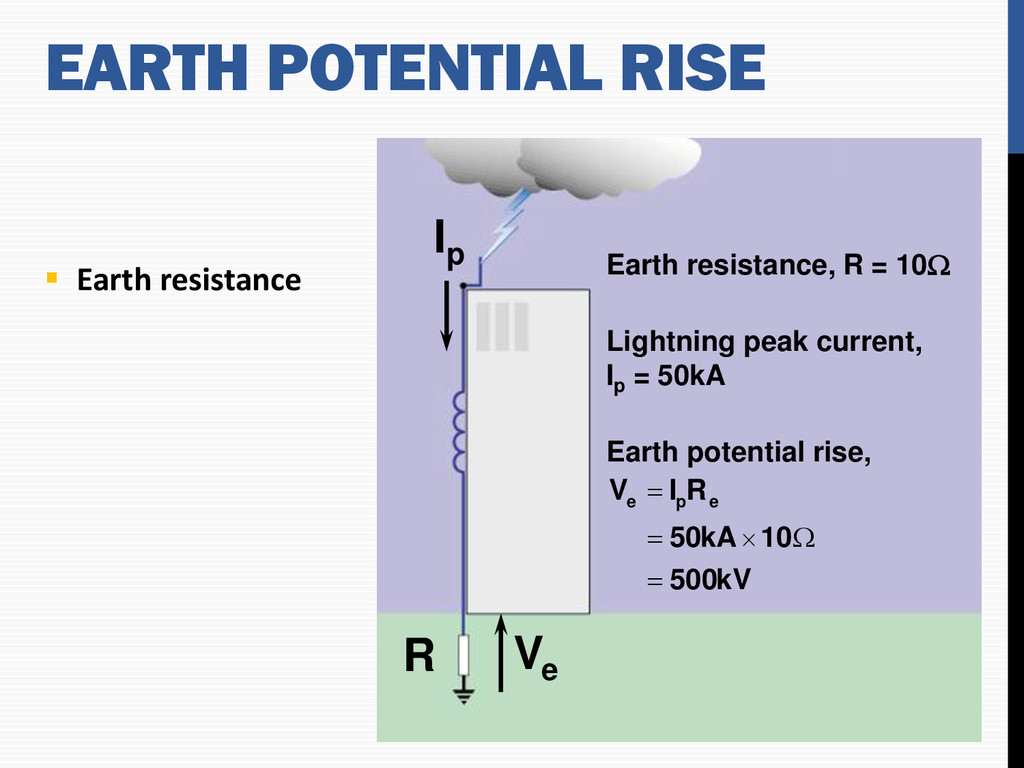
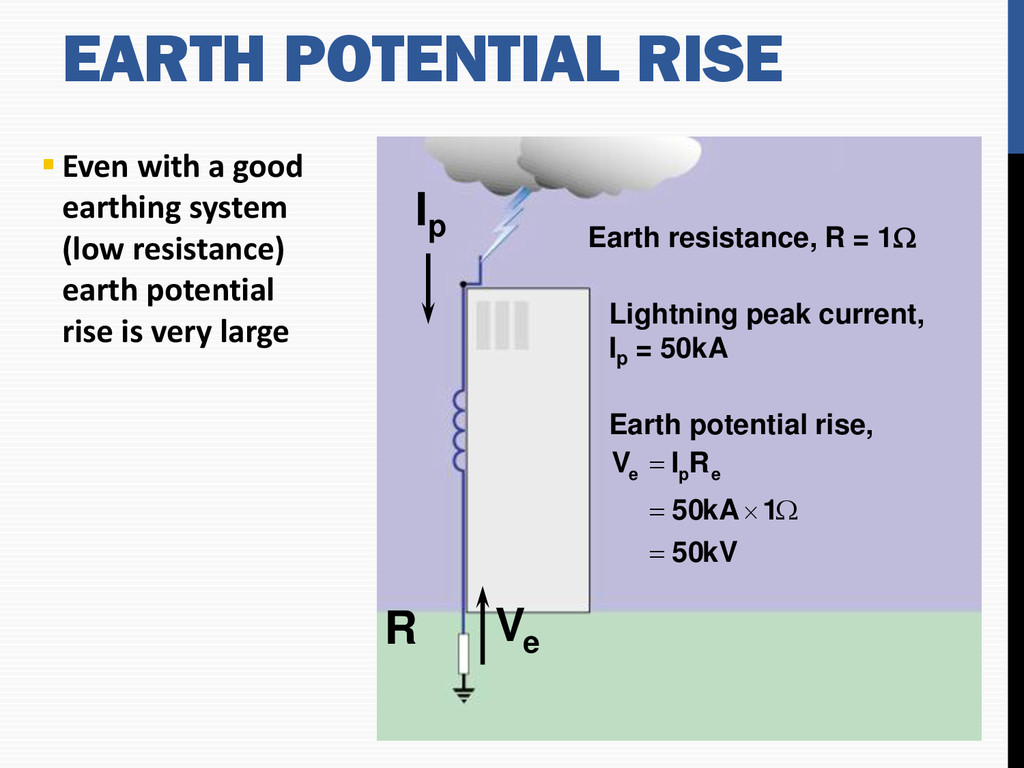
current, Ip = 50kA Earth potential rise, kV 50 1 kA 50 R I V e p e Even with a good earthing system (low resistance) earth potential rise is very large EARTH POTENTIAL RISE
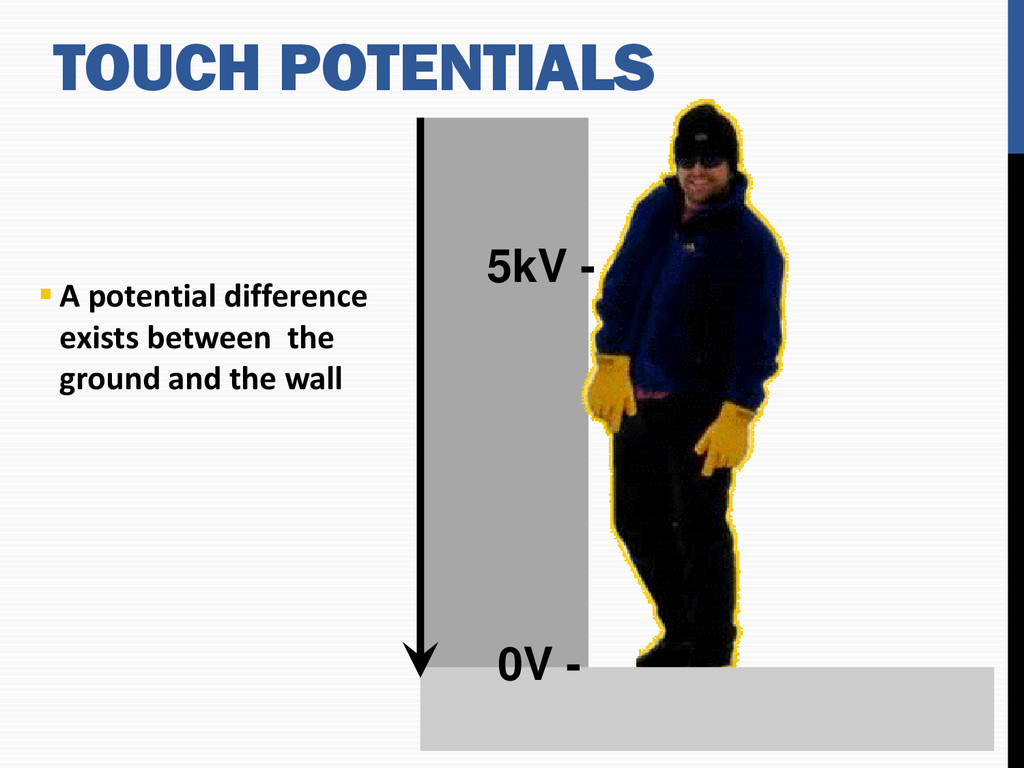
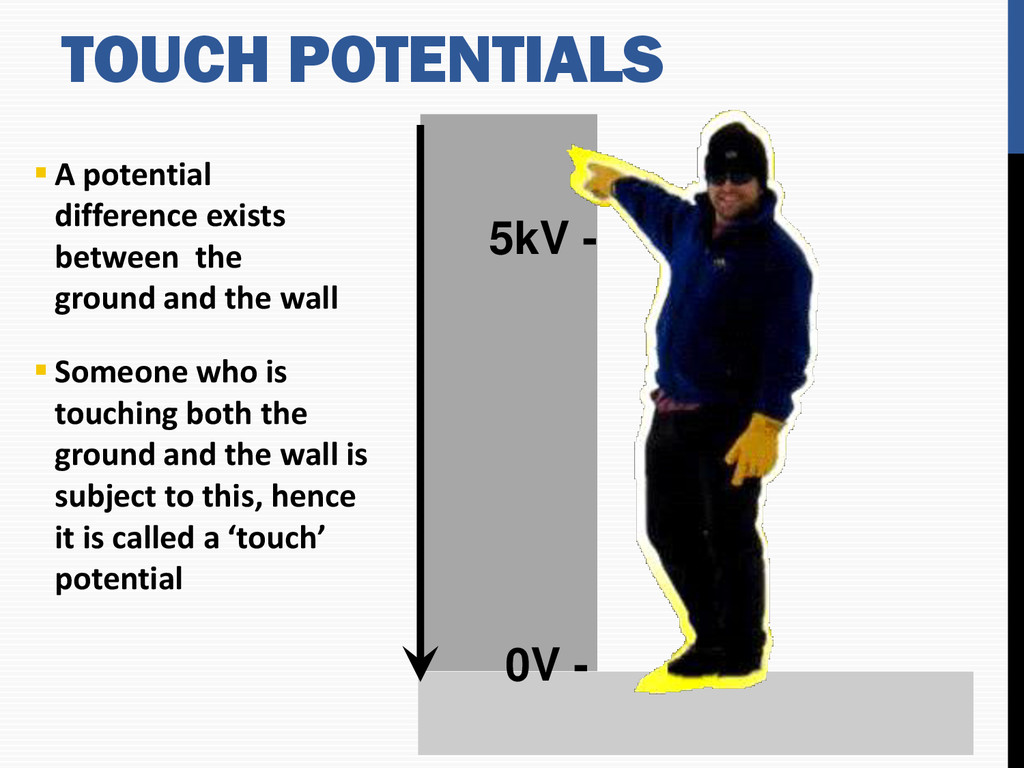
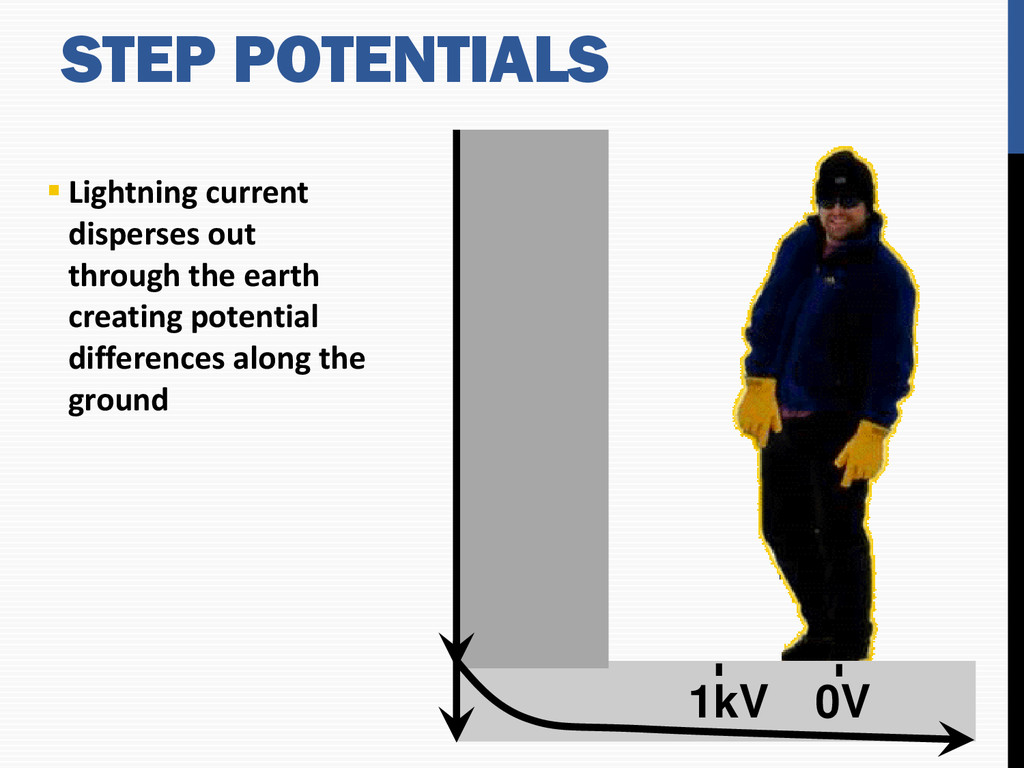
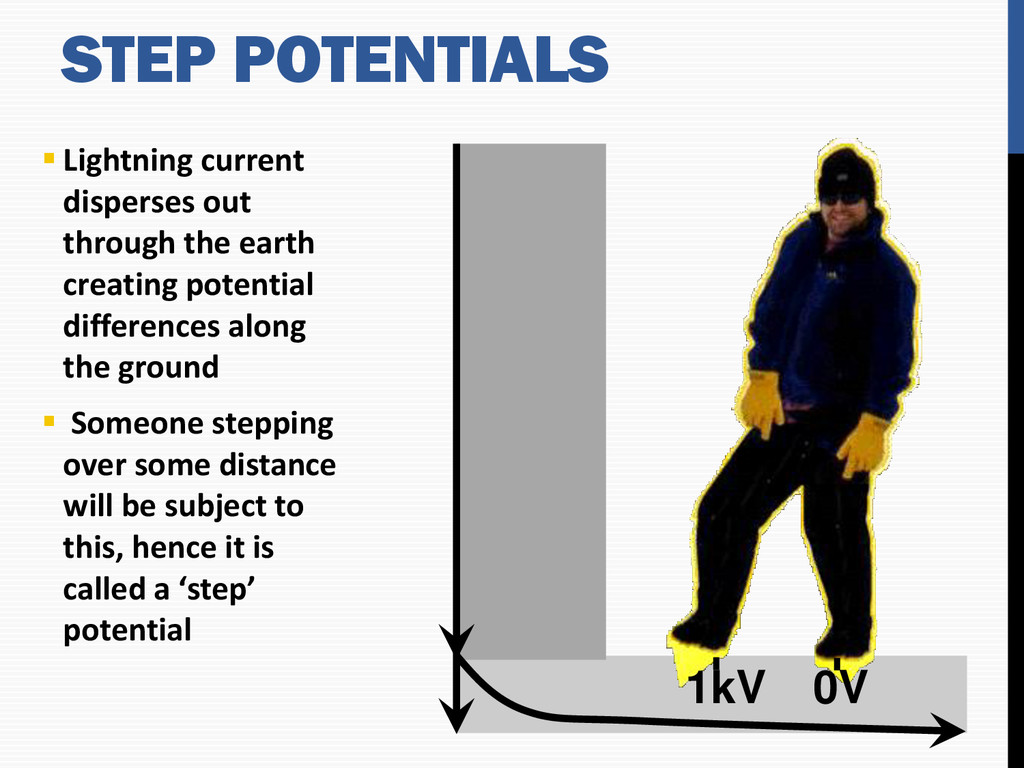
the earth creating potential differences along the ground Someone stepping over some distance will be subject to this, hence it is called a ‘step’ potential STEP POTENTIALS
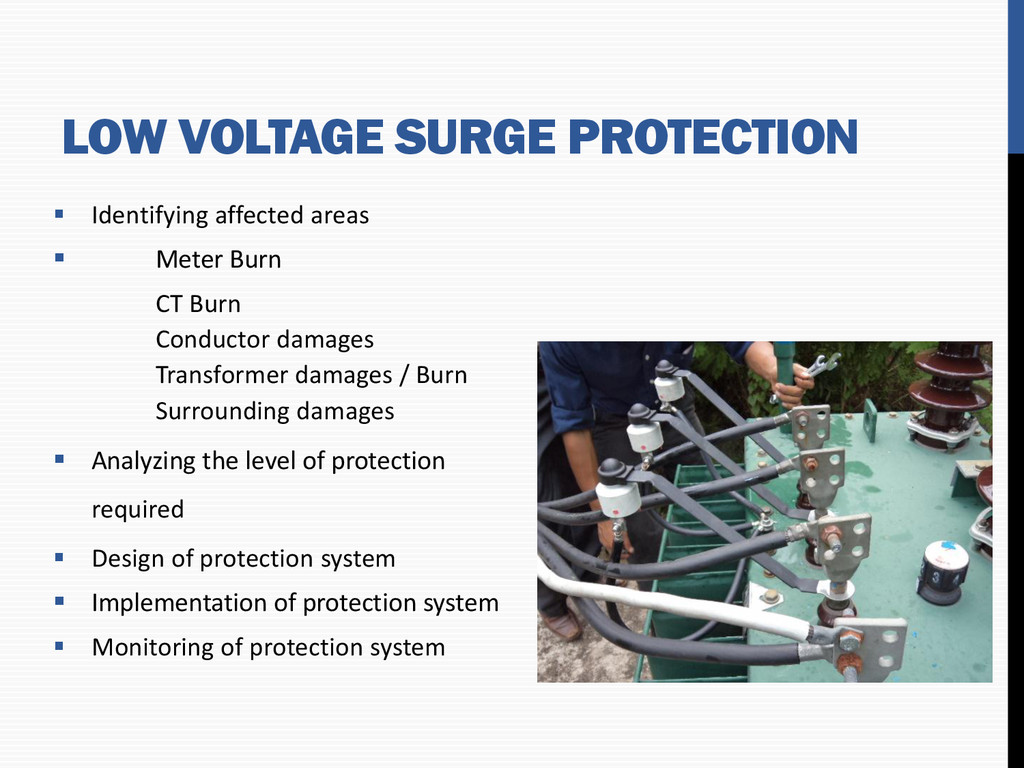
Burn CT Burn Conductor damages Transformer damages / Burn Surrounding damages Analyzing the level of protection required Design of protection system Implementation of protection system Monitoring of protection system
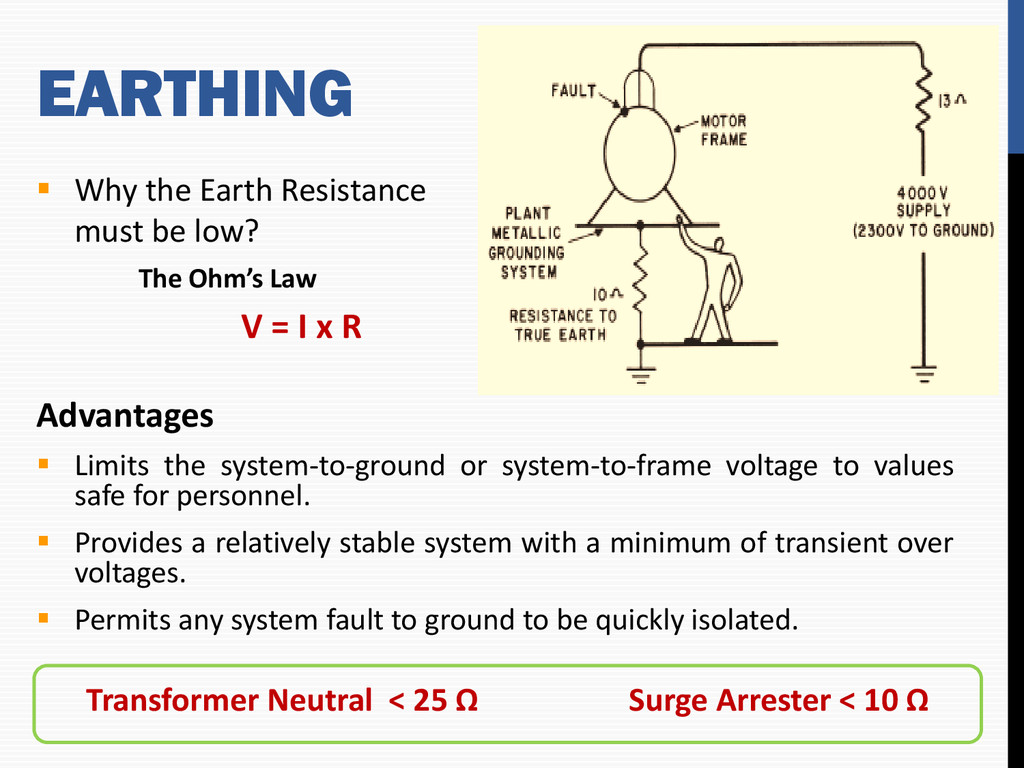
Ohm’s Law V = I x R Advantages Limits the system-to-ground or system-to-frame voltage to values safe for personnel. Provides a relatively stable system with a minimum of transient over voltages. Permits any system fault to ground to be quickly isolated. Transformer Neutral < 25 Ω Surge Arrester < 10 Ω
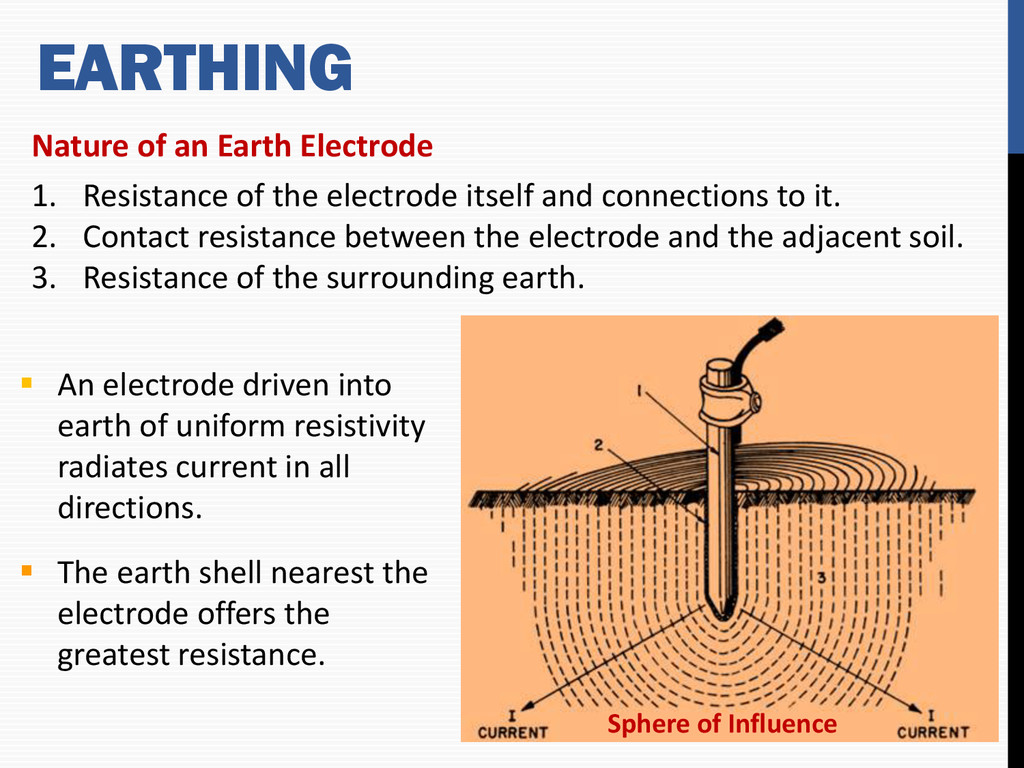
greatest resistance. An electrode driven into earth of uniform resistivity radiates current in all directions. Nature of an Earth Electrode 1. Resistance of the electrode itself and connections to it. 2. Contact resistance between the electrode and the adjacent soil. 3. Resistance of the surrounding earth. Sphere of Influence
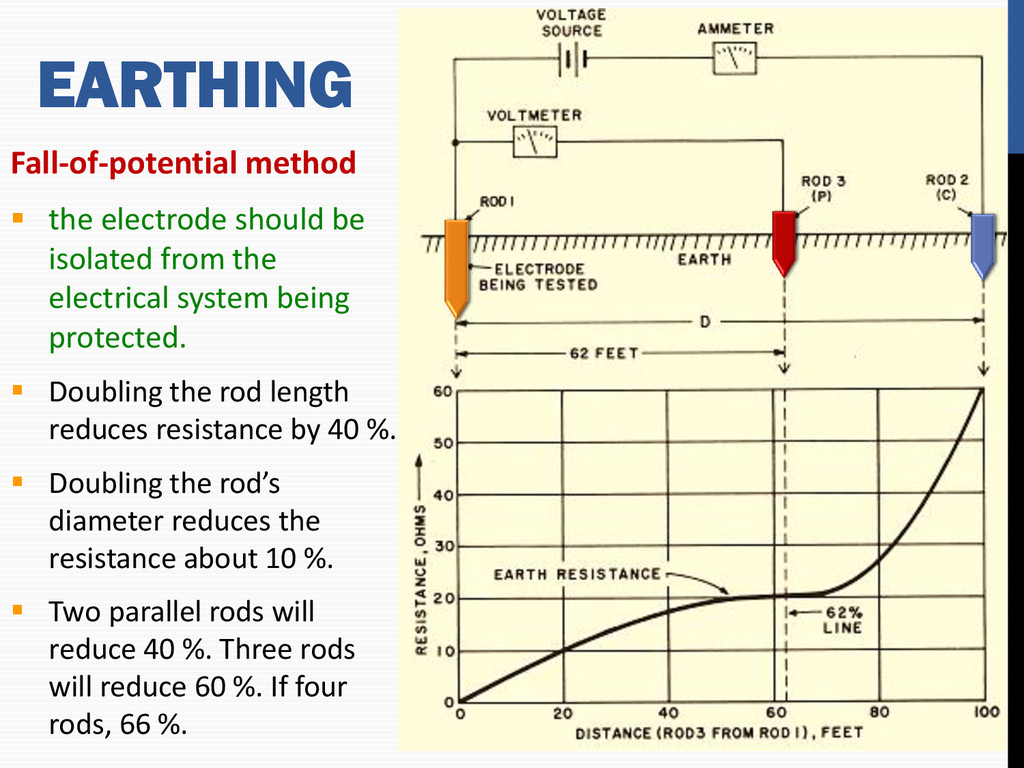
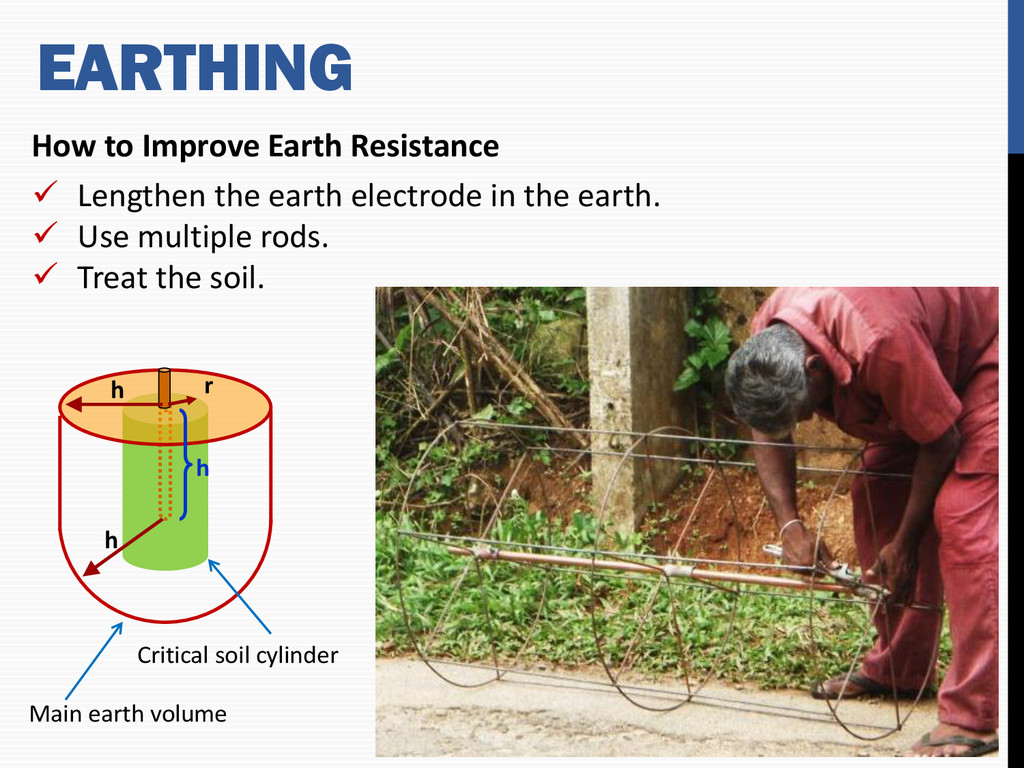
the electrical system being protected. Doubling the rod length reduces resistance by 40 %. Doubling the rod’s diameter reduces the resistance about 10 %. Two parallel rods will reduce 40 %. Three rods will reduce 60 %. If four rods, 66 %.
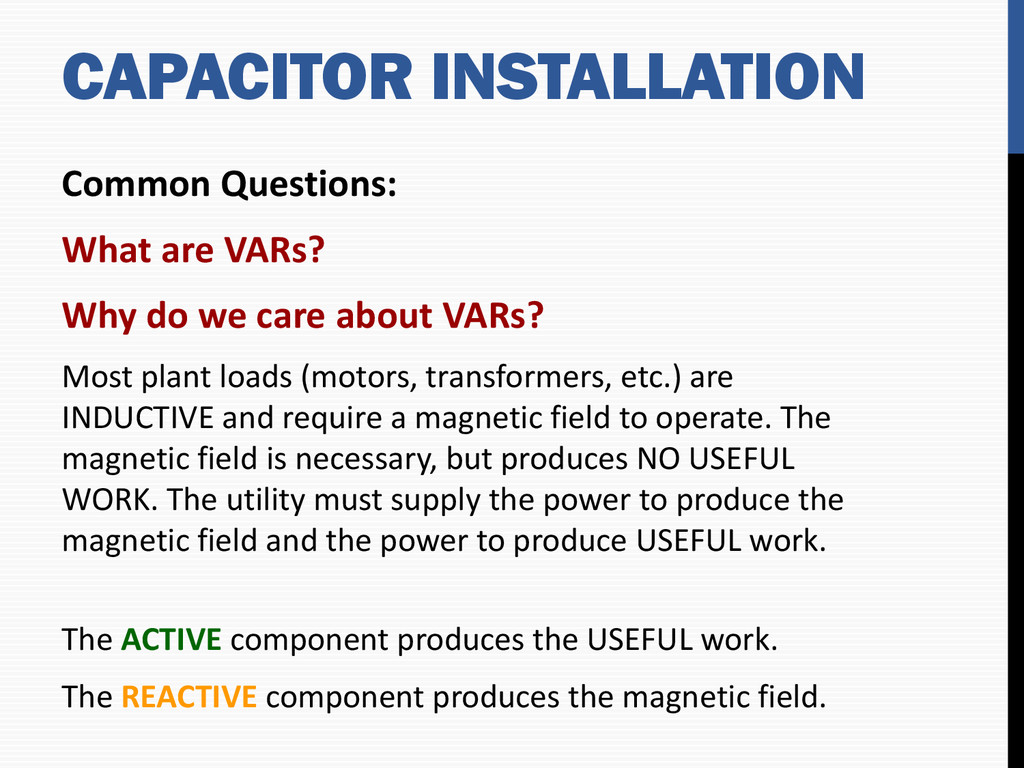
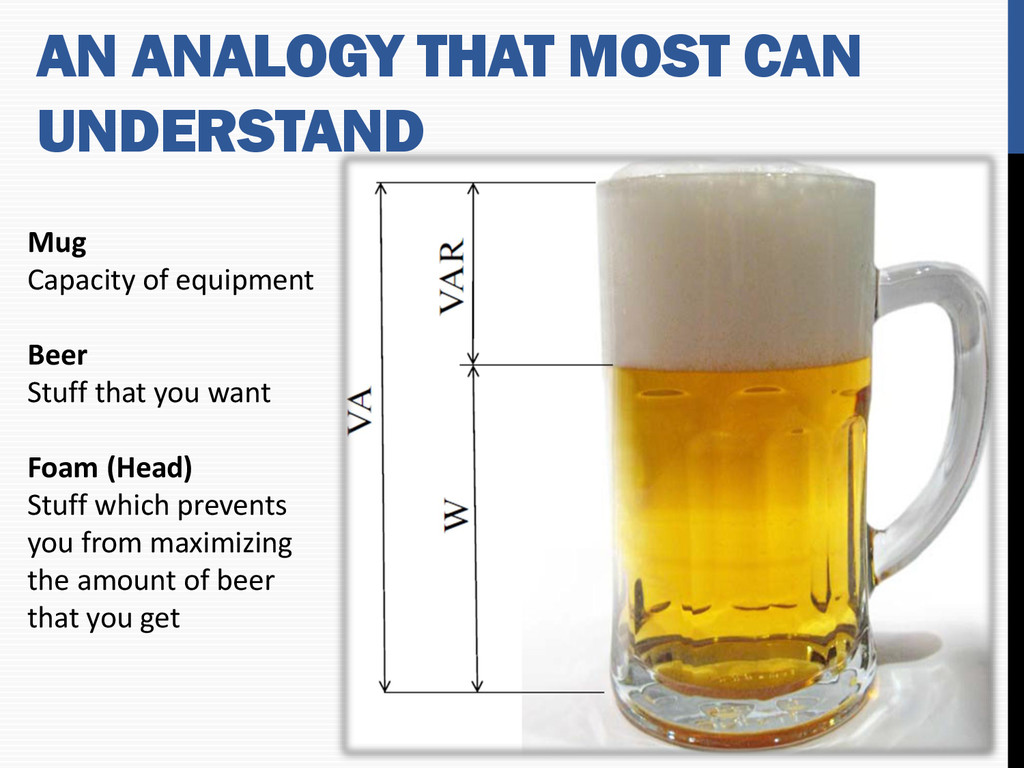
care about VARs? Most plant loads (motors, transformers, etc.) are INDUCTIVE and require a magnetic field to operate. The magnetic field is necessary, but produces NO USEFUL WORK. The utility must supply the power to produce the magnetic field and the power to produce USEFUL work. The ACTIVE component produces the USEFUL work. The REACTIVE component produces the magnetic field.
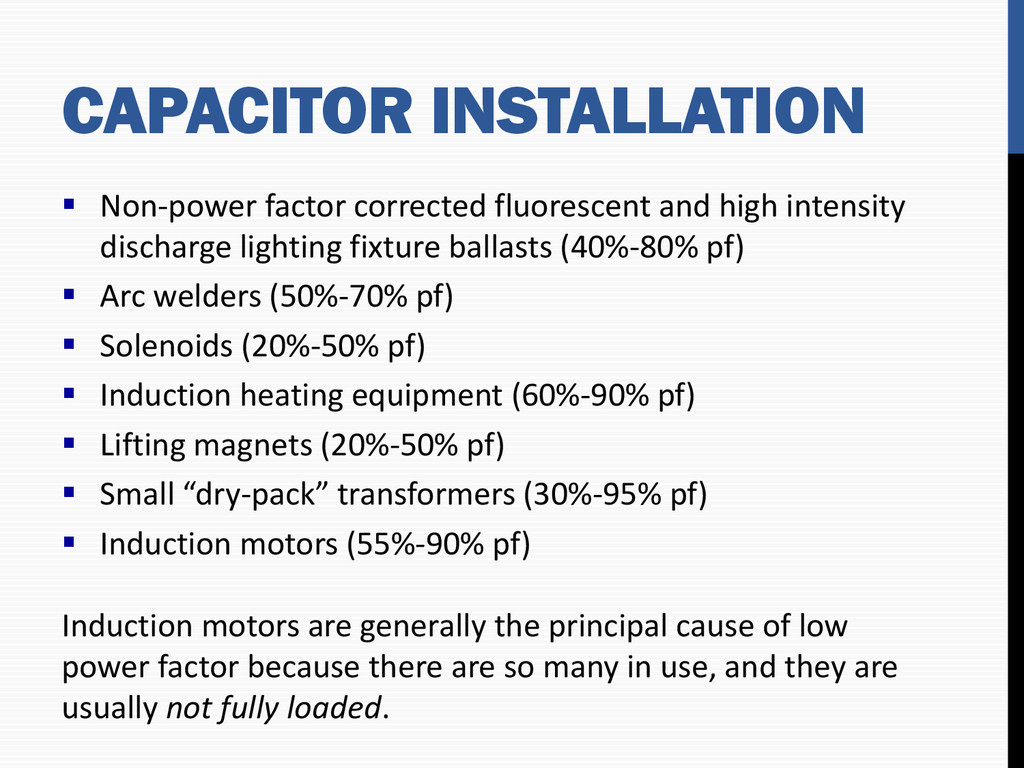
fixture ballasts (40%-80% pf) Arc welders (50%-70% pf) Solenoids (20%-50% pf) Induction heating equipment (60%-90% pf) Lifting magnets (20%-50% pf) Small “dry-pack” transformers (30%-95% pf) Induction motors (55%-90% pf) Induction motors are generally the principal cause of low power factor because there are so many in use, and they are usually not fully loaded. CAPACITOR INSTALLATION
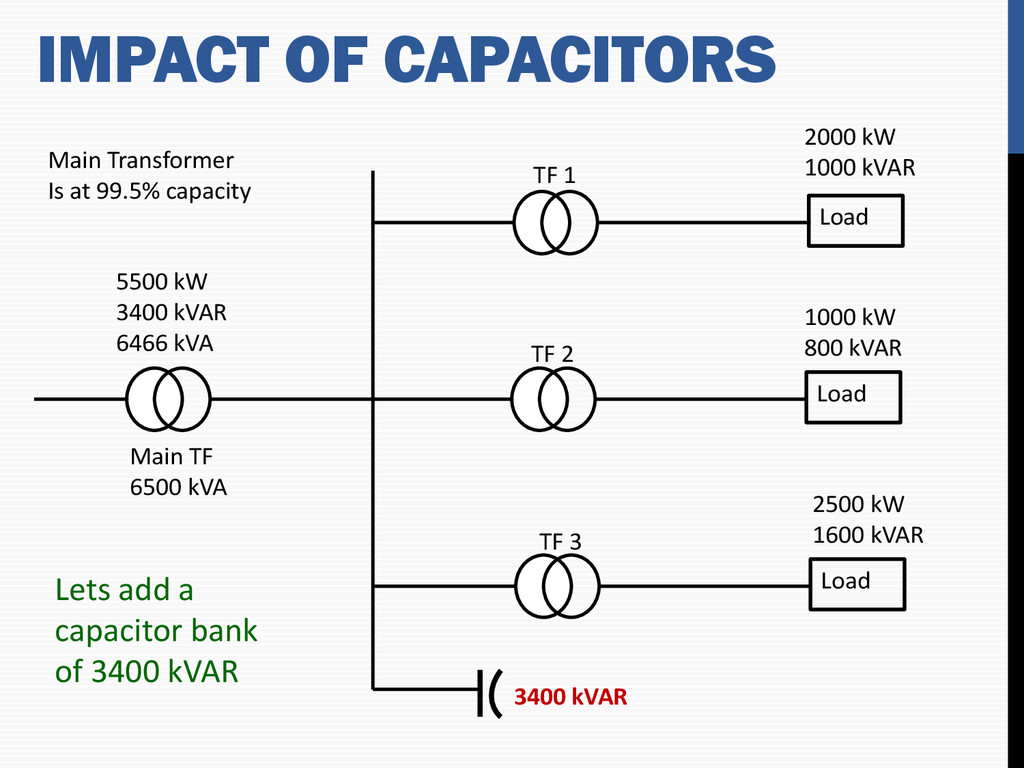
1000 kW 800 kVAR 2500 kW 1600 kVAR 5500 kW 3400 kVAR 6466 kVA TF 1 TF 2 TF 3 Main TF 6500 kVA Main Transformer Is at 99.5% capacity Lets add a capacitor bank of 3400 kVAR 3400 kVAR
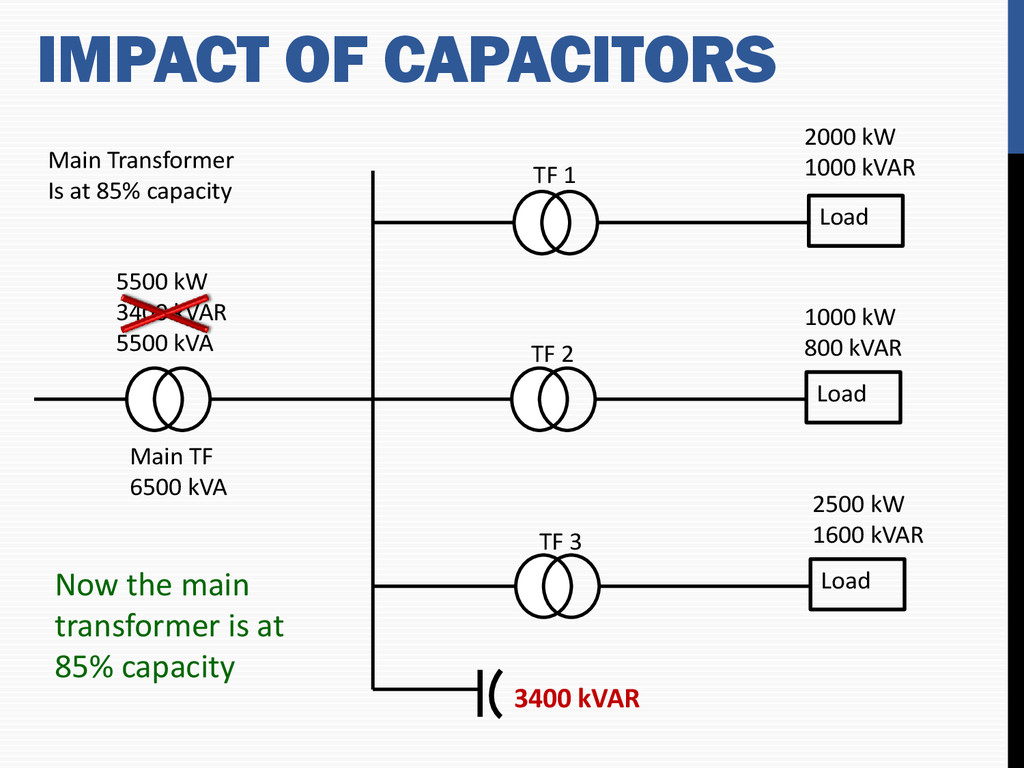
1000 kW 800 kVAR 2500 kW 1600 kVAR 5500 kW 3400 kVAR 5500 kVA TF 1 TF 2 TF 3 Main TF 6500 kVA Main Transformer Is at 85% capacity Now the main transformer is at 85% capacity 3400 kVAR
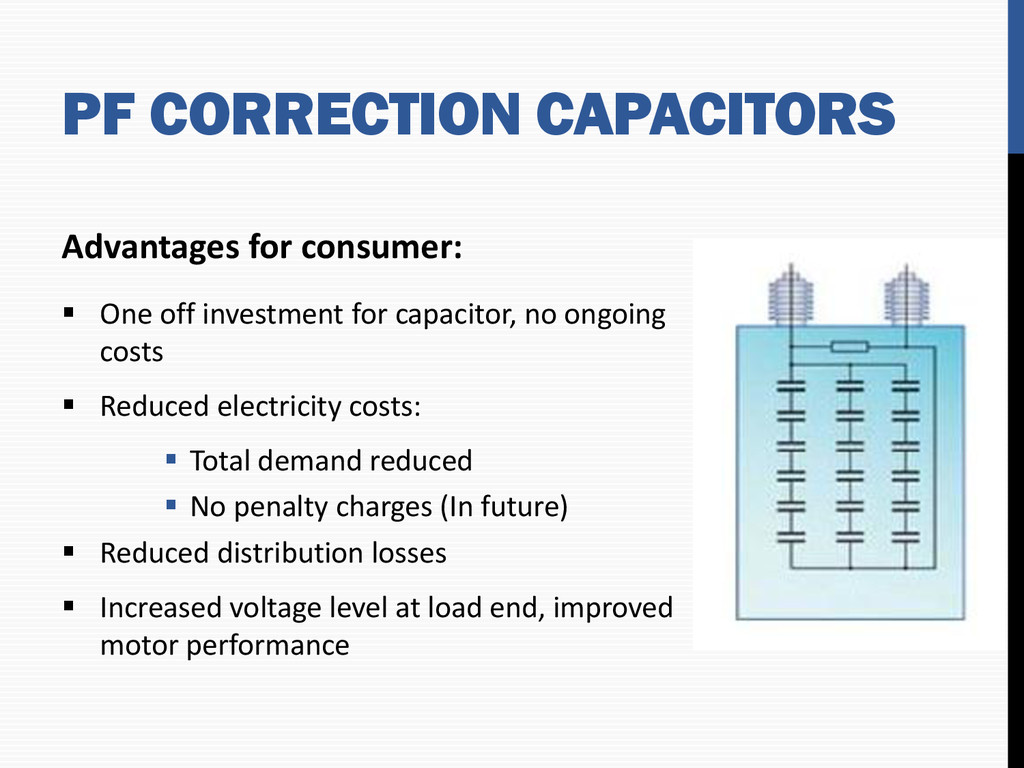
for capacitor, no ongoing costs Reduced electricity costs: Total demand reduced No penalty charges (In future) Reduced distribution losses Increased voltage level at load end, improved motor performance
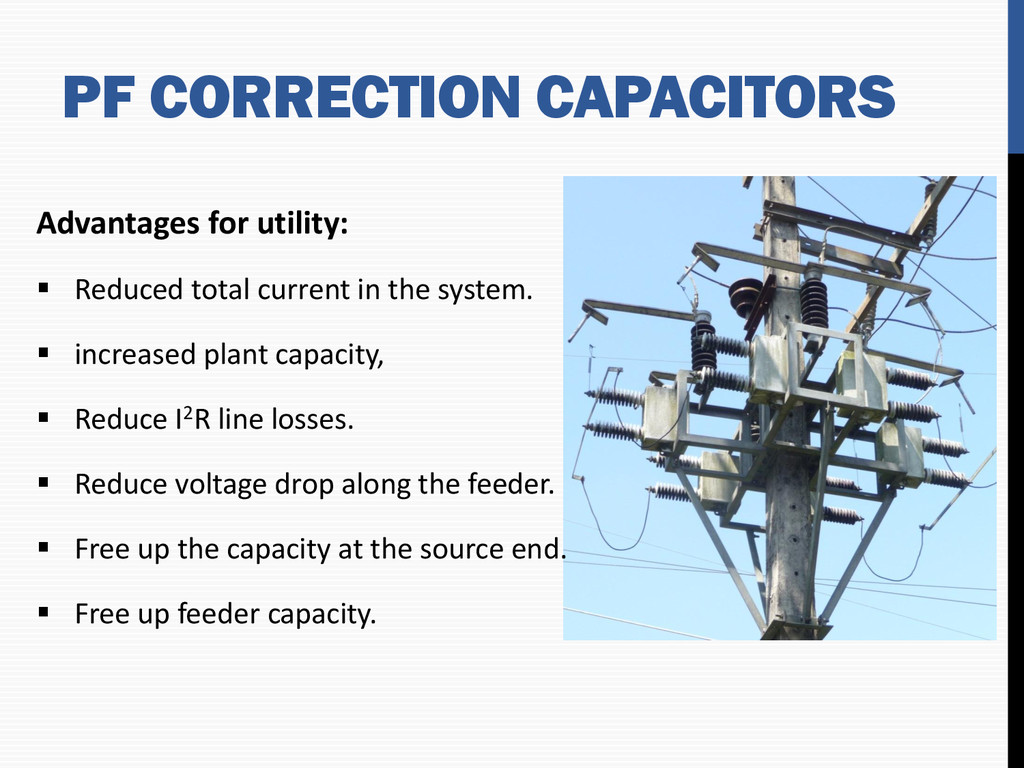
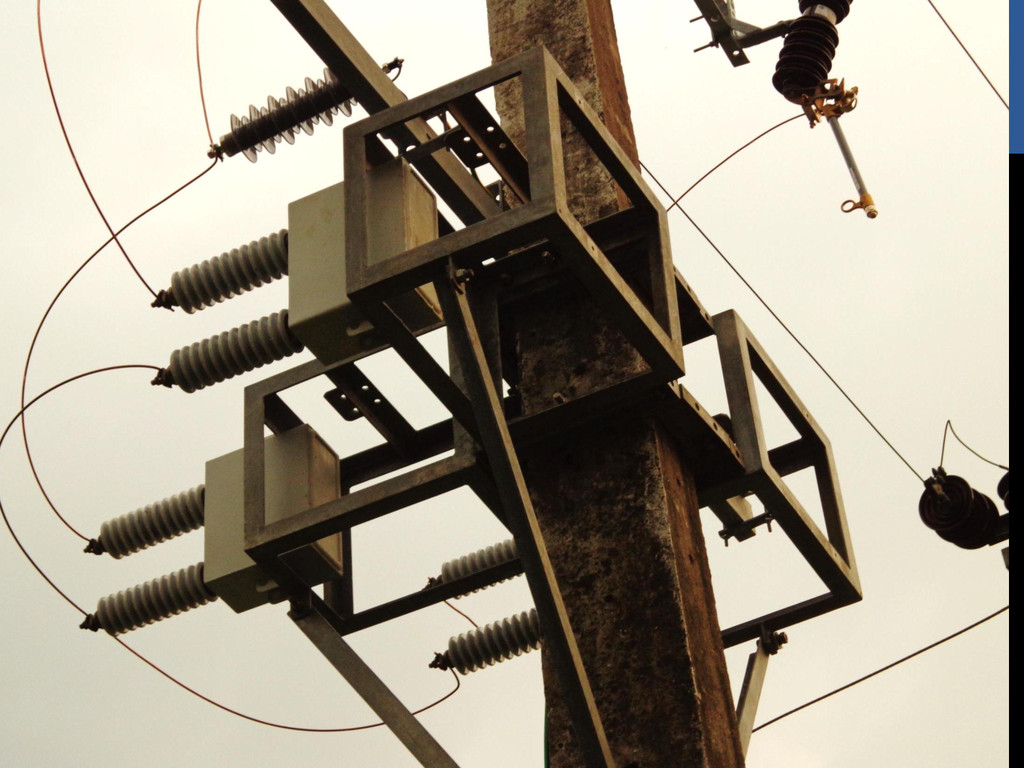
increased plant capacity, Reduce I2R line losses. Reduce voltage drop along the feeder. Free up the capacity at the source end. Free up feeder capacity. PF CORRECTION CAPACITORS
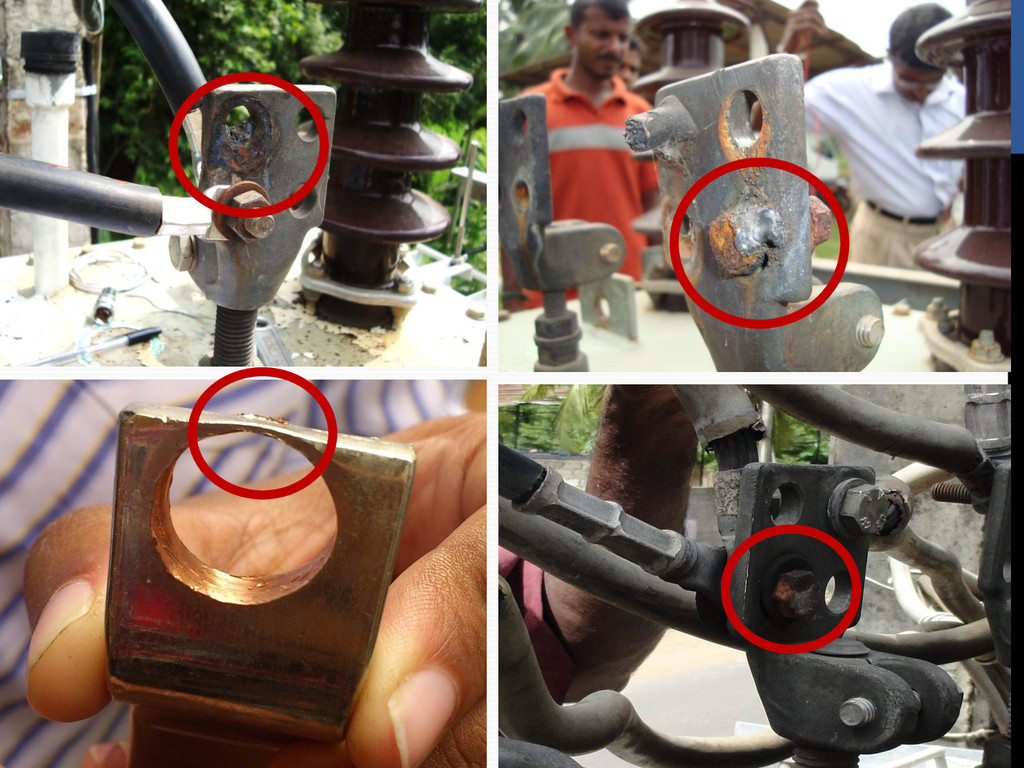
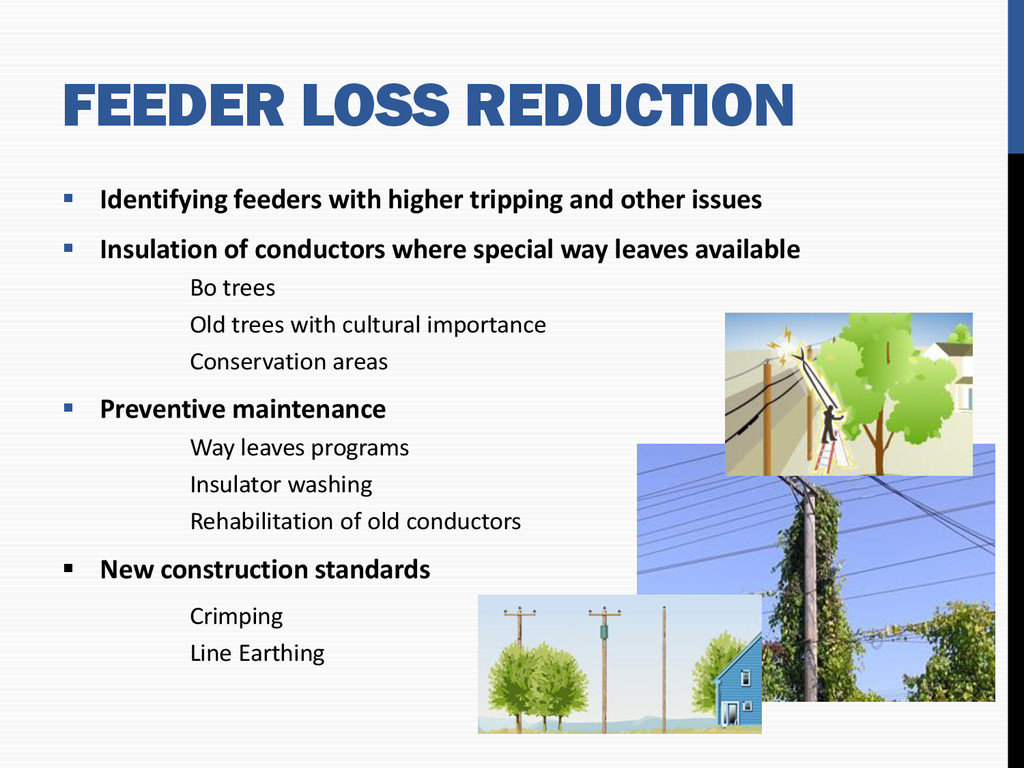
other issues Insulation of conductors where special way leaves available Bo trees Old trees with cultural importance Conservation areas Preventive maintenance Way leaves programs Insulator washing Rehabilitation of old conductors New construction standards Crimping Line Earthing
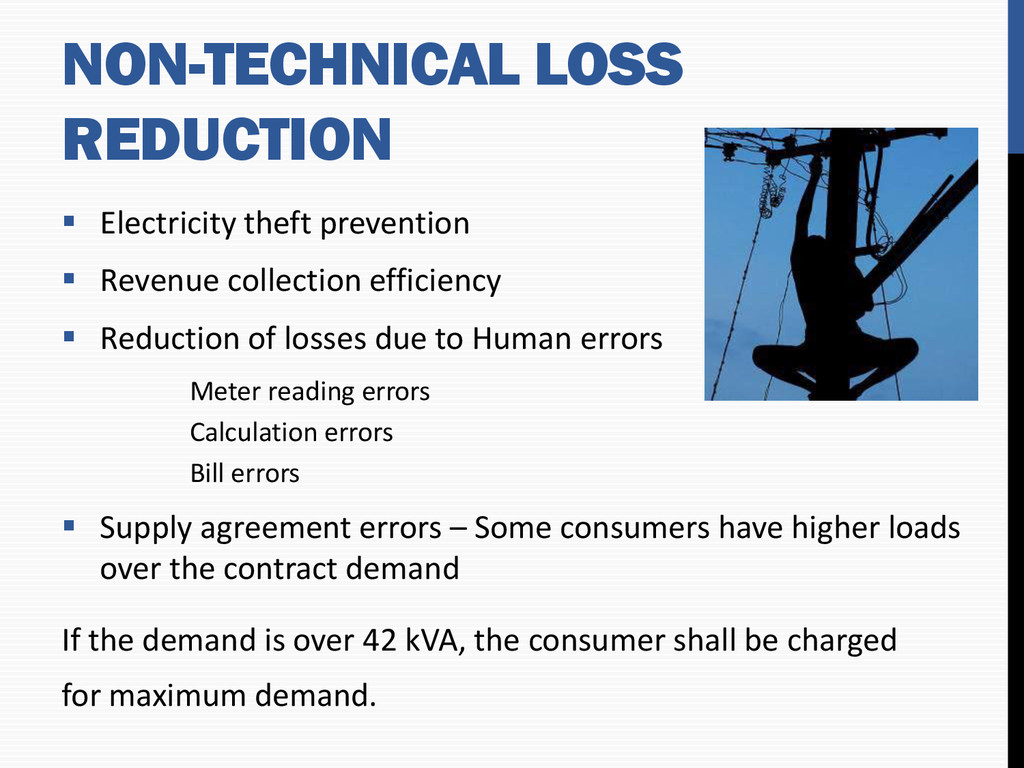
efficiency Reduction of losses due to Human errors Meter reading errors Calculation errors Bill errors Supply agreement errors – Some consumers have higher loads over the contract demand If the demand is over 42 kVA, the consumer shall be charged for maximum demand.
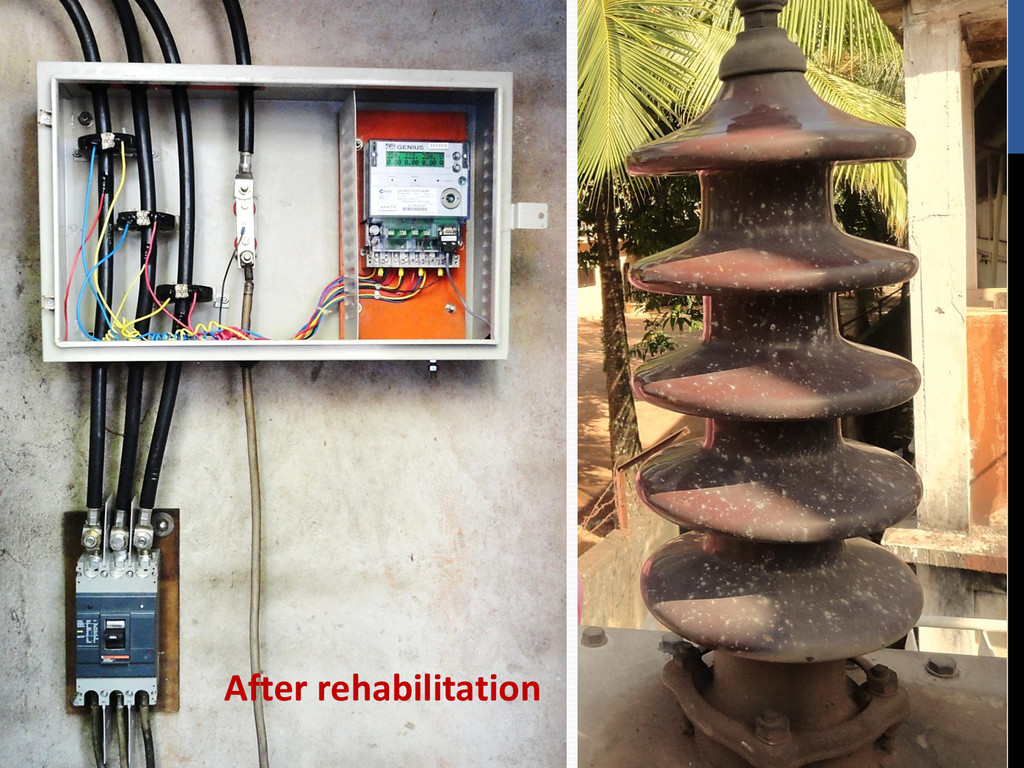
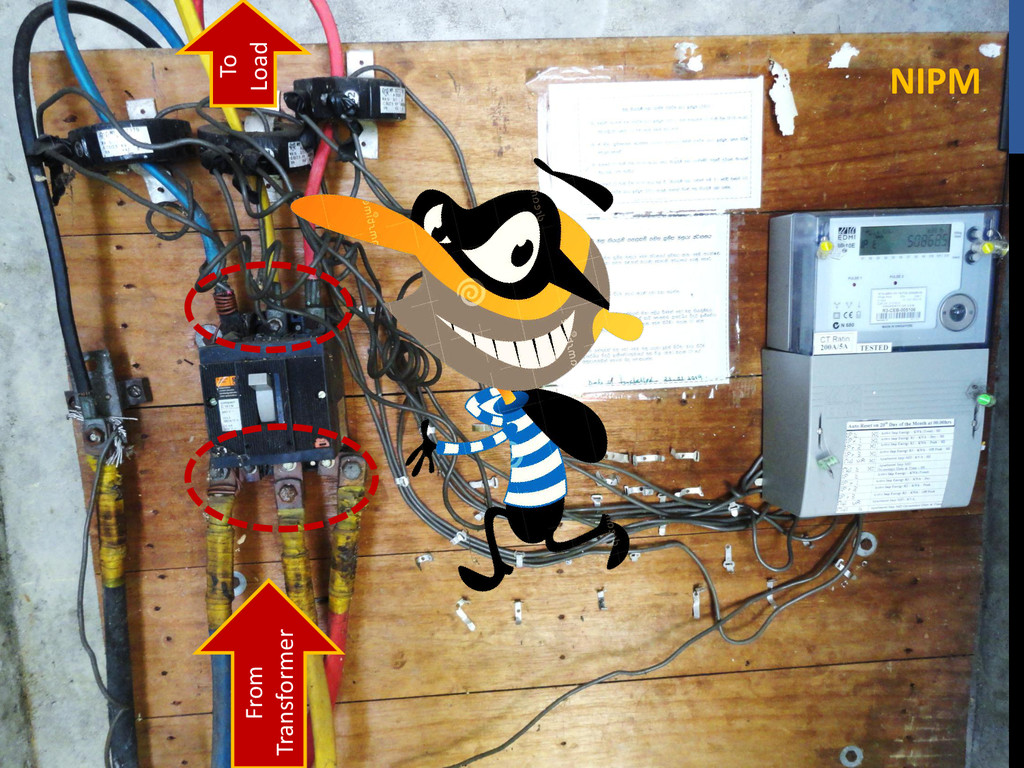
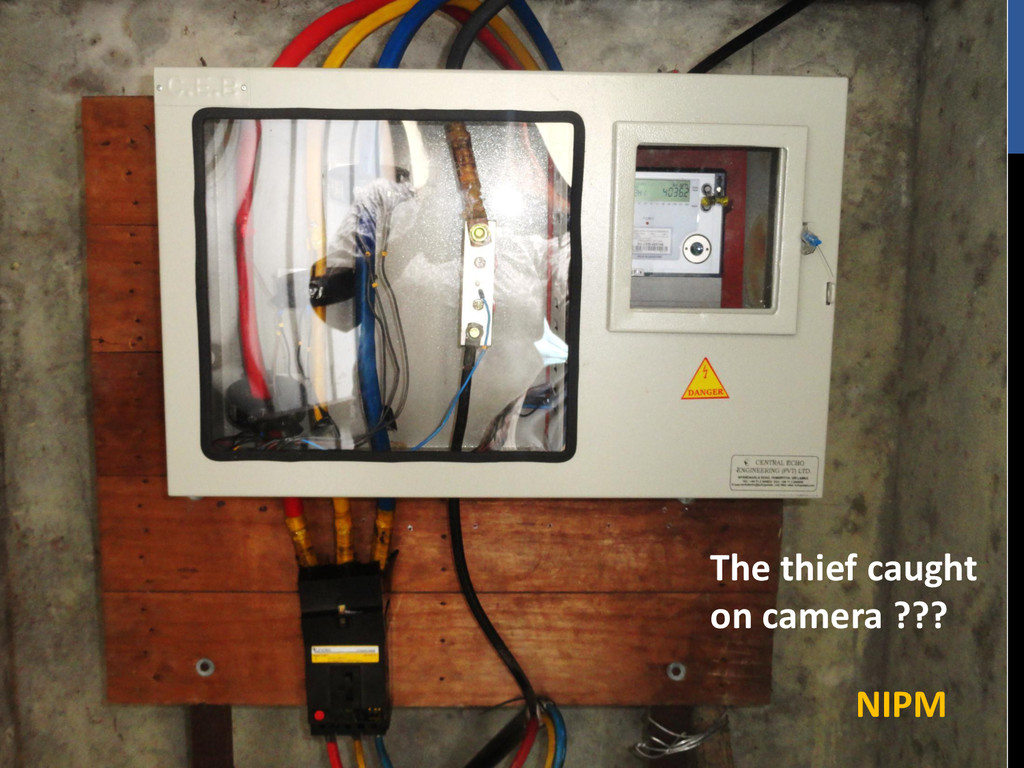
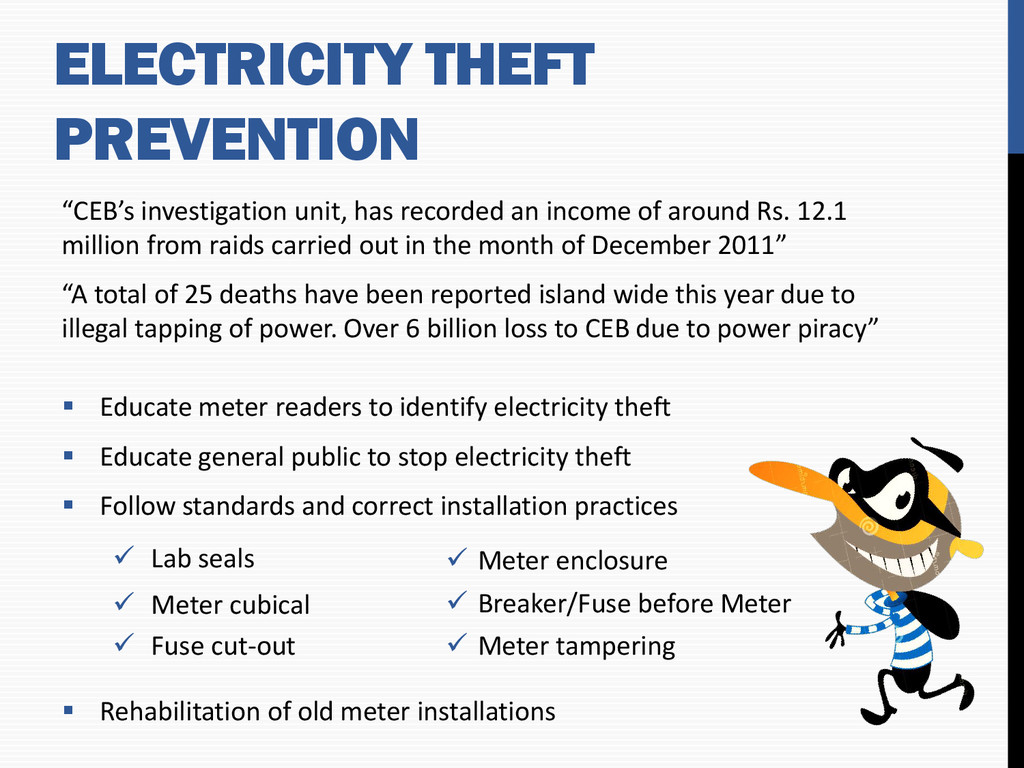
of around Rs. 12.1 million from raids carried out in the month of December 2011” “A total of 25 deaths have been reported island wide this year due to illegal tapping of power. Over 6 billion loss to CEB due to power piracy” Educate meter readers to identify electricity theft Educate general public to stop electricity theft Follow standards and correct installation practices Lab seals Meter cubical Fuse cut-out Rehabilitation of old meter installations Meter enclosure Breaker/Fuse before Meter Meter tampering
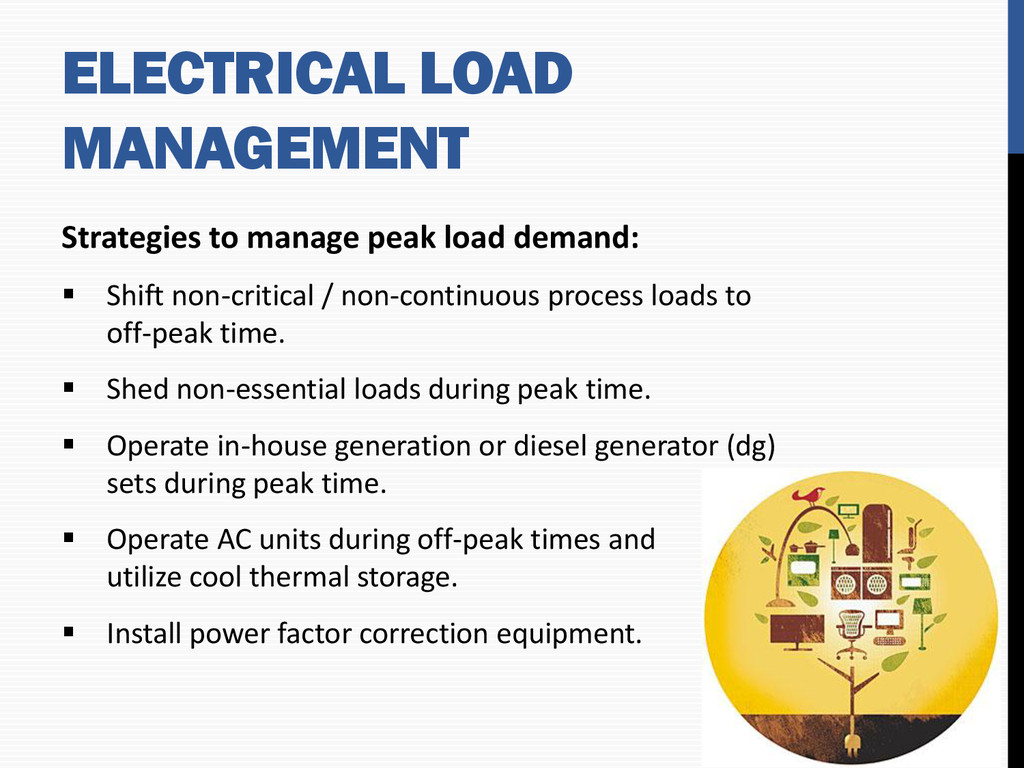
Shift non-critical / non-continuous process loads to off-peak time. Shed non-essential loads during peak time. Operate in-house generation or diesel generator (dg) sets during peak time. Operate AC units during off-peak times and utilize cool thermal storage. Install power factor correction equipment.
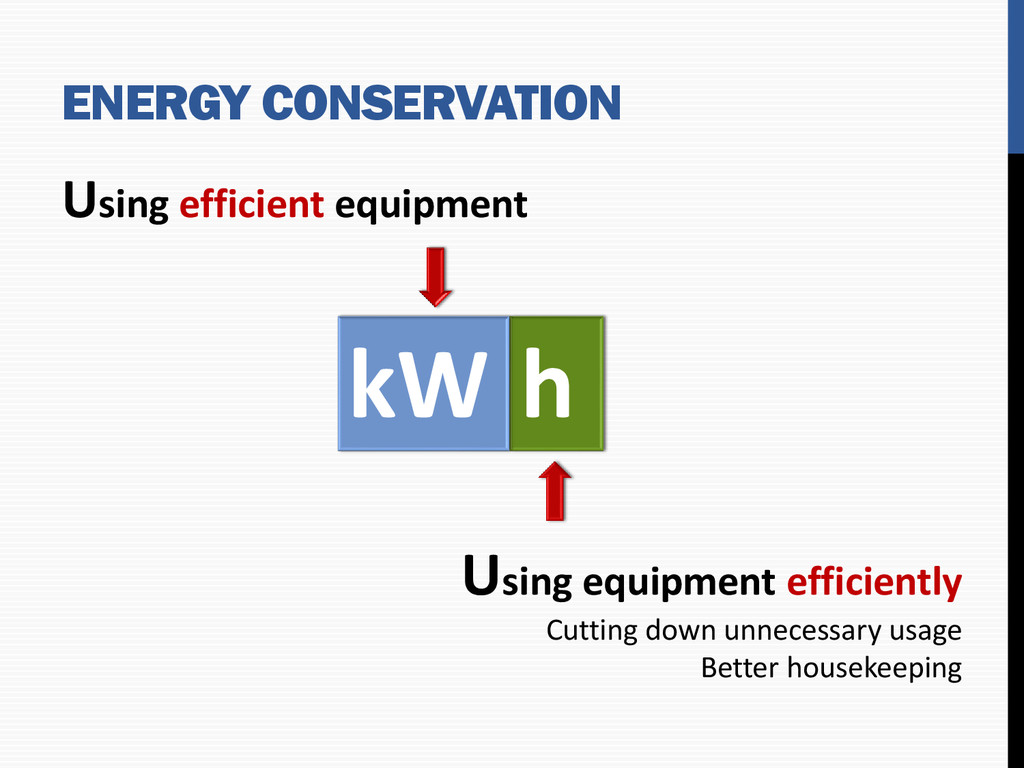
energy including submission of technical report containing recommendations for improving energy efficiency with cost benefit analysis and action plan to reduce energy consumption. Translation of conservation ideas into realities, by evolving technically feasible solutions with economic and other organizational considerations within a specified time.
Audit) Identify the energy consumption pattern in the organization Estimate the scope for saving Identify the most likely and the easiest areas for attention (e.g.- unnecessary lighting, higher temperature setting, leakages) Identify immediate (especially no-/low-cost) improvements/ savings Identify areas for more detailed study/measurement Preliminary energy audit uses existing, or easily obtained data
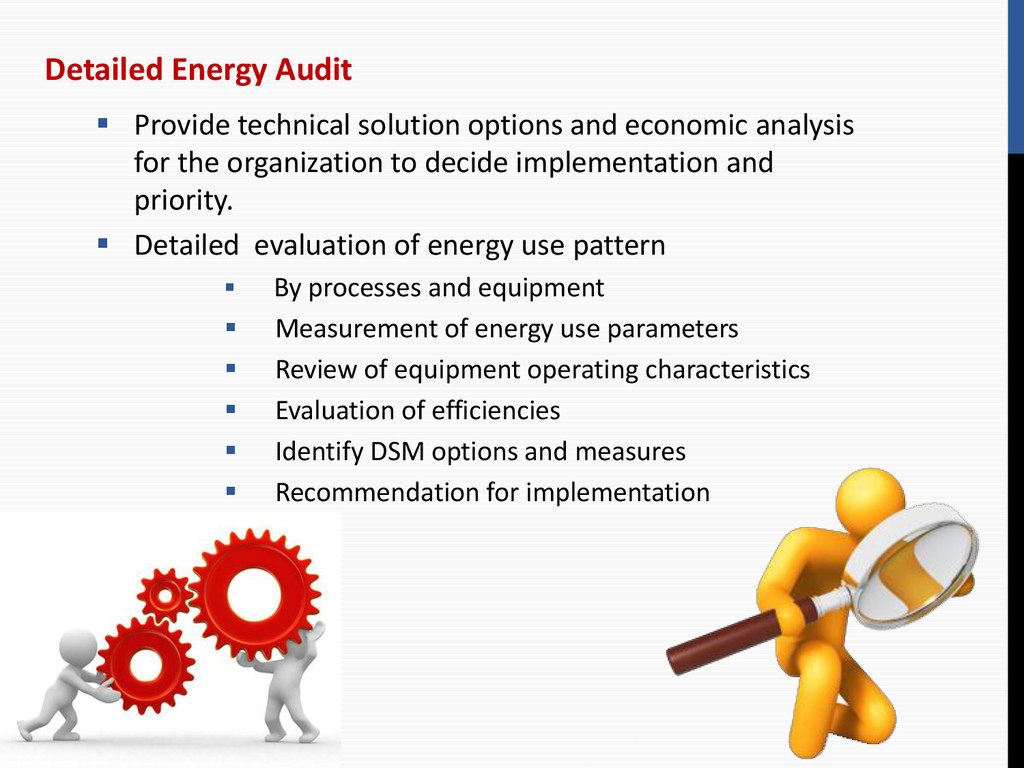
analysis for the organization to decide implementation and priority. Detailed evaluation of energy use pattern By processes and equipment Measurement of energy use parameters Review of equipment operating characteristics Evaluation of efficiencies Identify DSM options and measures Recommendation for implementation
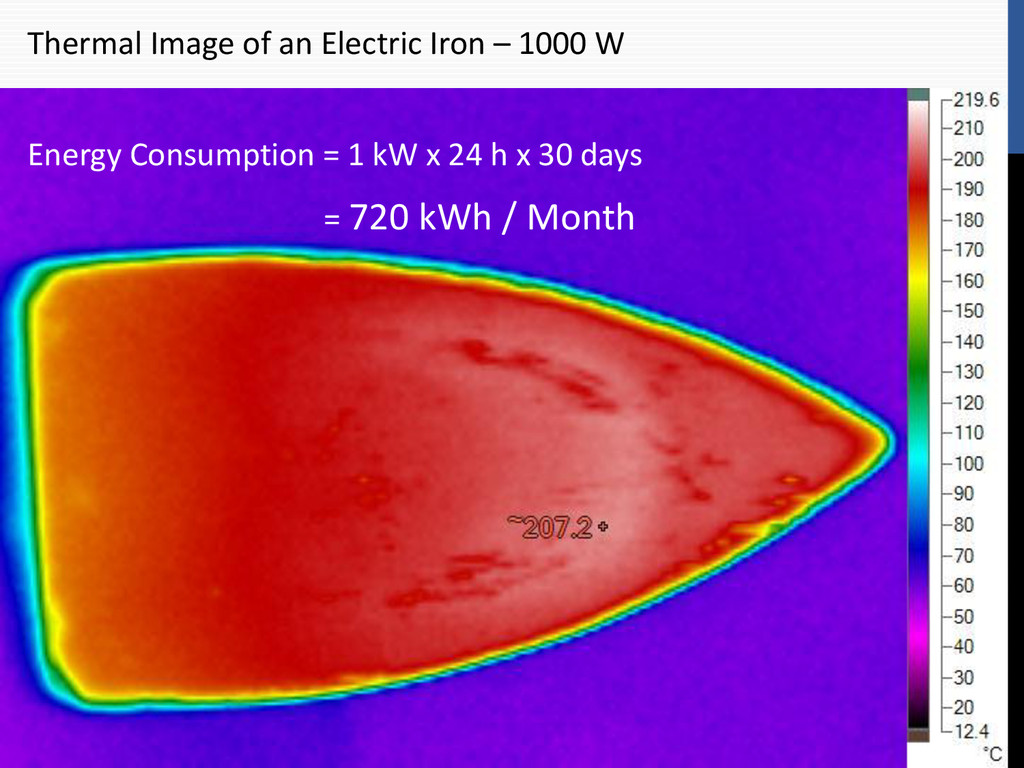
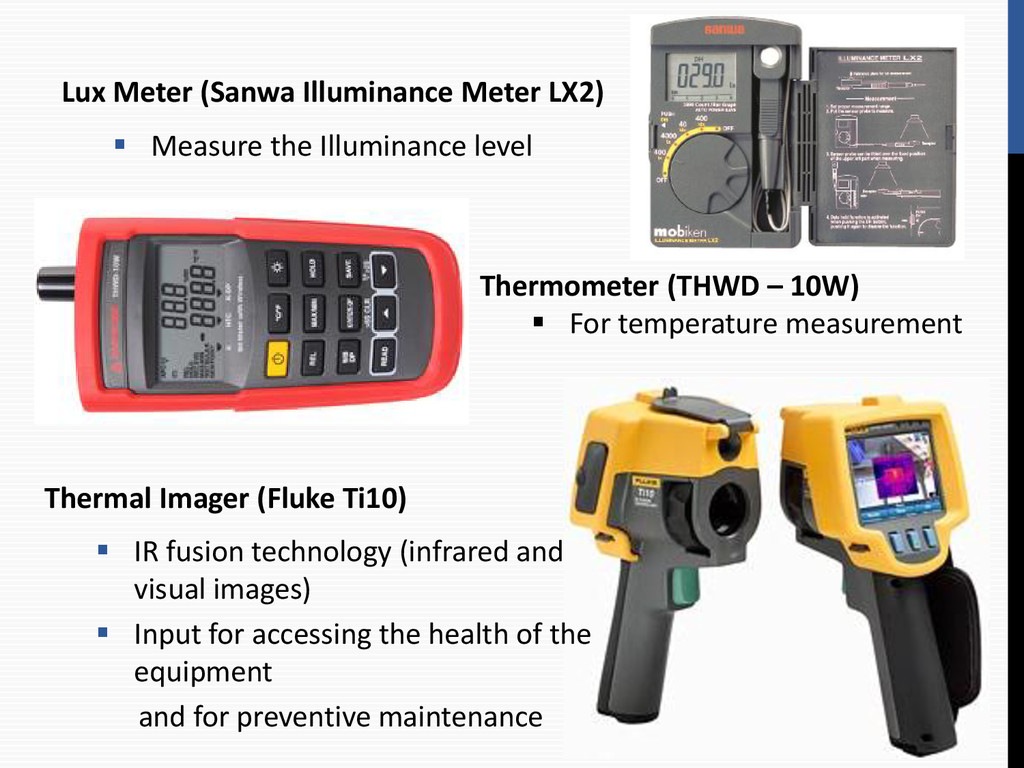
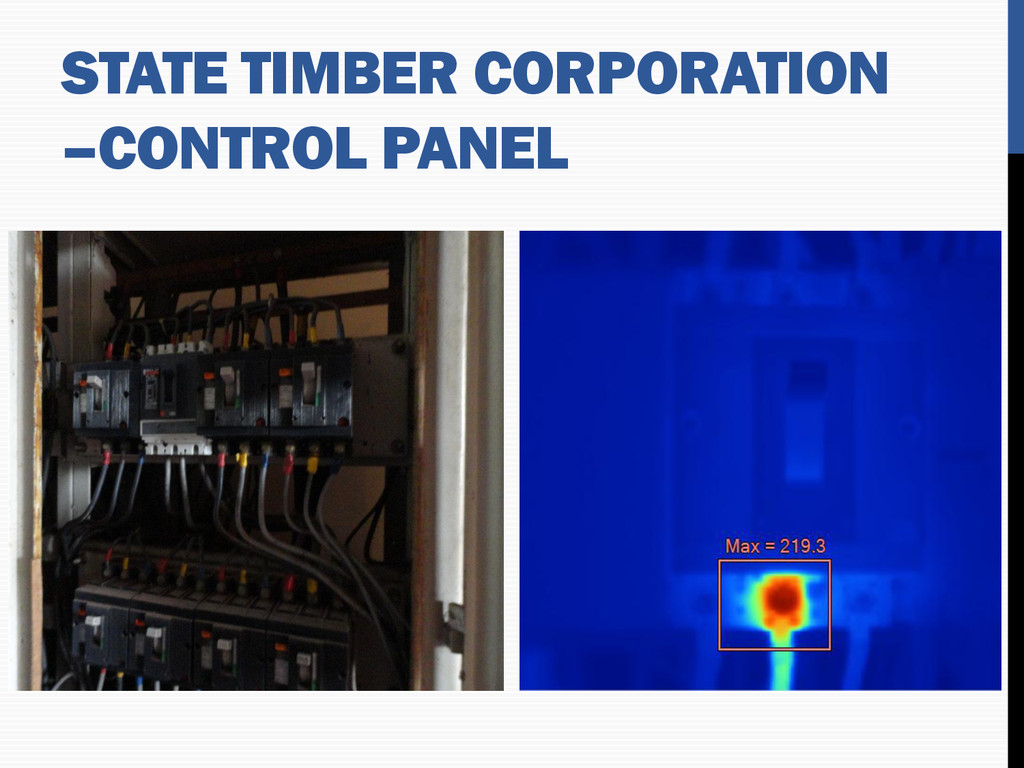
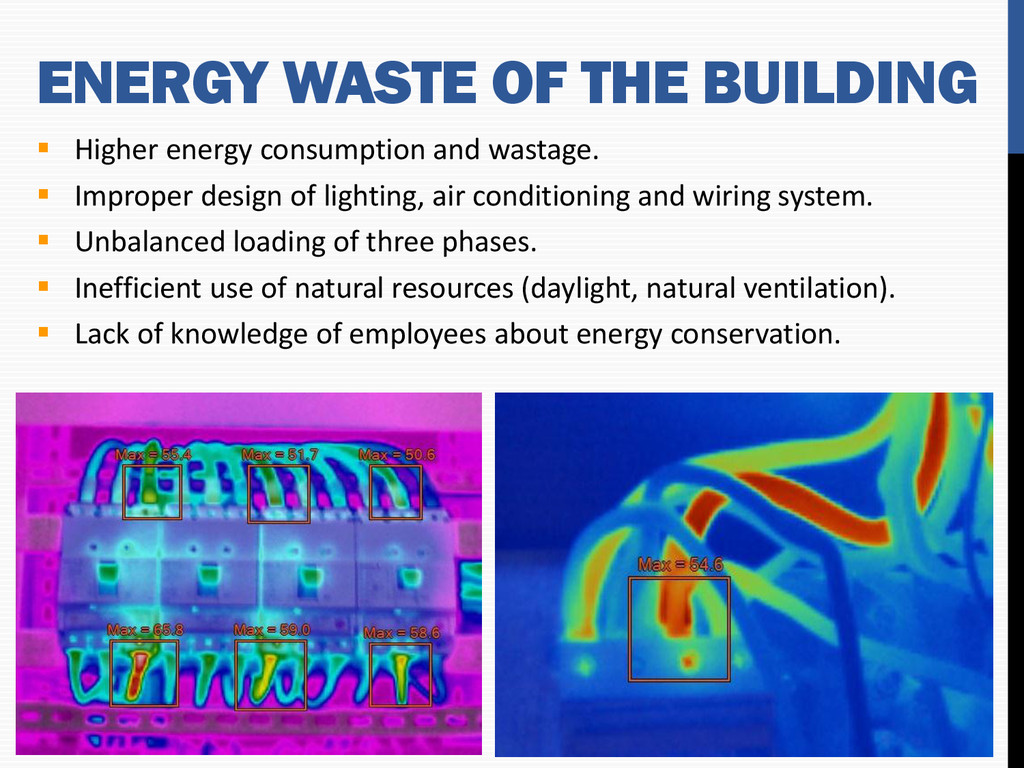
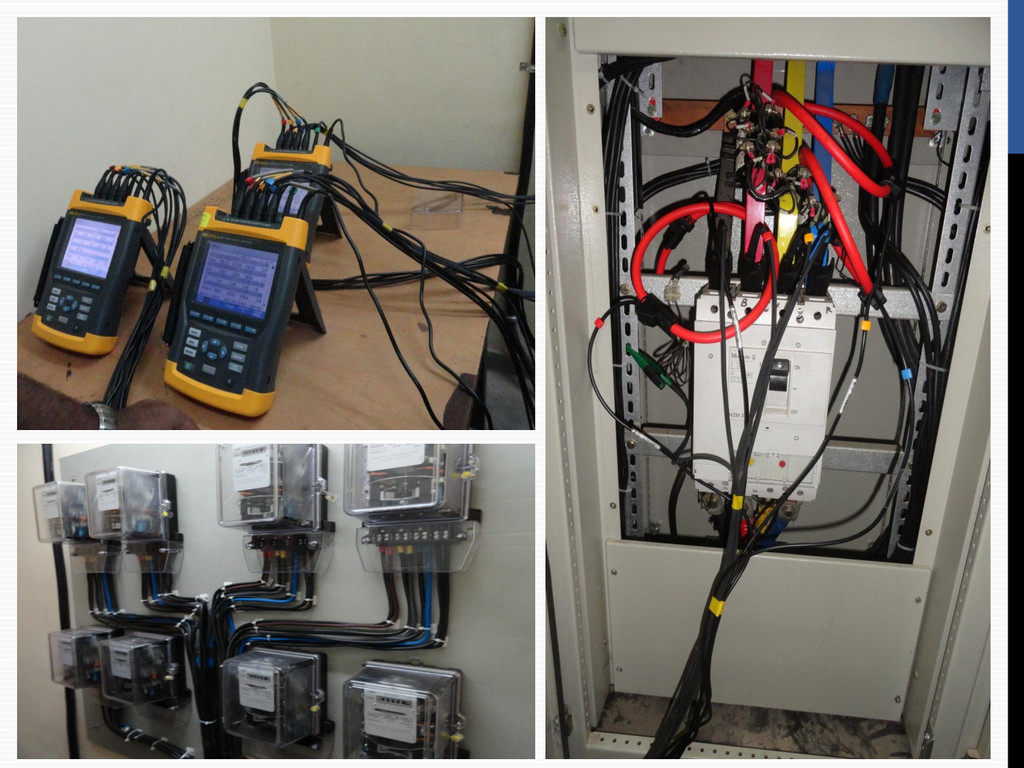
level Thermometer (THWD – 10W) For temperature measurement Thermal Imager (Fluke Ti10) IR fusion technology (infrared and visual images) Input for accessing the health of the equipment and for preventive maintenance
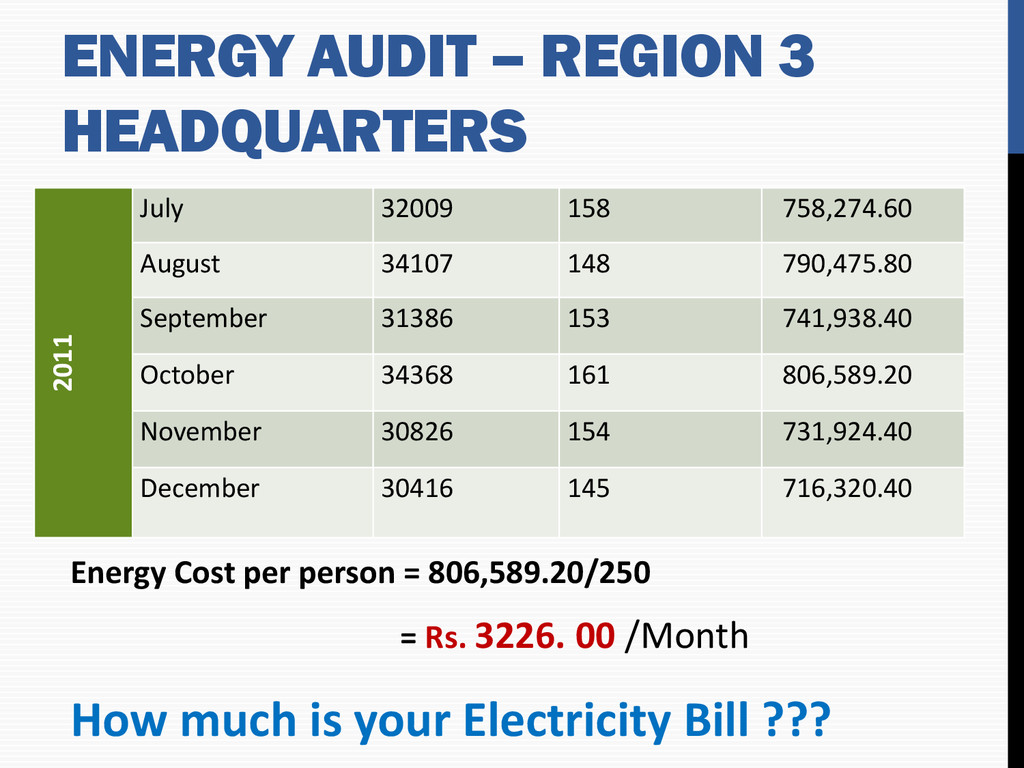
= 806,589.20/250 = Rs. 3226. 00 /Month 2011 July 32009 158 758,274.60 August 34107 148 790,475.80 September 31386 153 741,938.40 October 34368 161 806,589.20 November 30826 154 731,924.40 December 30416 145 716,320.40 How much is your Electricity Bill ???
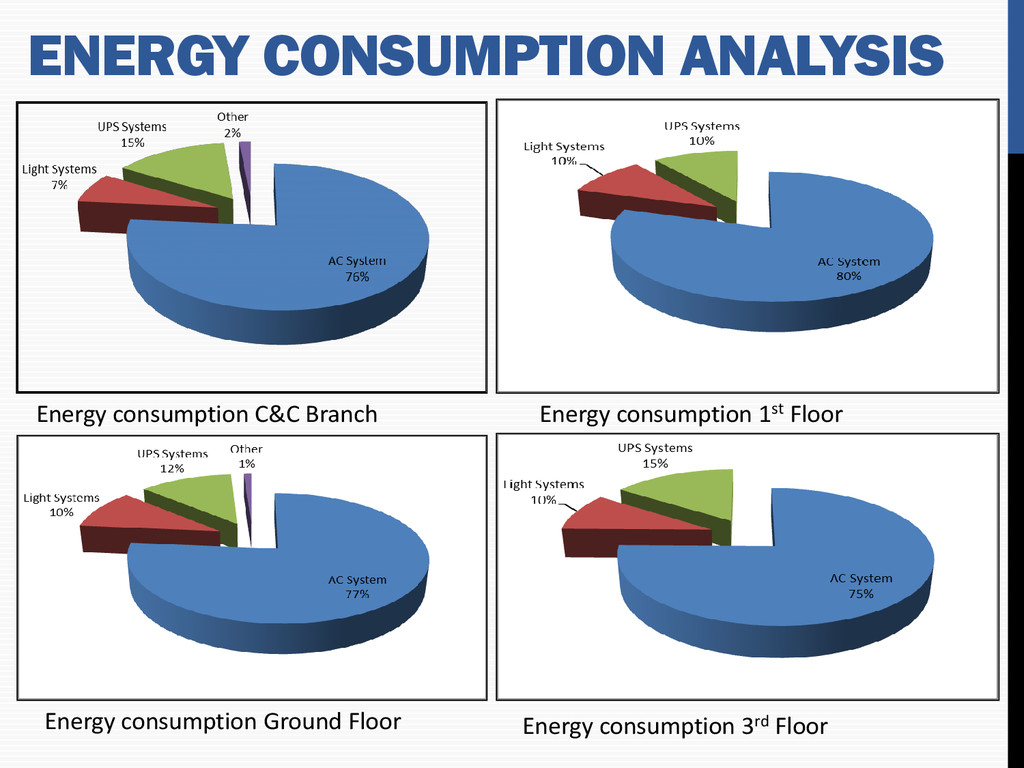
wastage. Improper design of lighting, air conditioning and wiring system. Unbalanced loading of three phases. Inefficient use of natural resources (daylight, natural ventilation). Lack of knowledge of employees about energy conservation.
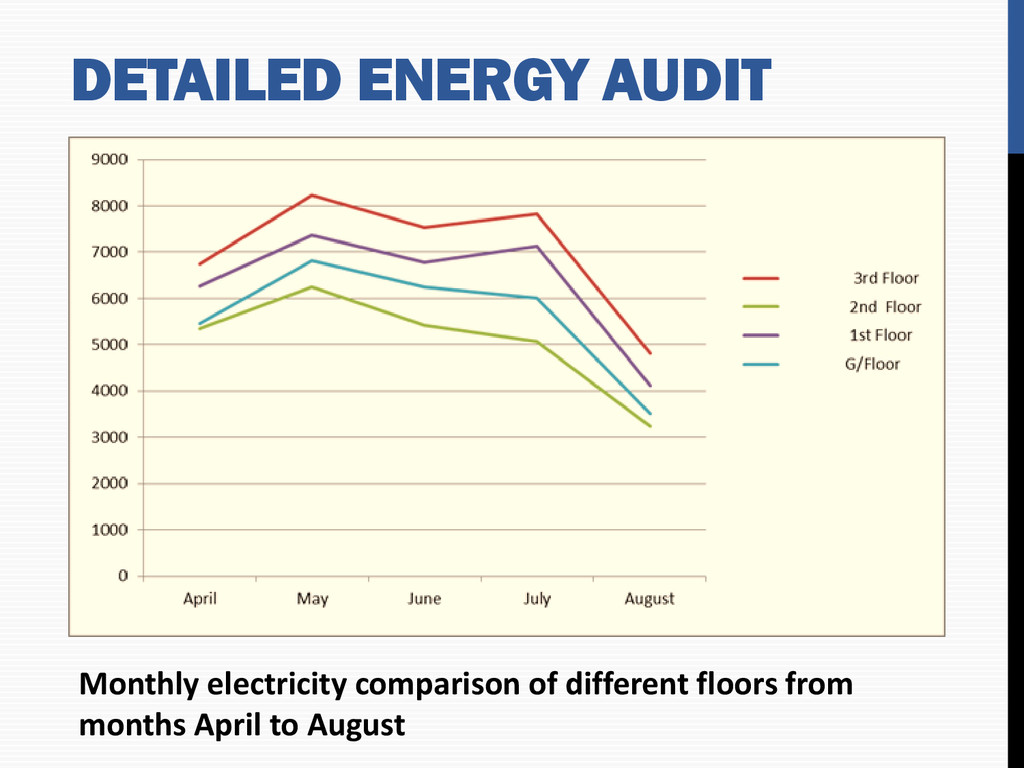
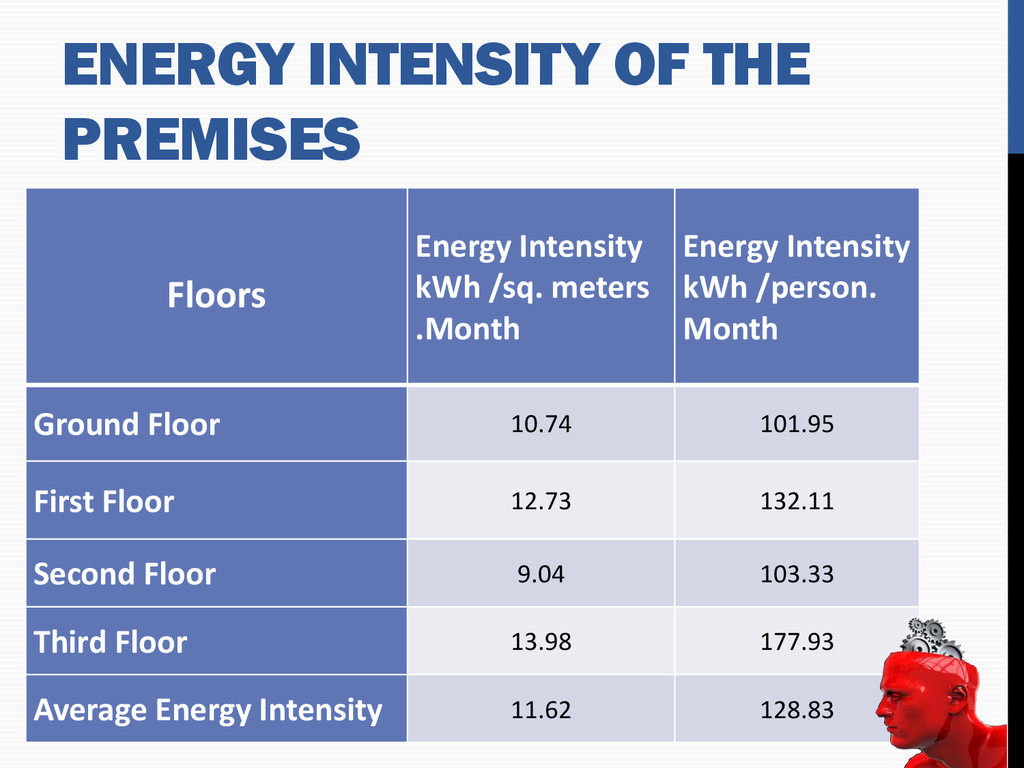
meters .Month Energy Intensity kWh /person. Month Ground Floor 10.74 101.95 First Floor 12.73 132.11 Second Floor 9.04 103.33 Third Floor 13.98 177.93 Average Energy Intensity 11.62 128.83
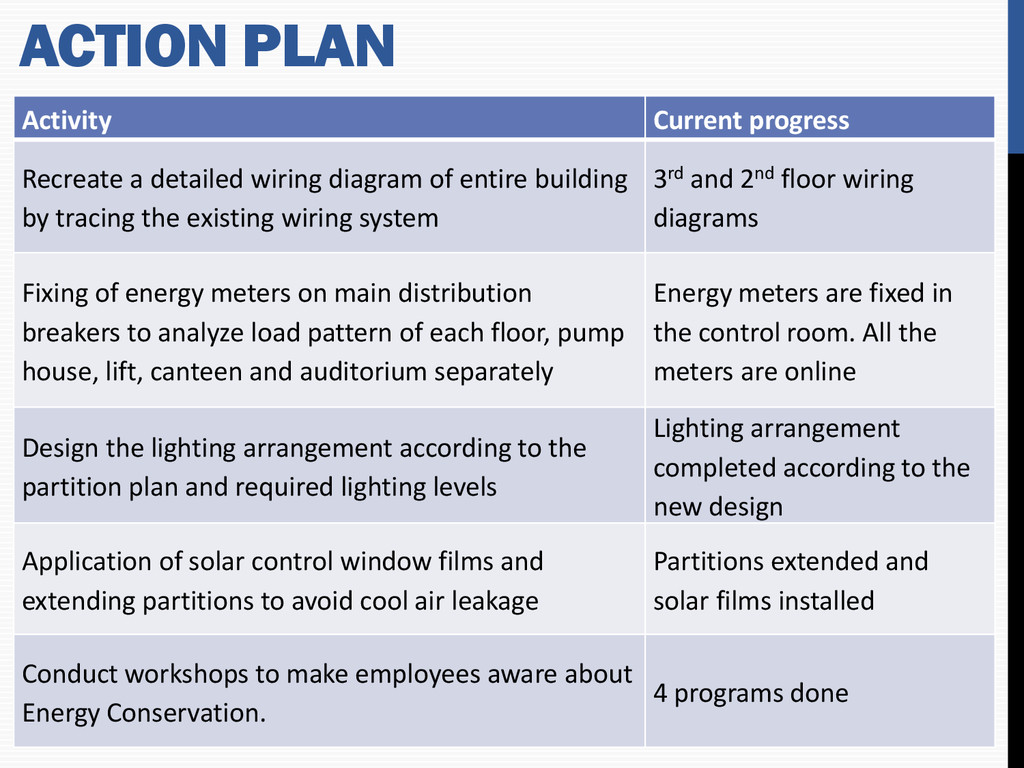
building by tracing the existing wiring system 3rd and 2nd floor wiring diagrams Fixing of energy meters on main distribution breakers to analyze load pattern of each floor, pump house, lift, canteen and auditorium separately Energy meters are fixed in the control room. All the meters are online Design the lighting arrangement according to the partition plan and required lighting levels Lighting arrangement completed according to the new design Application of solar control window films and extending partitions to avoid cool air leakage Partitions extended and solar films installed Conduct workshops to make employees aware about Energy Conservation. 4 programs done ACTION PLAN
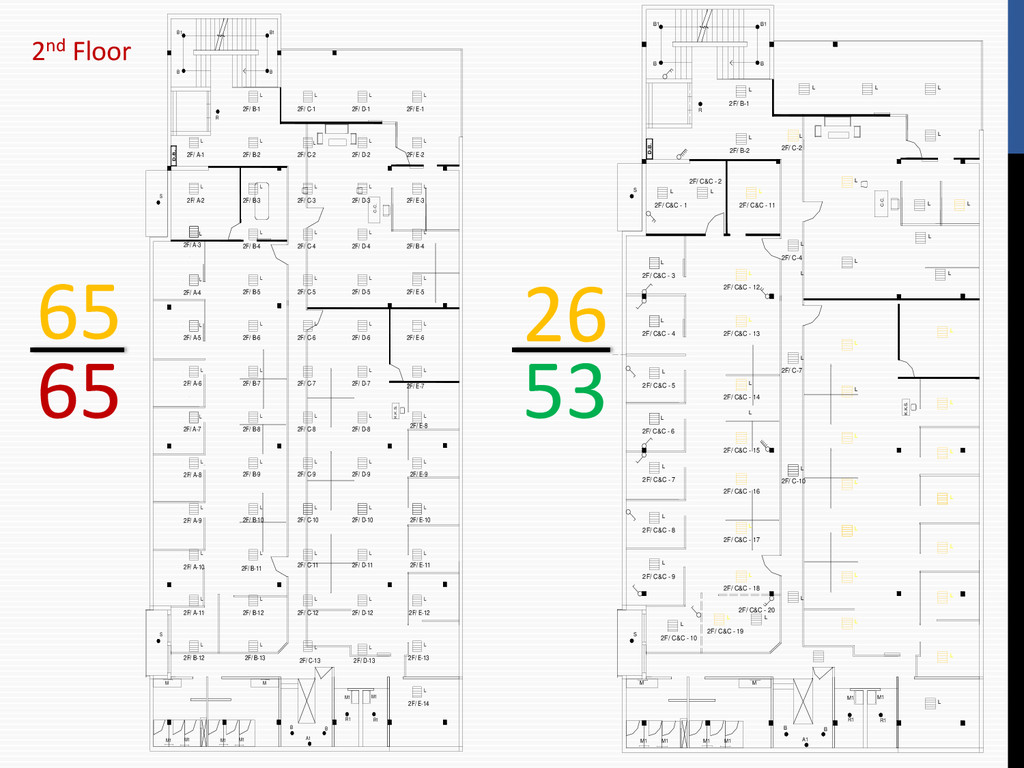
M1 M1 M1 M1 M M 2F/ B-12 S L L 2F/ B-13 2F/ B-11 2F/ A-11 L 2F/ B-12 L 2F/ A-10 L L 2F/ A-8 L 2F/ A-9 2F/ B-10 L L 2F/ B-9 L A1 B B M1 R1 M1 R1 2F/ E-14 L 2F/ D-13 L 2F/ C-13 L 2F/ E-13 L 2F/ D-12 L 2F/ C-12 L 2F/ E-12 L 2F/ D-11 L 2F/ C-11 L 2F/ E-11 L L 2F/ D-10 L 2F/ C-10 2F/ E-10 L 2F/ D-9 L 2F/ C-9 L 2F/ E-9 L 2F/ B-4 2F/ A-3 2F/ B-6 2F/ A-5 2F/ B-7 2F/ A-6 L L L L 2F/ B-5 2F/ A-4 L L L L S 2F/ A-2 L L 2F/ B-3 L 2F/ A-1 L D.B. 2F/ B-2 L L R 2F/ B-1 L B B L B1 B1 2F/ B-4 2F/ D-4 2F/ C-4 2F/ E-6 2F/ D-6 2F/ C-6 2F/ E-7 2F/ D-7 2F/ C-7 L L L K.K.S. L L 2F/ E-5 2F/ D-5 2F/ C-5 L L L L L L C.C. L 2F/ D-3 L 2F/ C-3 L 2F/ E-3 L 2F/ D-2 L 2F/ C-2 L 2F/ E-2 L 2F/ D-1 L 2F/ C-1 L 2F/ E-1 L L L 2F/ C&C - 6 M1 M1 M1 M1 M M 2F/ C&C - 10 S L L 2F/ C&C - 20 2F/ C&C - 19 L 2F/ C&C - 9 L L 2F/ C&C - 7 L 2F/ C&C - 8 L L A1 B B M1 R1 M1 R1 L L L L L L L L L 2F/ C-10 L L L 2F/ C&C - 4 2F/ C&C - 5 L L L L 2F/ C&C - 12 2F/ C&C - 3 L L L L S 2F/ C&C - 11 D.B. L R 2F/ B-1 B B L B1 B1 2F/ C-4 2F/ C-7 L L K.K.S. L L L L L L L C.C. L L L 2F/ C-2 L L L L L 2F/ B-2 L 2F/ C&C - 1 L 2F/ C&C - 2 L L L 2F/ C&C - 13 2F/ C&C - 14 2F/ C&C - 15 2F/ C&C - 16 2F/ C&C - 17 2F/ C&C - 18 26 53 65 65 2nd Floor
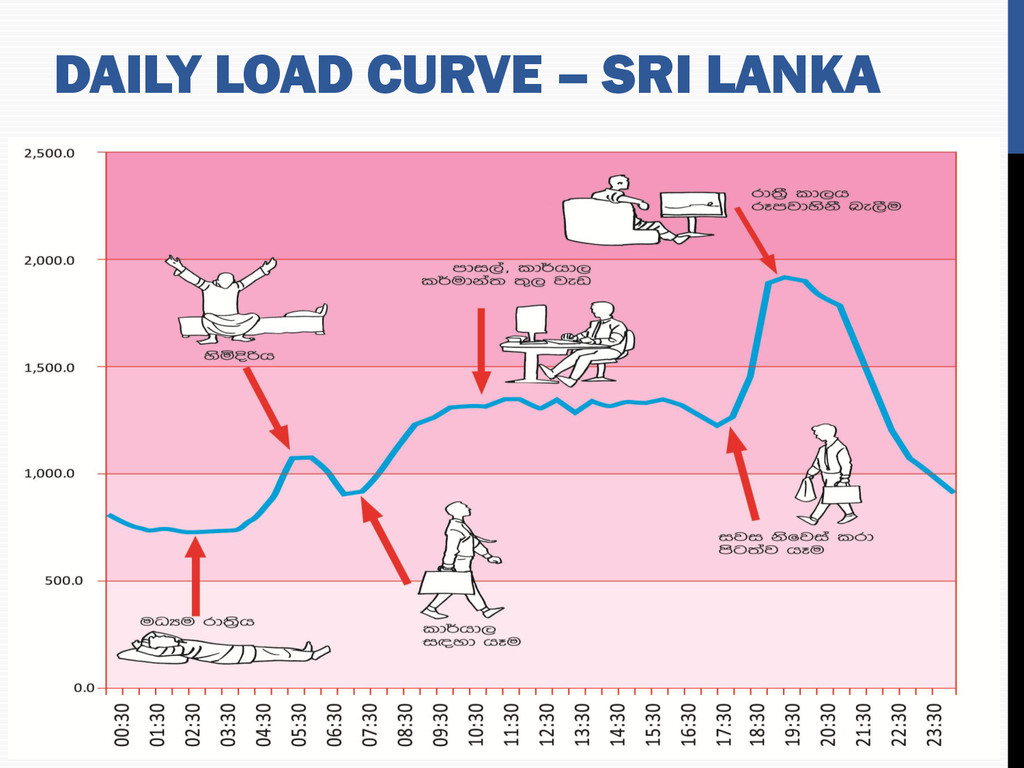
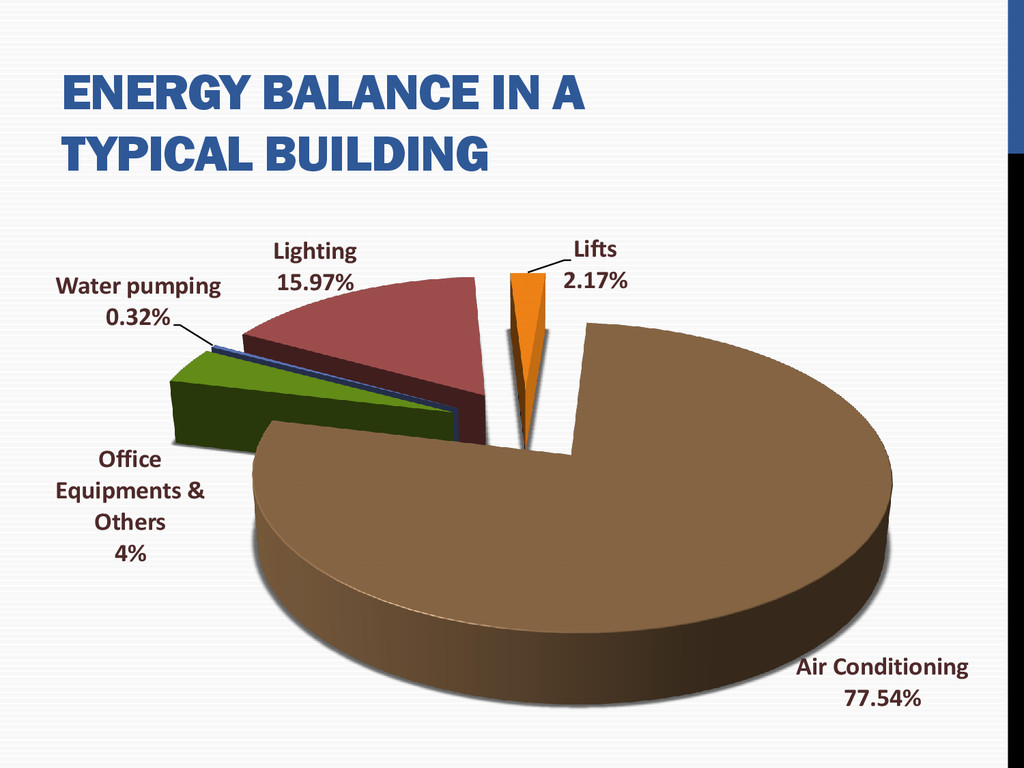
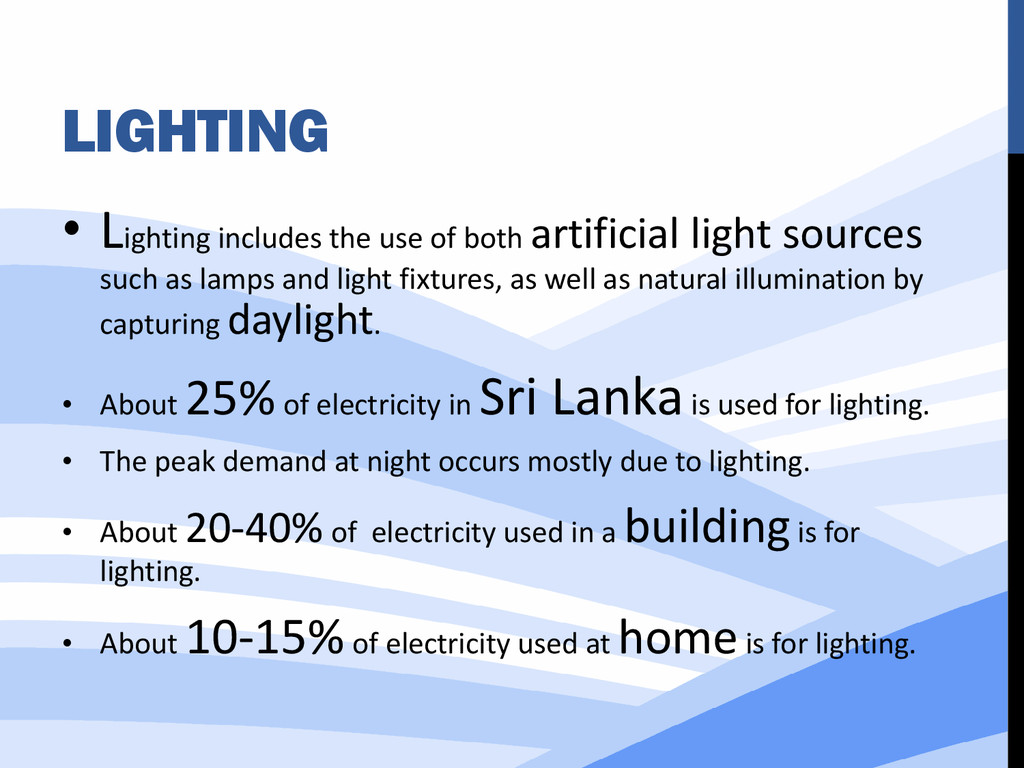
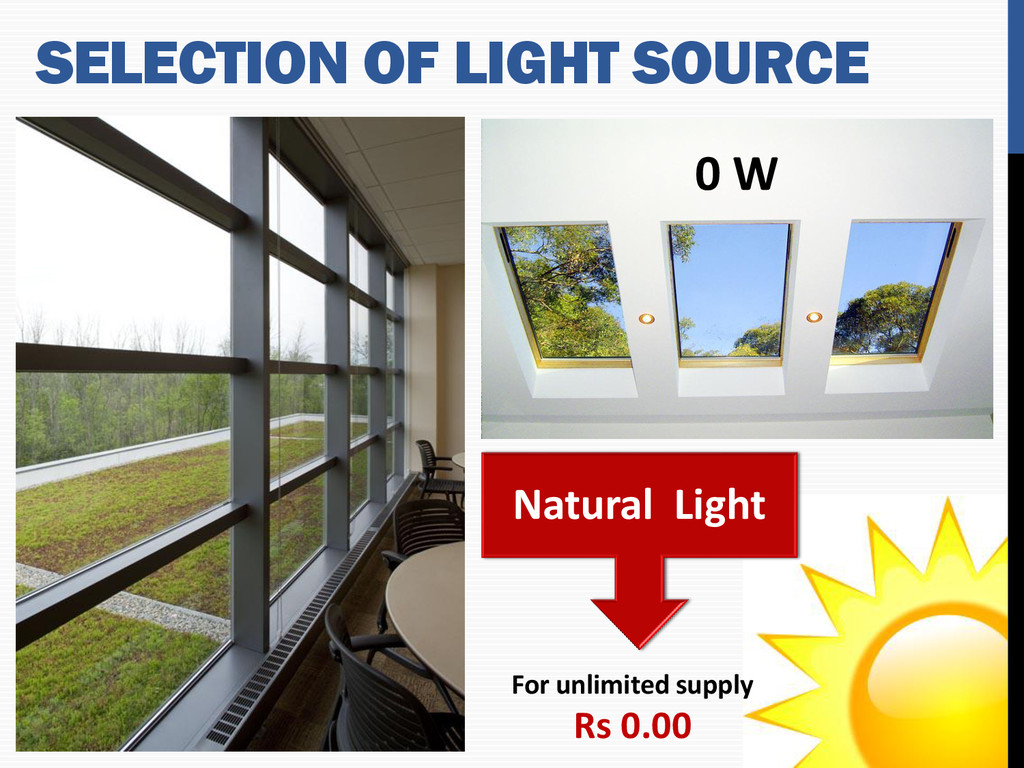
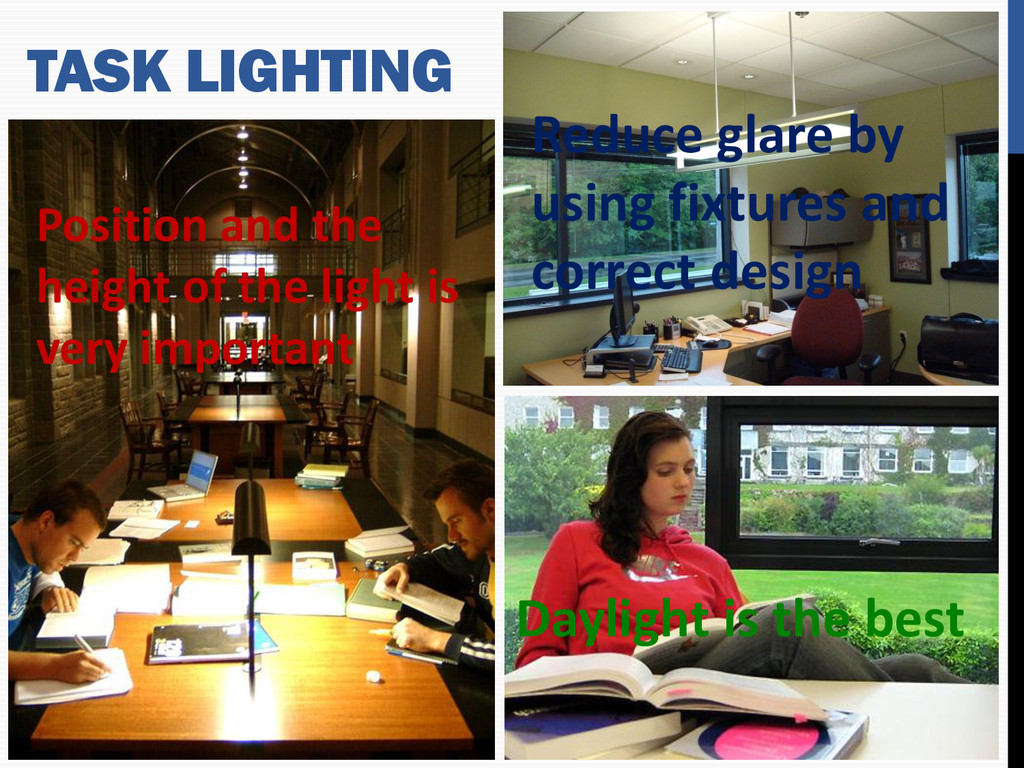
sources such as lamps and light fixtures, as well as natural illumination by capturing daylight. • About 25% of electricity in Sri Lanka is used for lighting. • The peak demand at night occurs mostly due to lighting. • About 20-40% of electricity used in a building is for lighting. • About 10-15% of electricity used at home is for lighting.
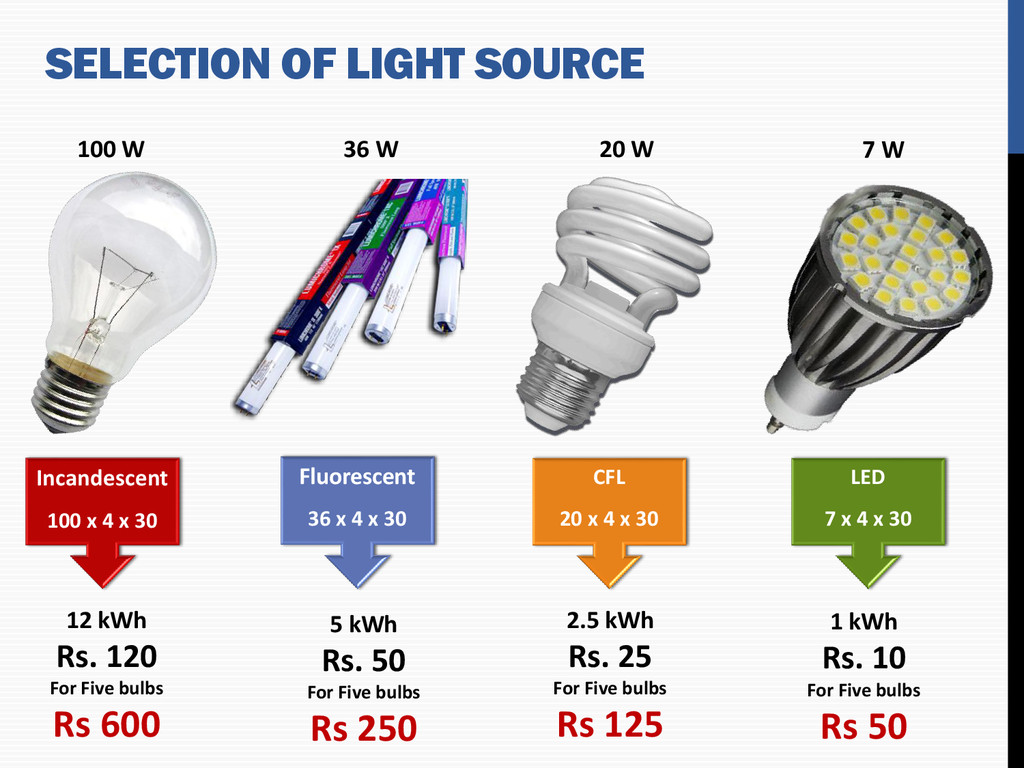
x 30 CFL 20 x 4 x 30 12 kWh Rs. 120 For Five bulbs Rs 600 2.5 kWh Rs. 25 For Five bulbs Rs 125 36 W 20 W Fluorescent 36 x 4 x 30 LED 7 x 4 x 30 7 W 5 kWh Rs. 50 For Five bulbs Rs 250 1 kWh Rs. 10 For Five bulbs Rs 50
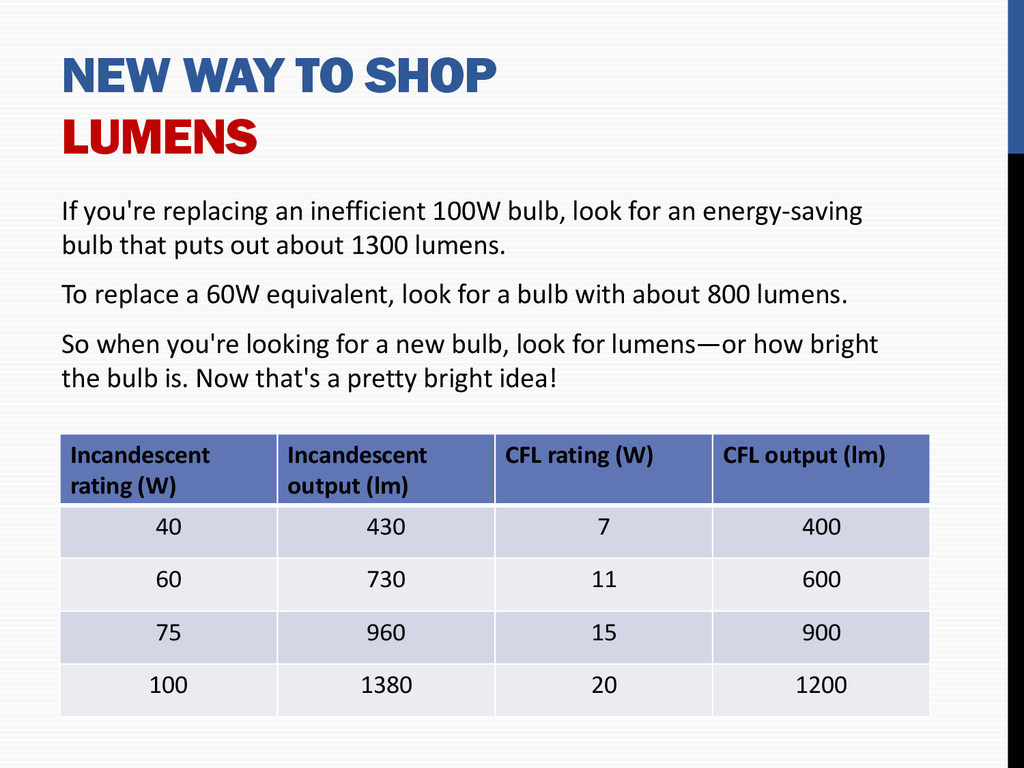
100W bulb, look for an energy-saving bulb that puts out about 1300 lumens. To replace a 60W equivalent, look for a bulb with about 800 lumens. So when you're looking for a new bulb, look for lumens—or how bright the bulb is. Now that's a pretty bright idea! Incandescent rating (W) Incandescent output (lm) CFL rating (W) CFL output (lm) 40 430 7 400 60 730 11 600 75 960 15 900 100 1380 20 1200
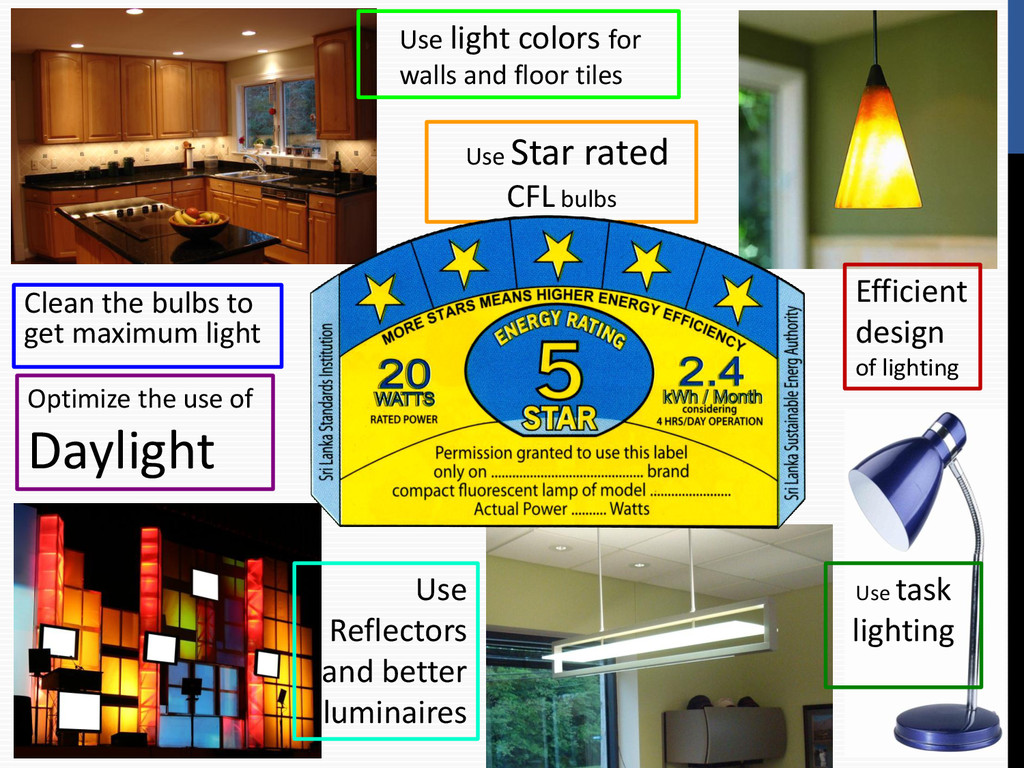
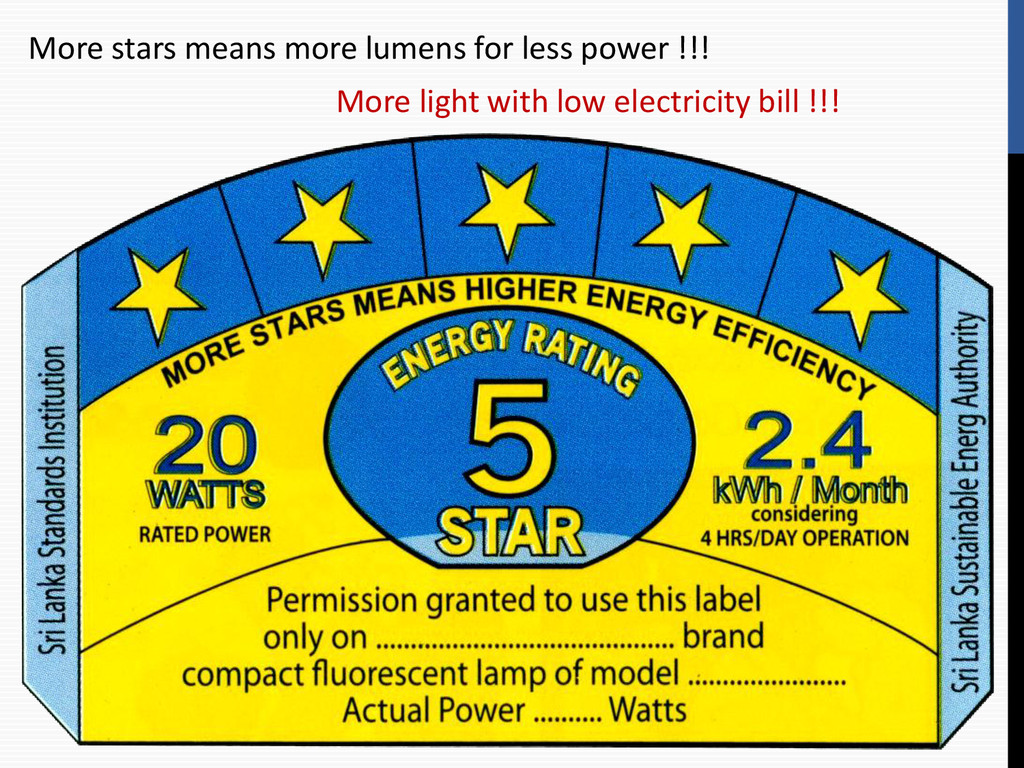
Use Star rated CFL bulbs Efficient design of lighting Use Reflectors and better luminaires Optimize the use of Daylight Use light colors for walls and floor tiles
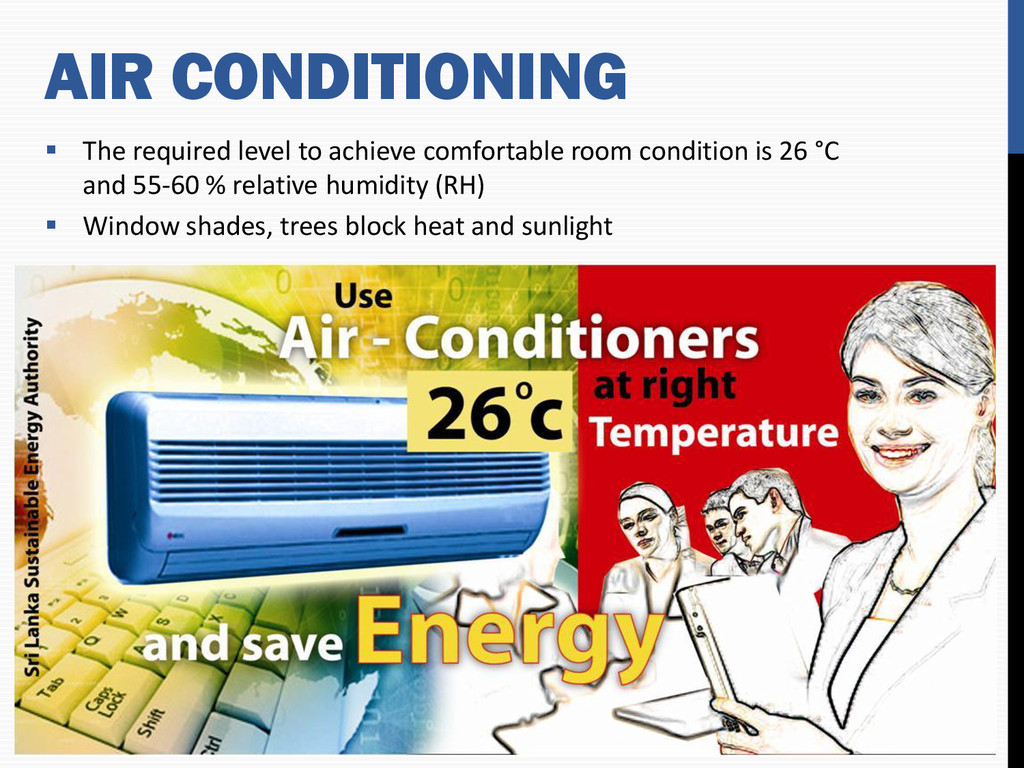
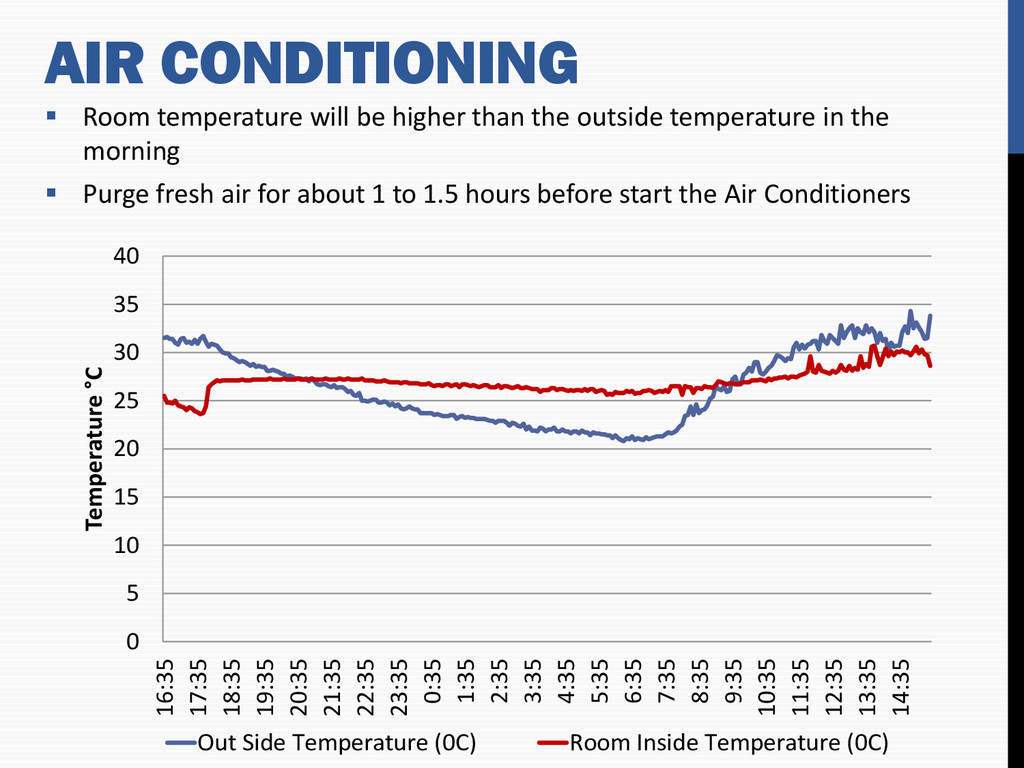
40 16:35 17:35 18:35 19:35 20:35 21:35 22:35 23:35 0:35 1:35 2:35 3:35 4:35 5:35 6:35 7:35 8:35 9:35 10:35 11:35 12:35 13:35 14:35 Temperature °C Out Side Temperature (0C) Room Inside Temperature (0C) Room temperature will be higher than the outside temperature in the morning Purge fresh air for about 1 to 1.5 hours before start the Air Conditioners
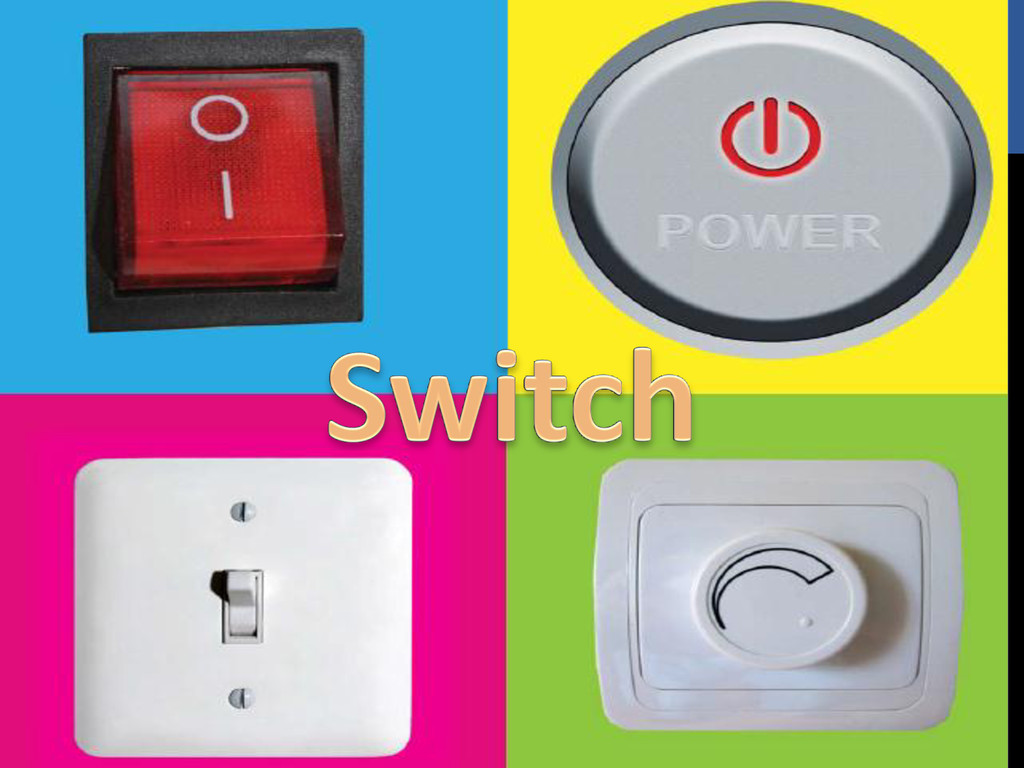
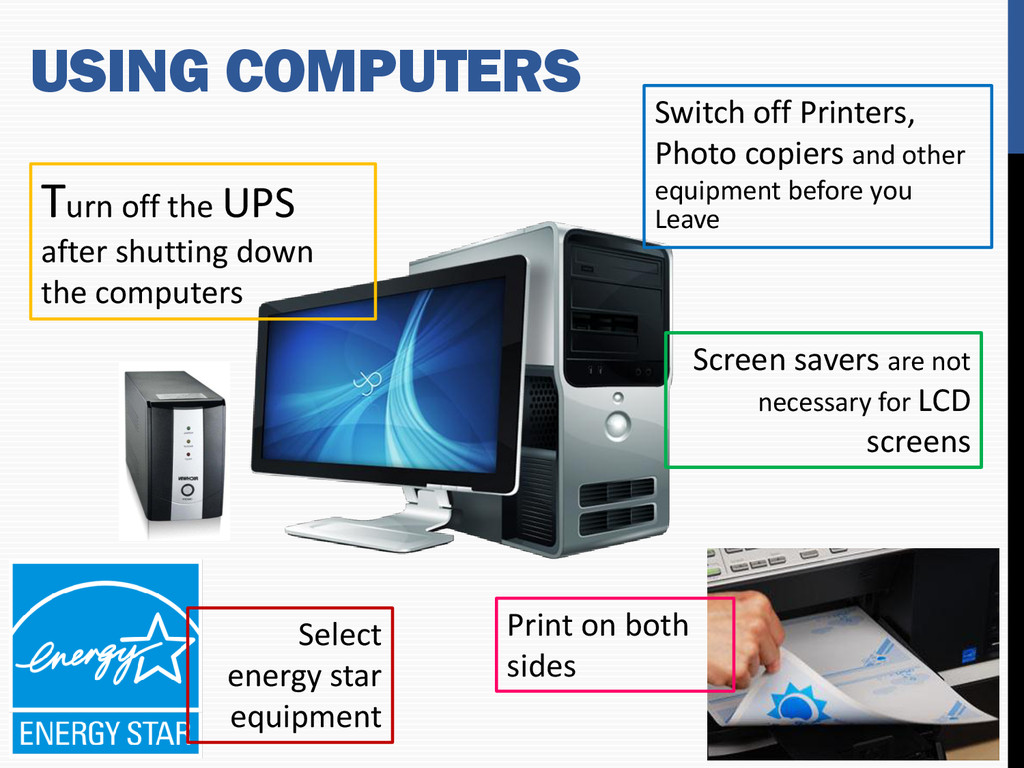
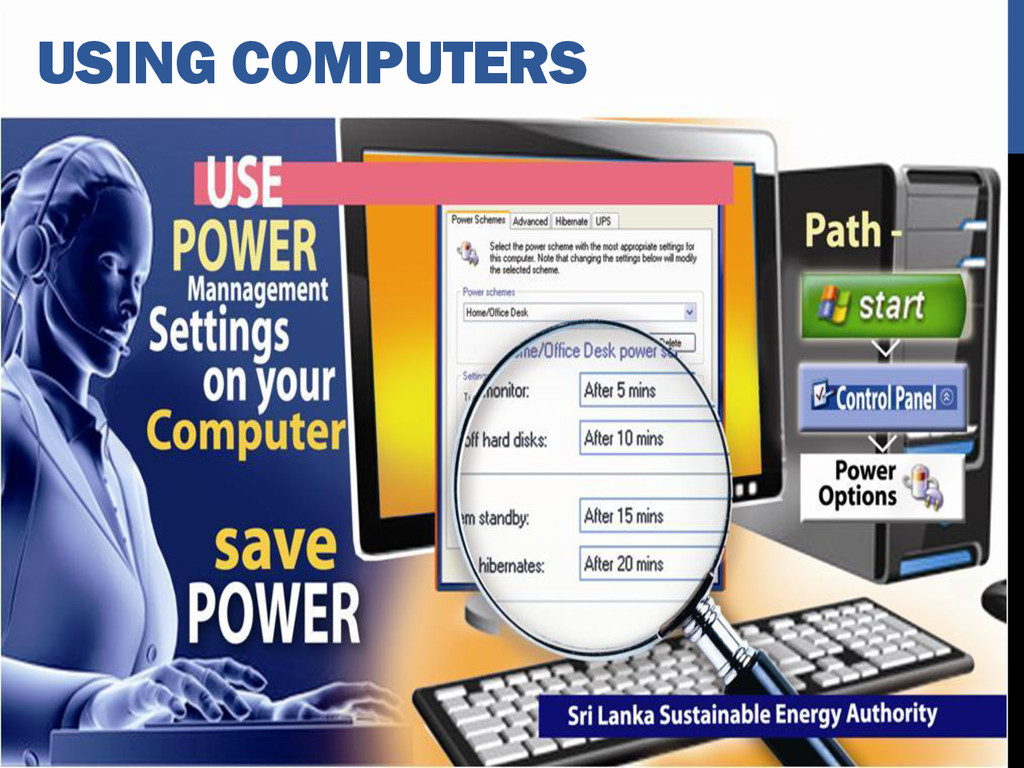
off Printers, Photo copiers and other equipment before you Leave Screen savers are not necessary for LCD screens Print on both sides Select energy star equipment USING COMPUTERS
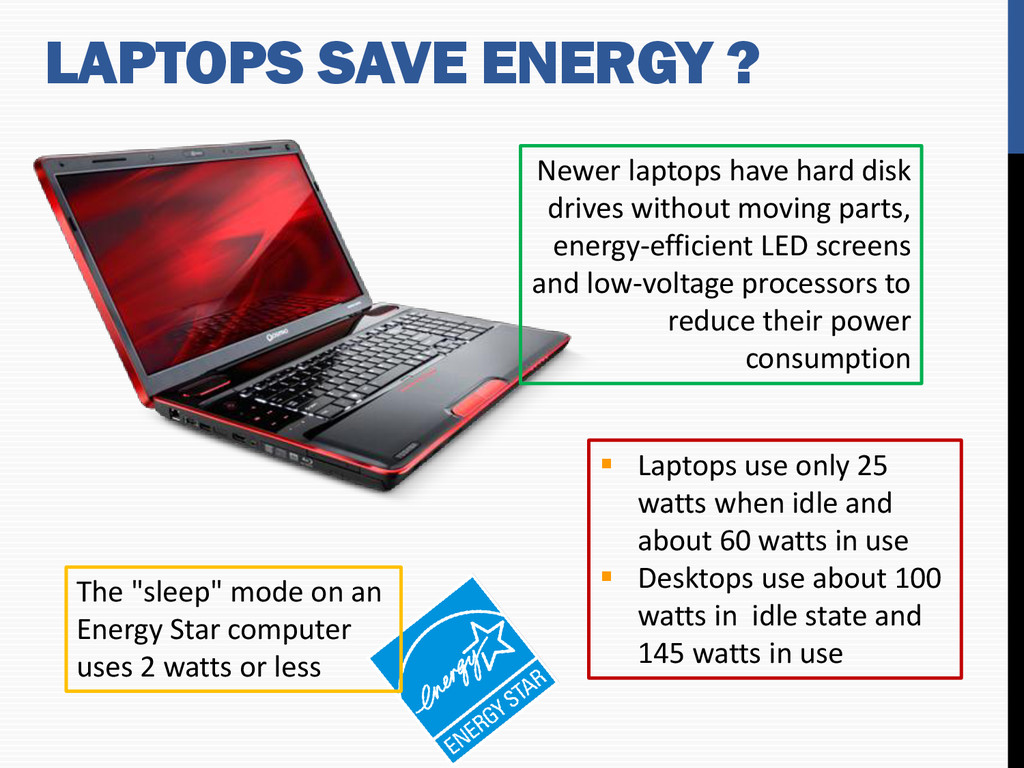
when idle and about 60 watts in use Desktops use about 100 watts in idle state and 145 watts in use The "sleep" mode on an Energy Star computer uses 2 watts or less Newer laptops have hard disk drives without moving parts, energy-efficient LED screens and low-voltage processors to reduce their power consumption
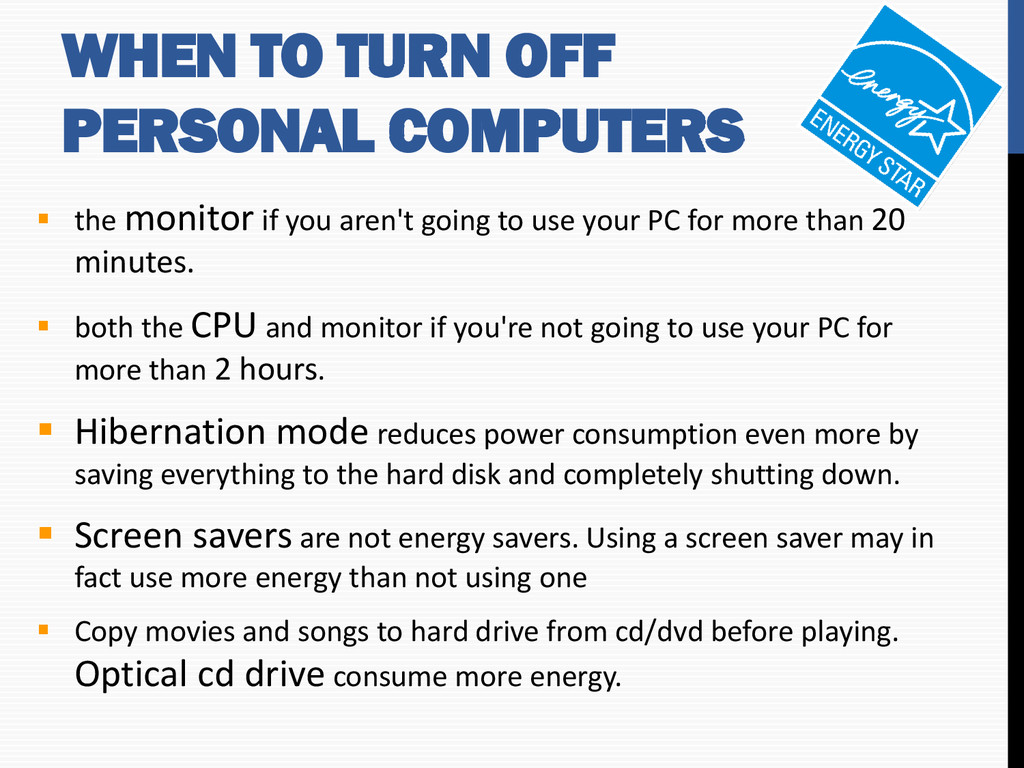
you aren't going to use your PC for more than 20 minutes. both the CPU and monitor if you're not going to use your PC for more than 2 hours. Hibernation mode reduces power consumption even more by saving everything to the hard disk and completely shutting down. Screen savers are not energy savers. Using a screen saver may in fact use more energy than not using one Copy movies and songs to hard drive from cd/dvd before playing. Optical cd drive consume more energy.
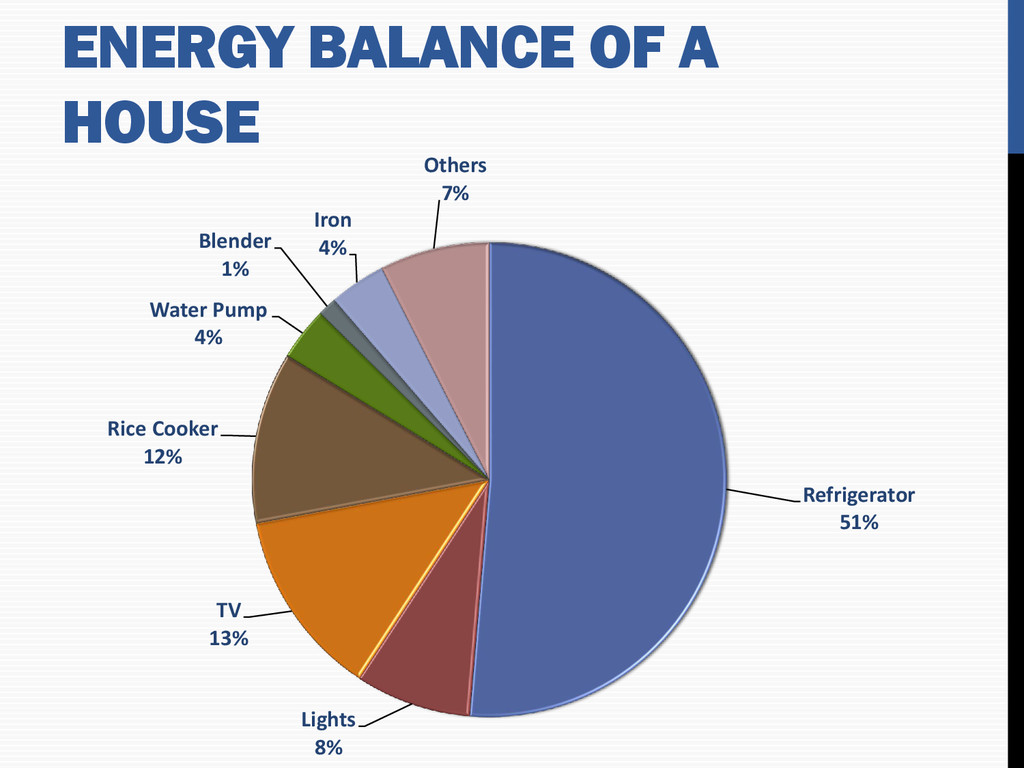
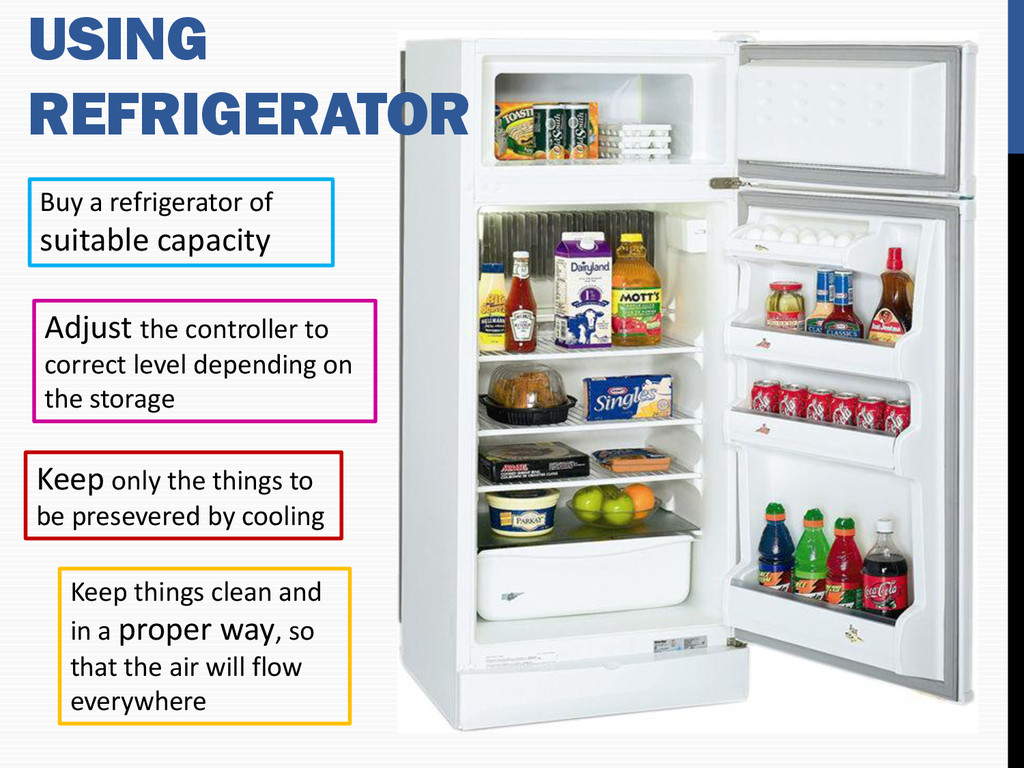
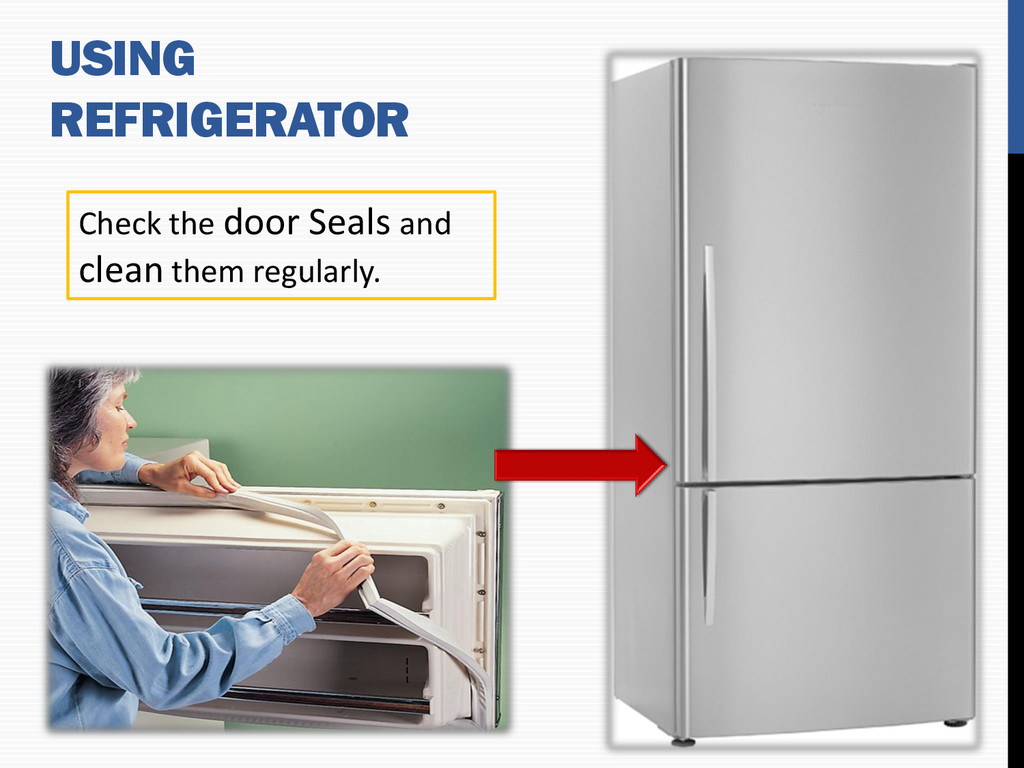
Keep things clean and in a proper way, so that the air will flow everywhere Keep only the things to be presevered by cooling Buy a refrigerator of suitable capacity USING REFRIGERATOR
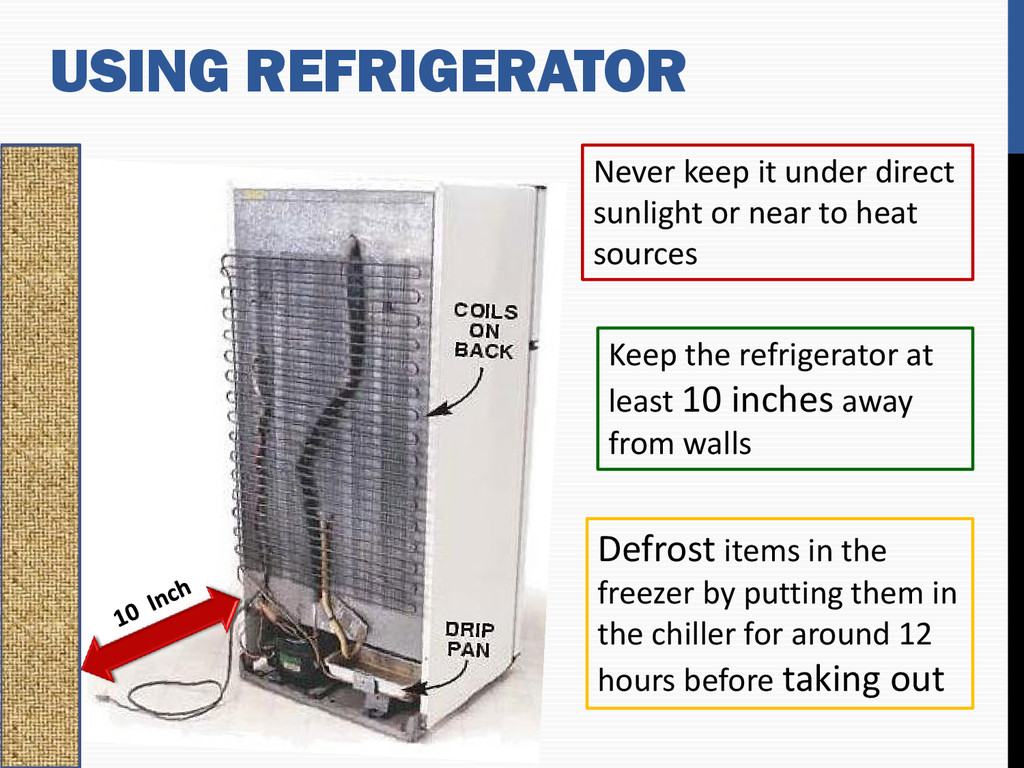
Defrost items in the freezer by putting them in the chiller for around 12 hours before taking out Never keep it under direct sunlight or near to heat sources USING REFRIGERATOR
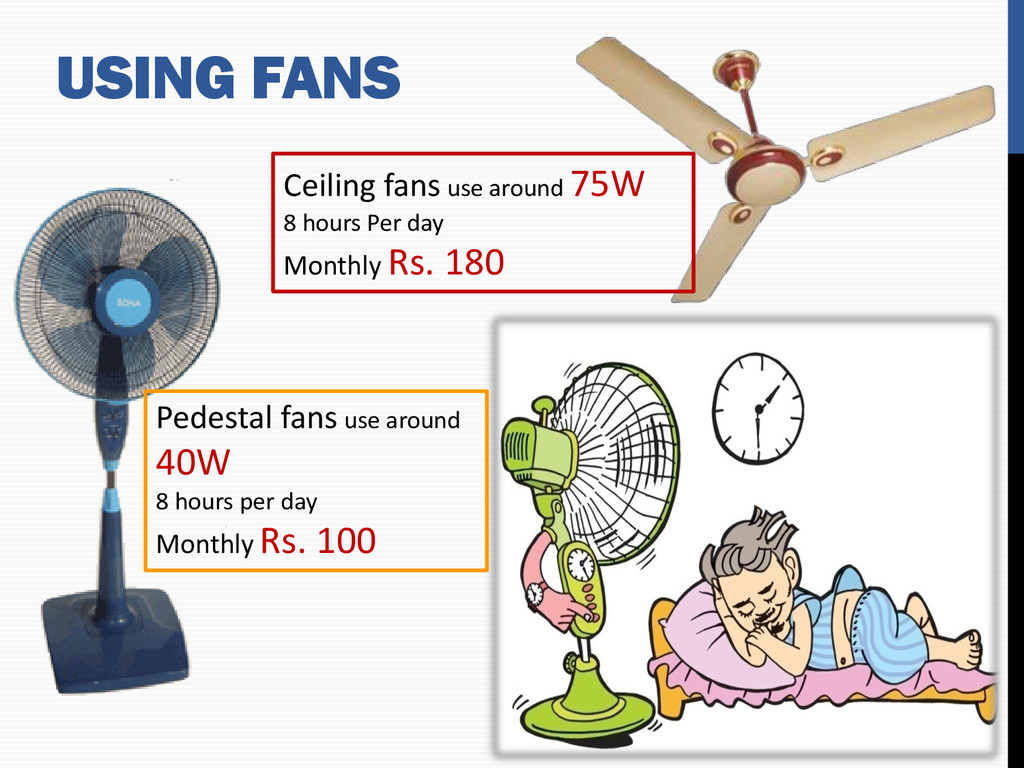
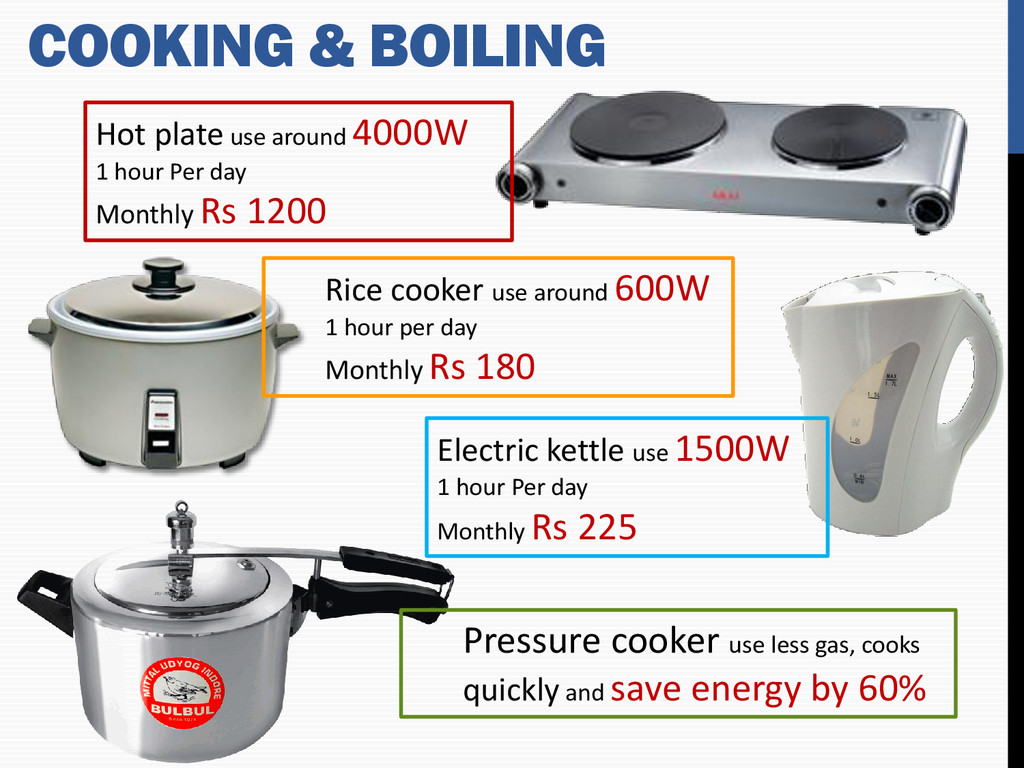
Per day Monthly Rs 1200 Pressure cooker use less gas, cooks quickly and save energy by 60% Rice cooker use around 600W 1 hour per day Monthly Rs 180 Electric kettle use 1500W 1 hour Per day Monthly Rs 225
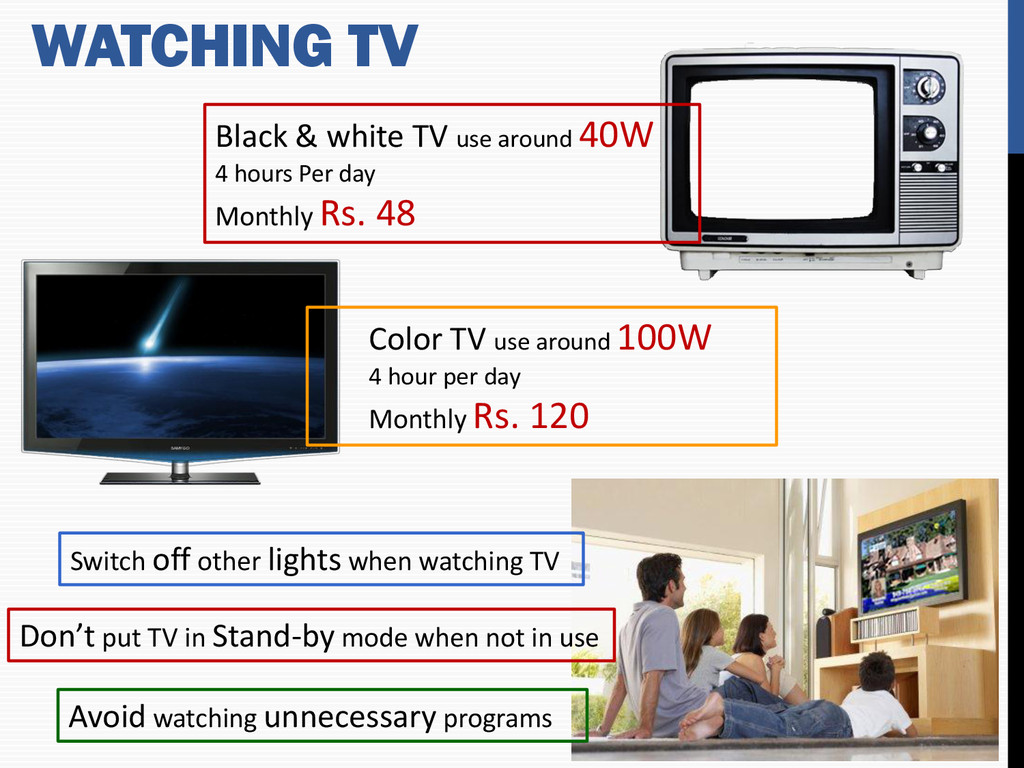
hours Per day Monthly Rs. 48 Color TV use around 100W 4 hour per day Monthly Rs. 120 Switch off other lights when watching TV Don’t put TV in Stand-by mode when not in use Avoid watching unnecessary programs
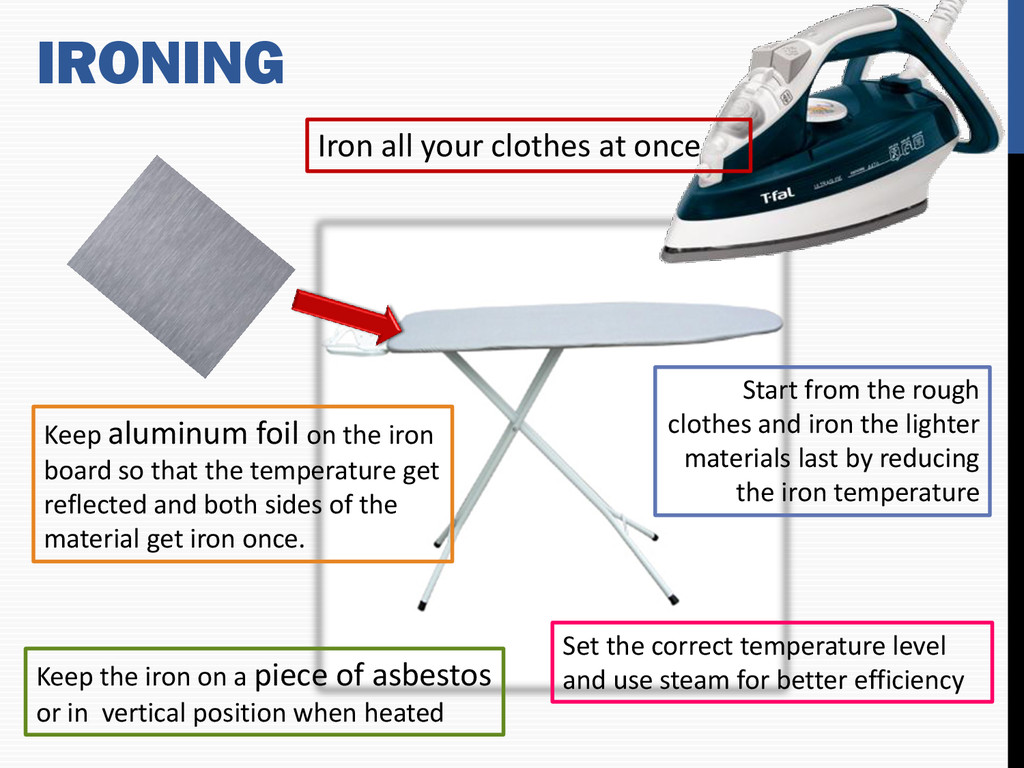
on a piece of asbestos or in vertical position when heated Keep aluminum foil on the iron board so that the temperature get reflected and both sides of the material get iron once. Start from the rough clothes and iron the lighter materials last by reducing the iron temperature Set the correct temperature level and use steam for better efficiency
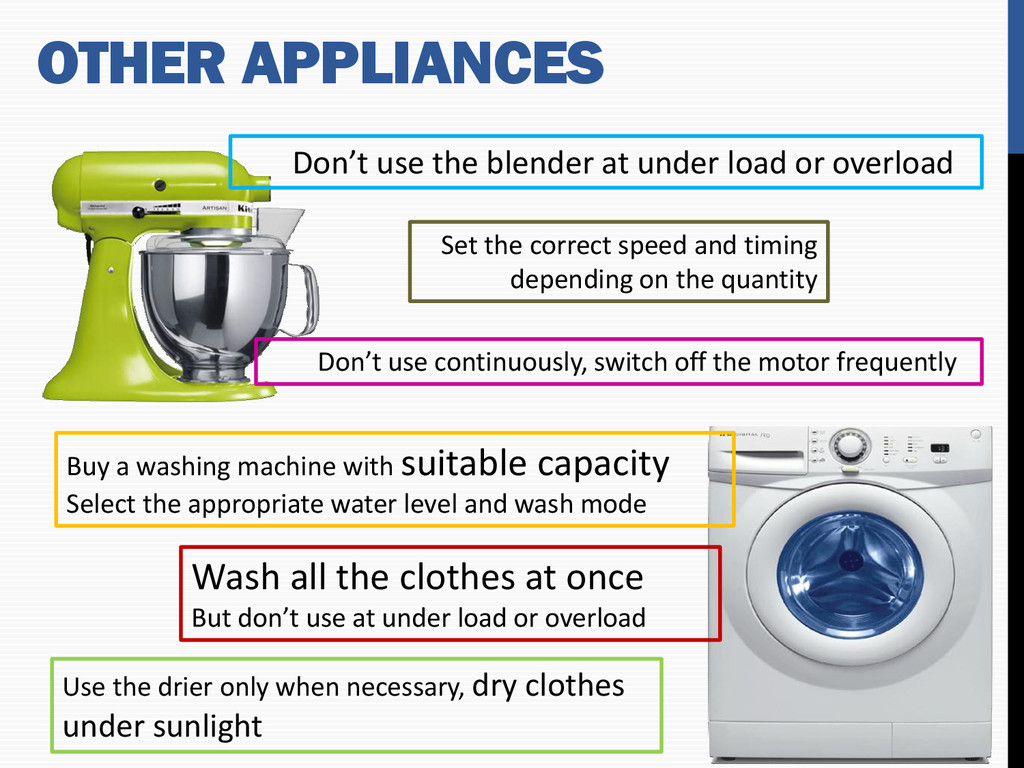
water level and wash mode Don’t use the blender at under load or overload Use the drier only when necessary, dry clothes under sunlight Wash all the clothes at once But don’t use at under load or overload Set the correct speed and timing depending on the quantity Don’t use continuously, switch off the motor frequently OTHER APPLIANCES
Steve Doty. “Achieving Sustainability in Energy Sector” by SEA. www.arresterfacts.com “Getting Down to Earth” by Megger Company. EPRI documents on Capacitors. Last but not least the mighty Internet.


 pfn
 carta_engineering
 takuroabe
 jyouryuusui
 hiracky16
 codmoninc
 kash1064
 kentapapa
 persolserverworks
 takonda
 takahashim
 aleyda
 lara
 erikaheidi
 jacobian
 eileencodes
 marktimemedia
 lauravandoore
 notwaldorf
 tammyeverts
 davidcarrasco
 elsirapls