Upgrade to Pro — share decks privately, control downloads, hide ads and more …

IBEF Retail - 2018

kaushalkshah
November 09, 2018
20

IBEF Retail - 2018

kaushalkshah

November 09, 2018
Tweet

Transcript

  1. Table of Content Advantage India…………………..….…….. 5 Market Overview and Trends………...…….7

    Strategies adopted……………....…………15 Growth Drivers……………………......…....18 Key Industry Organisations……….……....29 Useful Information……….……….......…....31 Executive Summary…………………..……..3 Opportunities.....…………………………...26
  2. For updated information, please visit www.ibef.org Retail 3 EXECUTIVE SUMMARY

    Retail market in India (US$ billion) 680 1,100 0 500 1,000 1,500 2017* 2020 Modern retail market in India (US$ billion) 13.51 26.67 0 10 20 30 2016 2019 Consumer expenditure in India (US$ billion) Notes: CAGR - Compound Annual Growth Rate, F- Forecast, * - till November 2017, according to MRRSIndia.com and Assocham - The Associated Chambers of Commerce and Industry of India Source: Ernst and Young, Price Waterhouse Cooper, Economic Times 1,824 3,600 0 1,000 2,000 3,000 4,000 2017 2020F  Rising income and demand for quality products to boost consumer expenditure  Total consumption expenditure is expected to reach nearly US$ 3,600 billion by 2020 from US$ 1,824 billion in 2017  Indian retail one of the fastest growing markets in the world due to economic growth  India is the world’s fifth largest global destination in the retail space.  Retail market in India is projected to grow from US$ 680 billion in 2017 to US$ 1.1 trillion in 2020.  India’s modern retail to double in size over the next three years  The modern retail market in India is expected to grow from US$ 70.45 billion in 2016 to US$ 111.25 billion in 2019.
  3. For updated information, please visit www.ibef.org Retail 4 EXECUTIVE SUMMARY

    Revenue from online retail in India (US$ billion) Number of supermarkets in India FMCG market in India (US$ billion) Source: indiaretailing.com Notes: CAGR - Compound Annual Growth Rate, E – Estimate, F – forecast,, All the years denote calendar year, * - According to eMarketer, ^ - Fiscal Year 2018  Robust consumption, rural markets to augment FMCG market  FMCG market expected to increase to US$ 103.7 billion by 2020 from Rs 3.4 lakh crore (US$ 52.75 billion) in 2018^  Increasing participation from foreign and private players to boost retail infrastructure  India's online retail sector grows 23 per cent to US$ 17.8 billion in 2017  Online retail sales is forecasted to grow at the rate of 31 per cent year-on-year to reach US$ 32.70 billion in 2018*  Revenue generated from online retail is projected to grow to US$ 60 billion by 2020  Rising number of tier-2 and tier-3 cities to enhance supermarket space in the country  Supermarkets to total 8,500 by 2016 from 500 in 2006 13.00 14.50 17.80 60.00 0 20 40 60 80 2015 2016 2017 2020 E 500 8500 0 3,000 6,000 9,000 2006 2016 49.00 52.75 103.70 0 50 100 150 2016 2018^ 2020 F
  4. For updated information, please visit www.ibef.org Retail 6 ADVANTAGE INDIA

     Healthy economic growth, changing demographic profile, increasing disposable incomes, changing consumer tastes and preferences are driving growth in the organised retail market in India  Rapid urbanisation with increasing purchasing power has led to growing demand  Retail space demand is expected to increase at the rate of 81 per cent to 7.8 million sq ft in 2018.^  Collective efforts of financial houses and banks with retailers are enabling consumers to go for durable products with easy credit  In April 2018, ICRA revised the retail credit growth outlook for NBFC to 17-18 percent for FY18 and FY 19.  Foreign retailers are continuously entering the Indian market  Cumulative FDI inflow in retail as of March 2018 stood at US$ 1,212.34 million  100 per cent cash and carry operations are gaining significance in India with Thailand’s Siam Makro being the latest entrant in this space, following Metro, Walmart and Booker  About 51 per cent FDI in multi-brand retail  100 per cent FDI in single-brand retail under the automatic route  Introduction of Goods and Service Tax (GST) as a single unified tax system from  To provide a level-playing field to stakeholders, the government is planning to synchronise policies of retail, FMCG and e-commerce within a single policy framework ADVANTAGE INDIA Source: Report of the Task force on Financing Plan for Ports, Government of India Note: FY – Indian Financial Year (April–March), NMDP – National Maritime Development Programme, FDI – Foreign Direct Investment, US$ – US Dollar, E – Estimated, MMT – Million Metric Tonnes, CAGR – Compound Annual Growth Rate, ^ - According to JLL report
  5. For updated information, please visit www.ibef.org Retail 8 EVOLUTION OF

    RETAIL IN INDIA Source: Technopak Advisors Pvt Ltd, BCG Pre 1990s 1990-2005 2005-2010 2010 onwards  Manufacturers opened their own outlets  Pure-play retailers realised the potential of the market  Most of them in apparel segment  Substantial investment commitments by large Indian corporate  Entry in food and general merchandise category  Pan-India expansion to top 100 cities  Repositioning by existing players  Cumulative FDI inflow from April 2000 to March 2018, in the retail sector, reached US$ 1,212.34 million  Retail 2020: Retrospect, Reinvent, Rewrite.  Movement to smaller cities and rural areas  More than 5–6 players with revenues over US$ 1 trillion by 2020  Large-scale entry of international brands  Approval of FDI limit in multi- brand retail up to 51 per cent  Rise in private label brands by retail players  Sourcing and investment rules for supermarkets were relaxed  E commerce has emerged as one of the major segments  100 per cent FDI in single brand retail under the automatic route
  6. For updated information, please visit www.ibef.org Retail 9 RETAIL FORMATS

    IN INDIA Mono/exclusive branded retail shops Multi-branded retail shops Convergence retail outlets E-retailers  Exclusive showrooms owned or franchised out by a manufacturer  Complete range available for a given brand, certified product quality  Focus on particular product categories and carry most of the brands available  Customers have more choices as many brands are on display  Display most of convergence as well as consumer/electronic products, including communication and IT group  One-stop shop for customers; many product lines of different brands on display  It is an online shopping facility for buying and selling products and services; the facility is widely used for electronics, health and wellness  Highly convenient as it provides 24X7 access, saves time and ensures secure transaction Source: Aranca Research Note: IT - Information Technology
  7. For updated information, please visit www.ibef.org Retail 10 COMPETITIVE LANDSCAPE

    IN INDIAN RETAIL SECTOR Departmental stores Hypermarkets Supermarkets/ convenience stores Specialty stores Cash and carry stores  Pantaloon has 209 stores  Westside operates 108 stores as of FY17  Shoppers Stop has 83 stores in India, as of 2018  As of FY18, Reliance Retail launched ‘Trends’ in this format and currently has more than 3,300 stores across India  Pantaloon Retail is the leader in this format, with 259 Big Bazaar stores and online franchisees  Aditya Birla Retail (More Hypermarket)- 20 stores  HyperCITY (19 stores), Trent, Spencer’s (Spencer Hyper), and Reliance are other players  Aditya Birla Retail- More Supermarket (523 stores)  Spencer’s Daily (120 stores)  Reliance Fresh (502 stores)  REI 6Ten (350 stores)  Big Bazaar (259 stores)  Titan Industries is a large player, with 438 World of Titan, 200 Tanishq and 470 Titan Eye+ shops  Vijay Sales, Croma and E-Zone are into consumer electronics  Landmark and Crossword focus on books and gifts  Metro started the cash and carry model in India; the company operates 24 stores across Mumbai, Kolkata, Delhi, Punjab, Hyderabad and Bengaluru  As of FY18, Reliance Retail operates 43 cash and carry stores called ‘Reliance Market’ Retail Source: Company websites, Press Release
  8. For updated information, please visit www.ibef.org Retail 11 STRONG GROWTH

    IN THE INDIAN RETAIL INDUSTRY Note: CAGR - Compound Annual Growth Rate, E – Estimated, @ - according to a report by BMI Research, * - till November 2017, according to MRRSIndia.com and Assocham - The Associated Chambers of Commerce and Industry of India Source: BCG Retail 2020, Ernst and Young, Deloitte, indiaretailing.com, Economist Intelligence Unit, Euro monitor,  The retail sector in India is emerging as one of the largest sectors in the economy  The total market size of Indian retail industry is forecasted to increase to US$ 1.1 trillion by 2020 from US$ 680 billion in 2017 and is expected to grow at the rate of 20 per cent year-on-year*.  India will become a favourable market for fashion retailers on the back of a large young adult consumer base, increasing disposable incomes and relaxed FDI norms.@ Visakhapatnam port traffic (million tonnes) Market size over the past few years (US$ billion) 204 238 278 321 368 424 518 490 534 600 680 680 1,100 0 200 400 600 800 1,000 1,200 2000 2002 2004 2006 2008 2010 2012 2013 2014 2015 2016 2017* 2020 E CAGR 7.82%
  9. For updated information, please visit www.ibef.org Retail 12 ORGANISED RETAIL

    IN NASCENT STAGE Source: BCG , KPMG- indiaretailing.com, Deloitte Report, Winning in India’s Retail Sector 7% 10% 93% 90% 0% 10% 20% 30% 40% 50% 60% 70% 80% 90% 100% FY 2016-17 2020 E Organised trade Unorganised trade Significant scope for expansion Note: E – estimate, ^ - as per a report by Centre for Digital Financial Inclusion (CDFI).  Organised Retail Penetration (ORP) in India is low (7 per cent) compared with that in other countries, such as the US (85 per cent). This indicates strong growth potential for organised retail in India. There are over 15 million mom-and-pop stores.  The Indian retail market is in its nascent stage; unorganised players accounted for 7 per cent of the market during FY 2016-17.  The organised retail in India is growing at a CAGR of 20-25 per cent per year.  In 2020, it is estimated that organised retail penetration share would reach 10 per cent and unorganised retail penetration would hold a major share of 90 per cent.  The unorganised retail sector in India has huge untapped potential for adopting digital mode of payments, as 63 per cent of the retailers are interested in using digital payments like mobile and card payments. ^
  10. For updated information, please visit www.ibef.org Retail 13 SECTOR’S HIGH

    GROWTH POTENTIAL IS ATTRACTING INVESTORS FDI Confidence Index 2018 2.09 1.82 1.81 1.77 1.76 1.72 1.7 1.66 1.58 1.57 1.56 1.53 0 0.5 1 1.5 2 2.5 United States Canada Germany United Kingdom China Japan France Australia Switzerland Italy India Singapore Source: AT Kearney 2017 FDI Confidence Index Note: FDI - Foreign Direct Investment  India has occupied a remarkable position in global retail rankings; the country has high market potential, low economic risk and moderate political risk  India’s high growth potential compared to global peers has made it more favourable. India is expected to become the world's third-largest consumer economy, reaching US$ 400 billion in consumption by 2025, according to a study by Boston Consulting Group  In FDI Confidence Index, India ranks 11th (after U.S., Canada, Germany, United Kingdom, China, Japan, France, Australia, Switzerland and Italy)  India is ranked first in the Global Retail Development Index 2017, backed by rising middle class and rapidly growing consumer spending
  11. For updated information, please visit www.ibef.org Retail 14 RISING PROMINENCE

    OF ONLINE RETAIL 7 28 33 38.5 0 5 10 15 20 25 30 35 40 45 FY2012 2016 FY2017 FY2018 E Online retail in India (US$ billion) 13.00 14.50 17.80 60.00 0 10 20 30 40 50 60 70 2015 2016 2017 2020 E Source: MasterCard Worldwide Insights 4Q 2010, PWC e commerce in India report, ASSOCHAM, UN Report 'The power of 1.8 billion‘, Nasscom annual guidance 2018 Notes: APMEA - Asia/ Pacific, Middle East and Africa, E- Estimated, F- Forecast, ^ - as per RedSeer Consulting, * - According to eMarketer  With growth in the e-commerce industry, online retail is estimated to reach US$ 60 billion by 2020. It is forecasted to grow at a CAGR of over 30 per cent from 2016 to 2021, on the back of shift from traditional retail to online channels by millennials.  India's ecommerce industry's sales rose 40 per cent year-on-year to reach Rs 9,000 crore (US$ 1.5 billion) during the five-day sale period ending September 24, 2017, backed by huge deals and discounts offered by the major ecommerce companies.  The government plans to allow 100 per cent FDI in e-commerce, under the arrangement that the products sold must be manufactured in India to gain from the liberalised regime  Online retail business is the next generation format which has high potential for growth in the near future. After conquering physical stores, retailers are now foraying into the domain of e-retailing. It had a market size of US$ 18 billion in 2017.  Online retail sales is forecasted to grow at the rate of 31 per cent year-on-year to reach US$ 32.70 billion in 2018* Revenues of the Indian E-commerce industry (US$ billion)
  12. For updated information, please visit www.ibef.org Retail 16 STRATEGIES ADOPTED

     As of February 2017, Tanishq is focusing on expanding its large format-retailing concept, with re-launching their showrooms in Velachery.  The Future Group will set up 4000 “neighbourhood” retail stores in the next 3-5 years as a part of its focus on small stores. The brand will increase the number of stores from 538 in March 2017 to 1000 by September 2018.  In May 2017, Myntra voiced intentions to increase their market penetration by spending on technology and buying more brands instead of spending on discounts and marketing. Focus  Retailers are opting for many channel to maximise sales, Omni-channel retailing is being adopted by many retailers in India. For example, Shoppers Stop is making efforts to be an omni-channel retailer. Ezone has launched an online platform, which has led to increase in sales  In February 2017, Myntra became the 1st e-commerce brand to manage the fashion brand -- Mango’s omni channel presence, globally.  As of February 2018, Paytm Mall has decided to enter into physical retail and planned to set up a brick-and-mortar store in New Delhi, co-branded with Red Tape shoes, where customers can walk in, scan product bar codes, browse and make purchases via its mobile app. The company is targeting 400 stores by February 2019.  In February 2018, Amazon launched its food retailing business called Amazon Retail India Pvt Ltd In Pune, India on a pilot basis, thereby becoming the first foreign ecommerce company to stock and sell food products directly to consumers. Omni-channel retailing Source: Company website  It is imperative for a retailer to have a strong distribution and logistic network to succeed in this sector. Players follow a distribution network that suits them the best. For example, Shoppers Stop follows a “hub and spoke” model for its distribution network to increase efficiency and productivity Strong distribution and logistic network  In March 2017, PepsiCo Inc. announced the launch of ready to cook breakfast items like khichdi, dosa, idli etc., which would be sold under the brand namely Quaker Nutri Foods  In March 2017, Parle launched Frooti its iconic drink in a fizzy version, it’s the first innovation in the brand since its launch 32 years ago. Marketing innovation  Certain retailers adopt ‘first price right’ approach. Retailers do not offer discounts under this strategy: they directly compete on the selling price by offering a best price without any markdowns Lowering prices
  13. For updated information, please visit www.ibef.org Retail 17 STRATEGIES ADOPTED

    Source: International  Most retailers have advanced off-season sales from 15 days to a month with discounts of 20-70 per cent on certain products  Higher discounts and other value-added services for members Offering discounts  Companies offer innovative value-added services, like customer loyalty programmes and happy hours on shopping deals  Offers for senior citizens, contests for students and lottery gains are now very common Offering value- added services  To keep customers on shop floors for a longer time and increase conversions, retailers are now pitching to partner with manufacturers, service providers, financial companies, etc. to create a buzz around certain product categories Leveraging partnerships  Critical components of supply chain planning applications help retailers to maintain profit margins  Retailers develop innovative solutions for managing the supply chain problems  Innovative solutions like performance management, frequent sales operation management, demand planning, inventory planning, production planning and lean systems can help retailers to get advantage over competitors Strong supply chain  To diversify the product offerings and tab the growing luxury retail segment, retailers are forming joint ventures with foreign luxury brands. Reliance Brands Ltd. formed a joint venture with Bally, a Swiss luxury brand, to exclusively market its products in India Joint Ventures  Retailers benefit if consumers perceive their store brands to have consistent and comparable quality and availability in relation to branded products. For this, retailers are providing more assortments for private level brands to compete with supplier's brand. New product development, aggressive retail mix and everyday low pricing strategy help to get edge over supplier's brand Changing the perception  Indian retailers use hyper-personalisation models based on behavioral data, brands performance, demographic preference and pin codes as marketing strategy which boosts sales. Hyper- Personalisation  Online retail segment offers cash-on-delivery and manufacturers’ warranty to boost e-retailing in consumer durable sector.  Cash-on-delivery is the most preferred payment option with over 30 per cent of buyers opting for it in India Cash-on-Delivery
  14. For updated information, please visit www.ibef.org Retail 19 GROWTH DRIVERS

    FOR RETAIL IN INDIA Growth Drivers Easy consumer credit and increase in quality products Favourable demographics Brand consciousness Rise in income and purchasing power Change in consumer mindset
  15. For updated information, please visit www.ibef.org Retail 20 GROWTH DRIVERS

    FOR RETAIL IN INDIA  India’s per capita GDP increased to Rs 98,867 (US$ 1,534.01) in FY 18 from Rs 93,888 (US$ 1,399.43).  Indian consumers are now shifting more towards premium brands by paying more for value and service Consumer preferences  Factors like young demographic composition, increasing personal disposable income, more preference towards affordable luxury and rising middle class population are developing preferences for specific brands. Brand Consciousness  Consumers have become more comfortable using online services due to demonetisation  Online retail segment provides various credit and payment options driven by increasing internet penetration, speed, 24- hour accessibility and convenient and secured transactions Consumer Finance Opportunities Source: News Articles, Ministry of Statistics and Programme Implementation  Department of Industrial Policy and Promotion (DIPP) approved three foreign direct investments (FDI), Mountain Trail Food, Kohler India Corporation, and Merlin Entertainments India in the single brand retail sector.  The DIPP has approved two FDI proposals worth more than Rs 400 crore (US$ 62.45 million) within the retail sector. FDI Approvals  India’s retail market witnessed investments worth US$800 million by Private Equity (PE) firms and wealth funds in 2017.  India’s retail sector attracted Rs 9.5 billion (US$ 147.40 million) investments in FY18, at a growth rate of 35 per cent year-on-year from Rs 7 billion (US$ 104.34 million) in FY17. Investments
  16. For updated information, please visit www.ibef.org Retail 21 1,302.18 1,482.19

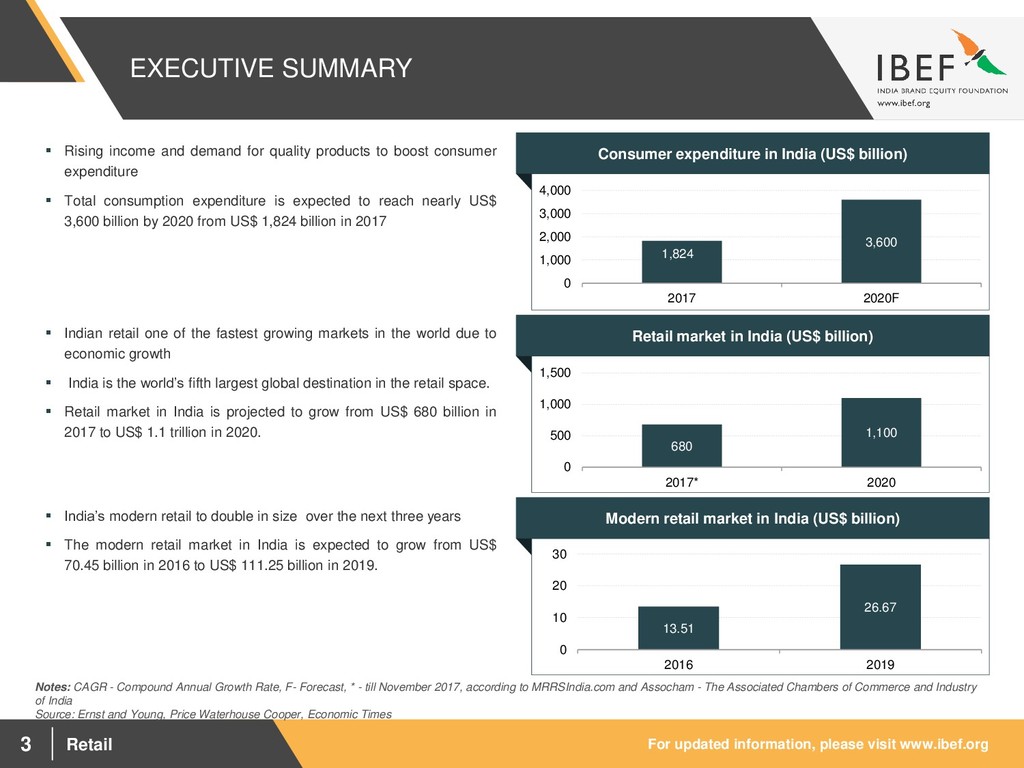
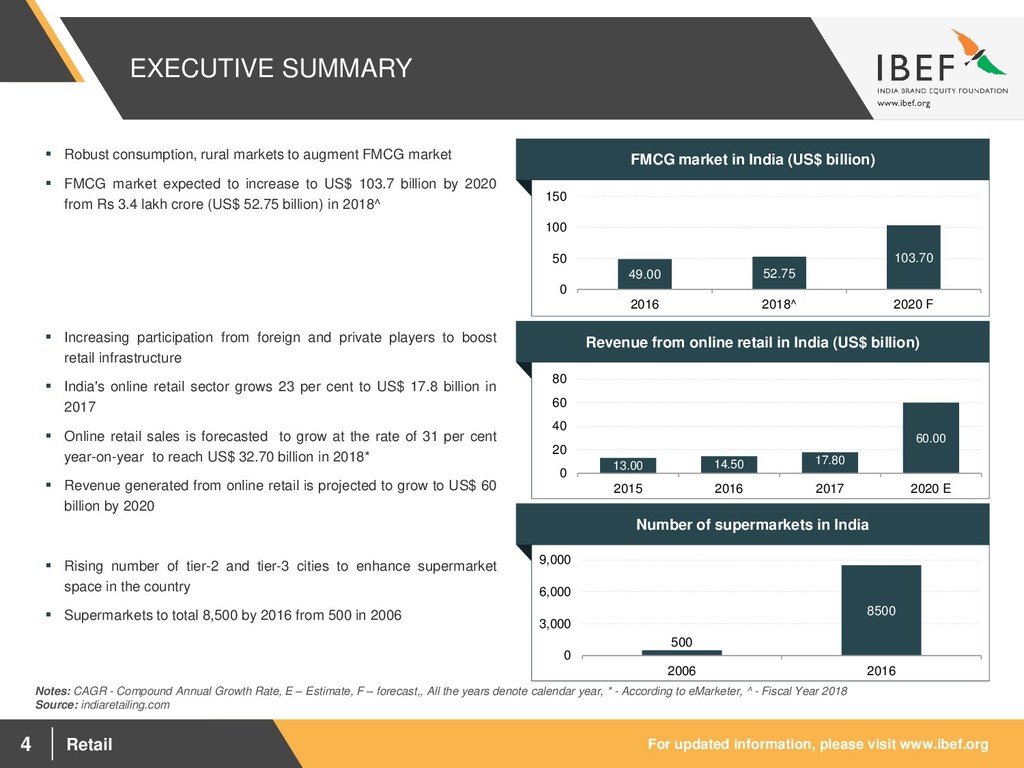
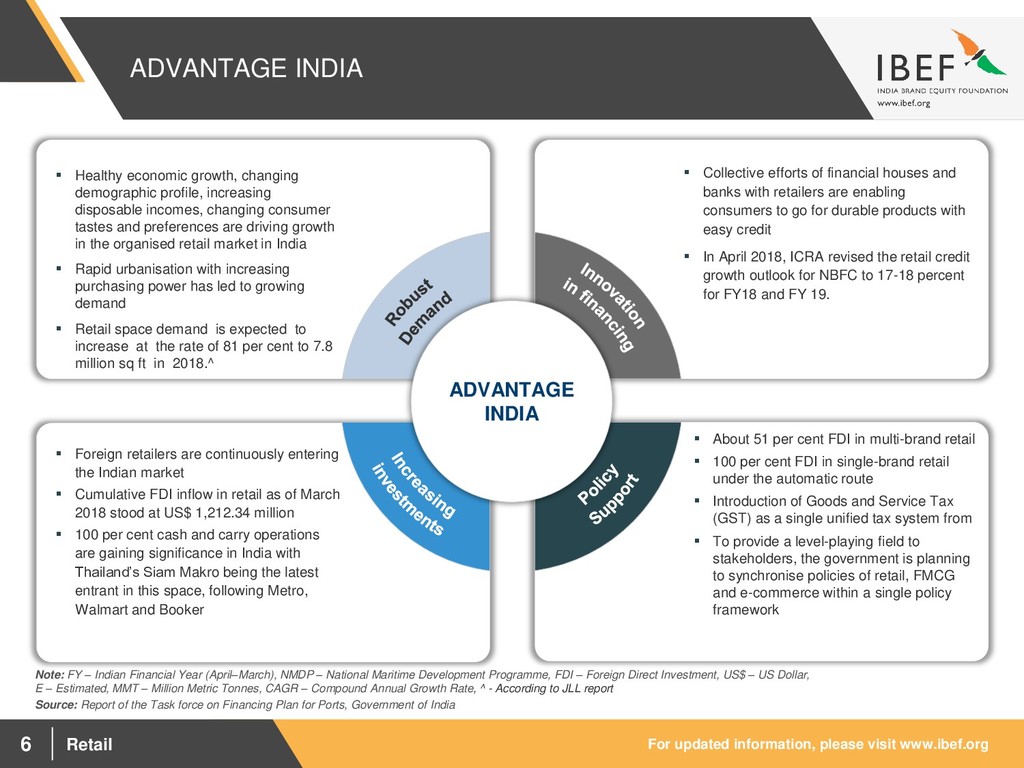
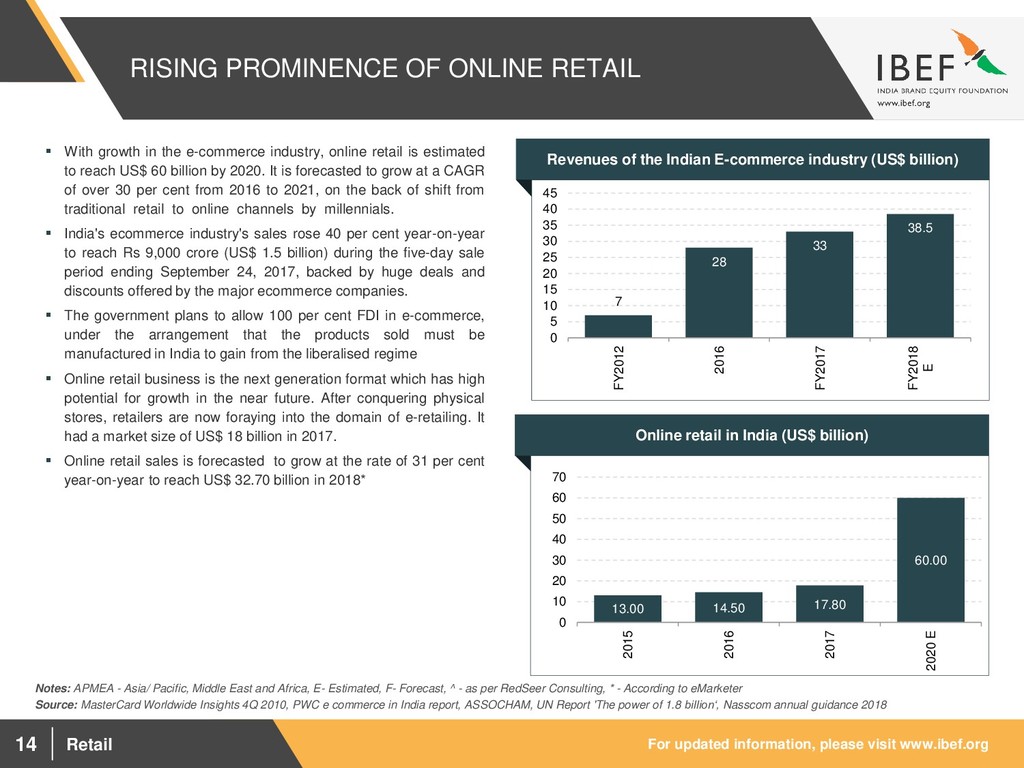
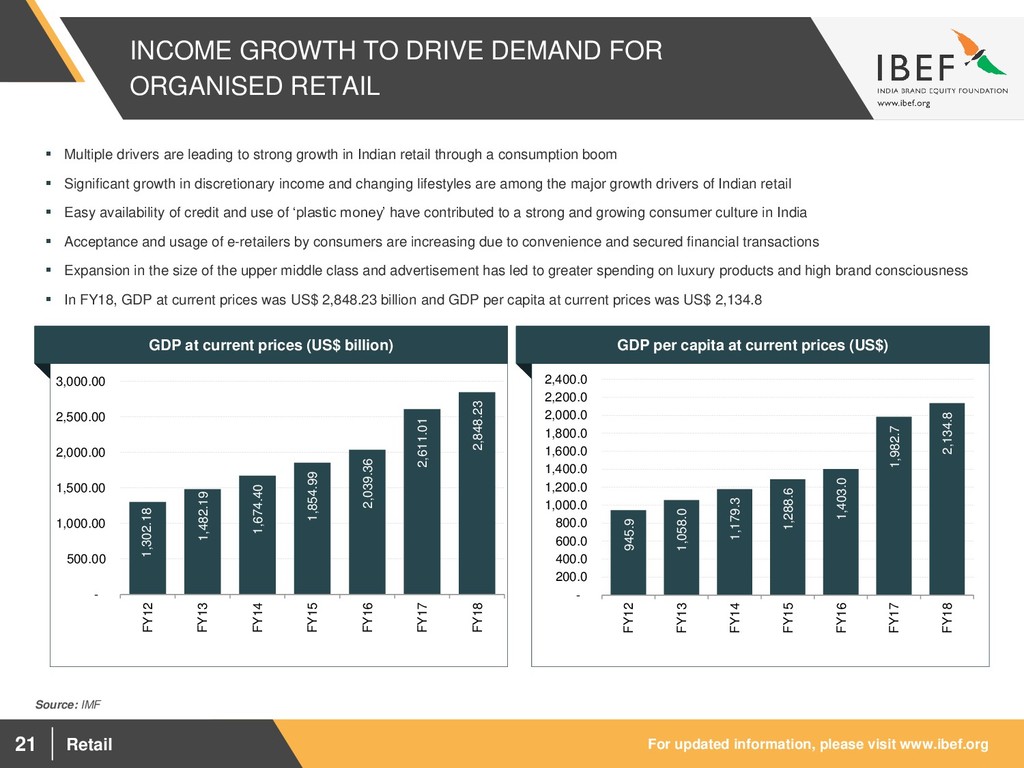
    1,674.40 1,854.99 2,039.36 2,611.01 2,848.23 - 500.00 1,000.00 1,500.00 2,000.00 2,500.00 3,000.00 FY12 FY13 FY14 FY15 FY16 FY17 FY18 945.9 1,058.0 1,179.3 1,288.6 1,403.0 1,982.7 2,134.8 - 200.0 400.0 600.0 800.0 1,000.0 1,200.0 1,400.0 1,600.0 1,800.0 2,000.0 2,200.0 2,400.0 FY12 FY13 FY14 FY15 FY16 FY17 FY18 INCOME GROWTH TO DRIVE DEMAND FOR ORGANISED RETAIL Source: IMF Visakhapatnam port traffic (million tonnes) GDP at current prices (US$ billion) Visakhapatnam port traffic (million tonnes) GDP per capita at current prices (US$)  Multiple drivers are leading to strong growth in Indian retail through a consumption boom  Significant growth in discretionary income and changing lifestyles are among the major growth drivers of Indian retail  Easy availability of credit and use of ‘plastic money’ have contributed to a strong and growing consumer culture in India  Acceptance and usage of e-retailers by consumers are increasing due to convenience and secured financial transactions  Expansion in the size of the upper middle class and advertisement has led to greater spending on luxury products and high brand consciousness  In FY18, GDP at current prices was US$ 2,848.23 billion and GDP per capita at current prices was US$ 2,134.8
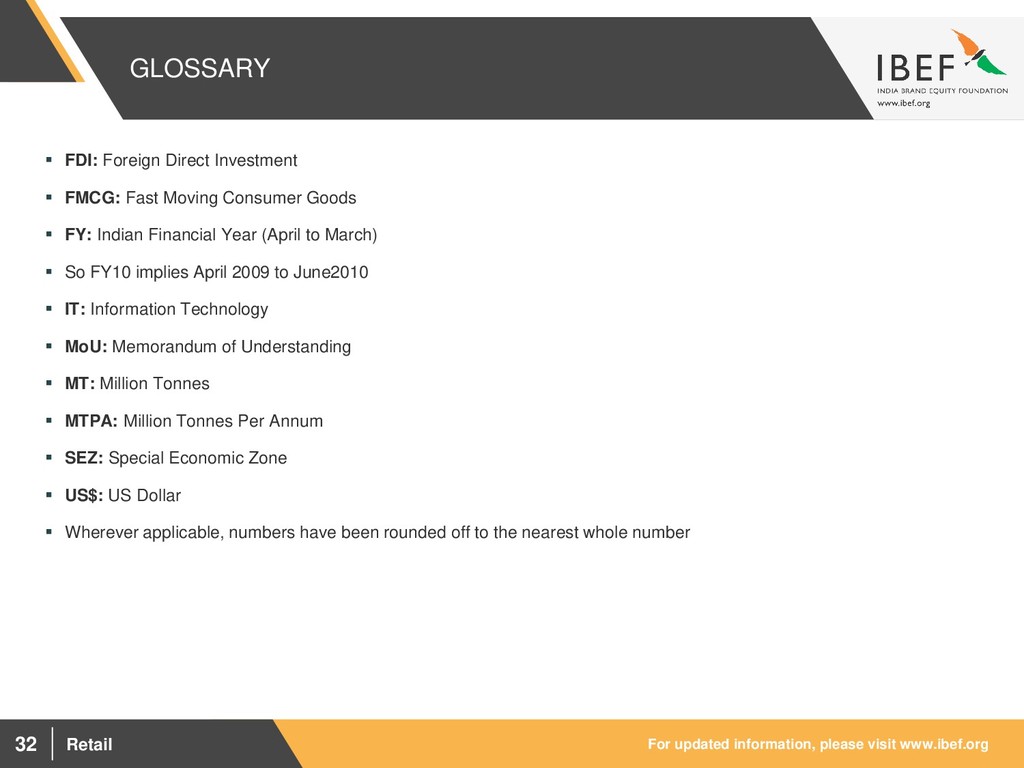
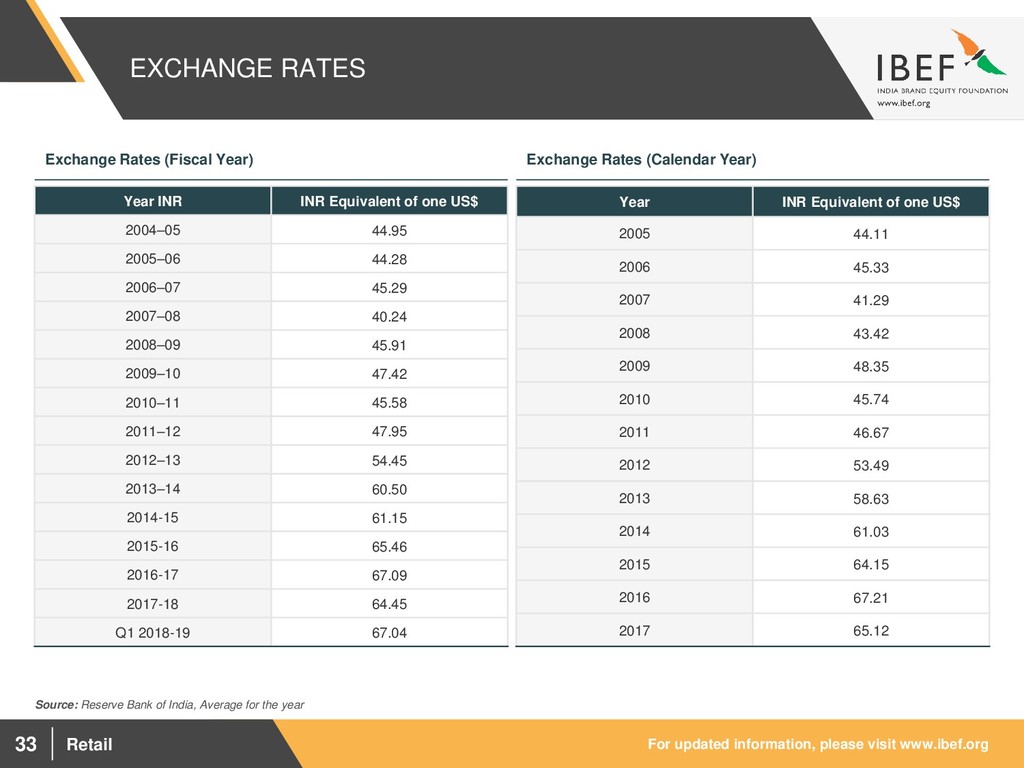
  17. For updated information, please visit www.ibef.org Retail 22 FDI POLICY

    DETAILS ON SINGLE AND MULTI-BRAND RETAIL IN INDIA  Minimum investment cap is US$ 100 million  30 per cent procurement of manufactured or processed products must be from SMEs  Minimum 50 per cent of total FDI must be invested in backend infrastructure (logistics, cold storage, soil testing labs, seed farming and agro-processing units)  Removes middlemen and provides better price to farmers  Development in retail supply chain system  50 per cent of jobs in retail outlet could be reserved for rural youth and a certain amount of farm produce could be required to be procured from poor farmers  To ensure the Public Distribution System (PDS) and Food Security System (FSS), the government reserves the right to procure a certain amount of food grains  Multi-brand retail would keep food and commodity prices under control  Will cut agricultural waste as mega retailers would develop backend infrastructure  Consumers will receive higher quality products at lower prices and with better service  Products to be sold under the same brand internationally. Sale of multi-brand goods is not allowed, even if produced by the same manufacturer  100 per cent FDI allowed in single-brand retail under the automatic route.  Single brand retail entities have been allowed to set off their incremental sourcing of goods from India for global operations during the initial five years starting from the 1st April of the year of the opening of first store, as against the compulsory sourcing requirement of 30 per cent of purchases from India.  100 per cent FDI in retail trading of food products manufactured or produced in India.  Liberalisation of FDI is expected to give a boost to ease of doing business and Make in India. 51 per cent FDI in multi -brand retail Status: Policy passed 100 per cent FDI in single brand retail Status: Policy passed
  18. For updated information, please visit www.ibef.org Retail 23 INDIAN RETAIL

    IS SET TO BENEFIT FROM FDI POLICY Benefits of FDI in Indian retail Infrastructure investment Benefiting Indian manufacturers Increase in employment Wholesale cash and carry trading Single brand product retailing Multi-brand, front-end retail Sector Removing middlemen Automatic Automatic Foreign Investment and Promotion Board Entry route 100% 100% 51% Technological advancement FDI limit
  19. For updated information, please visit www.ibef.org Retail 24 NEW GOODS

    AND SERVICE TAX (GST) WOULD SIMPLIFY TAX STRUCTURE  Goods and Service Tax (GST) as a unified tax regime is expected to lead to a re-evaluation of procurement and distribution arrangements  Removal of excise duty on products would result in cash flow improvements  Elimination of tax cascading is expected to lower input costs and improve profitability  Application of tax at all points of supply chain is likely to require adjustments to profit margins, especially for distributors and retailers  The CII survey 2018, a survey of over 200 businesses about one year of GST indicated moderate retail inflation due to GST  Tax refunds on goods purchased for resale implies a significant reduction in the inventory cost of distribution  Distributors are also expected to experience cash flow from collection of GST in their sales, before remitting it to the government at the end of the tax- filing period  Changes need to be made to accounting and IT systems in order to record transactions in line with GST requirements  Appropriate measures need to be taken to ensure smooth transition to the GST regime through employee training, compliance under GST, customer education and inventory credit tracking Goods and Service Tax (GST) Source: Aranca Research Note: CII: Confederation of Indian Industry
  20. For updated information, please visit www.ibef.org Retail 25 RECENT M&A

    DEALS IN THE INDIAN RETAIL SECTOR Acquirer name Target name Year Deal type Walmart Flipkart May 2018 Acquisition Future Group HyperCity October 2017 Acquisition Berger Paints Chugoku Marine Paints April 2017 Collaboration Myntra InLogg April 2017 Acquisition Flipkart owned Myntra HRX August 2016 Acquisition Myntra MotoGP August 2016 Collaboration Aditya Birla Fashion and Retail Forever 21 (India Business) May 2016 Acquisition Idein Ventures. Infurnia Jan 2016 Joint Venture Paytm Near.in Dec 2015 Acquisition Morgan Stanley Flipkart June 2015 Private Equity InnoVen Capital Sportsbiz Private Limited July 2015 Private Equity Snapdeal Exclusively.in Feb 2015 Acquisition Kalyan Jewellers India Pvt Ltd Warburg Pincus Oct 2014 Private Equity Celio Future Lifestyle Fashions Limited Oct 2014 Private Equity Flipkart Myntra.com May 2014 Acquisition Soft Bank Snapdeal Oct 2014 Private Equity Warburg Pincus Biba Apparels Dec 2013 Private Equity Hassan Food Co Bush Foods Overseas Pvt Ltd Apr 2013 Acquisition Trent Ltd Landmark Ltd Feb 2013 Acquisition Source: Bloomberg and Thomson ONE Banker
  21. For updated information, please visit www.ibef.org Retail 27 GROWTH VALUE

    PROPOSITION Source: KPMG International 2011 Demand Factors Indian retail opportunity Supply Factors Rising incomes and purchasing power Higher brand consciousness Changing consumer preferences and growing urbanisation Growing young population and working women Growing aspiration levels and appetite to experiment Credit availability Easy availability of credit Rapid real estate and infrastructure development R&D, innovation and new product development Development of supply chain improving efficiency Emergence of new categories Expansion plans of existing players
  22. For updated information, please visit www.ibef.org Retail 28 AMPLE GROWTH

    OPPORTUNITIES IN INDIAN RETAIL INDUSTRY  India is the fifth largest preferred retail destination globally  The sector is experiencing exponential growth, with retail development taking place not just in major cities and metros, but also in Tier-II and Tier-III cities Large number of retail outlets  In FY18, rural consumption rose by 9.7 per cent while the urban spending grew at 8.6 per cent. * Rural markets offer significant growth potential  The organised Indian retail industry has begun experiencing an increased level of activity in the private label space  In April 2018, the organised retail sector is forecasted to witness strong growth in the coming years.^  The share of private label strategy in the US and the UK markets is 19 per cent and 39 per cent, respectively, while its share in India is just 6 per cent. Stores like Shopper Stop, Lifestyle generates 15 to 25 per cent revenues from private label brands. Private label opportunities  India‘s price competitiveness attracts large retail players to use it as a sourcing base  Global retailers such as Walmart, GAP, Tesco and JC Penney are increasing their sourcing from India and are moving from third-party buying offices to establishing their own wholly-owned/wholly-managed sourcing and buying offices Sourcing base  Luxury retailing is gaining importance in India. This includes fragrances, gourmet retailing, accessories and jewellery among many others.  The Indian luxury market stood at around US$ 18.6 billion in 2016 from US$ 14.7 billion in 2015 , thereby registering a growth of 26.5 per cent.  Luxury market of India is expected to grow to US$ 30 billion by the end of 2018 from US$ 23.8 billion in 2017 supported by growing exposure of international brands amongst Indian youth and higher purchasing power of the upper class in tier 2 and 3 cities, according to Assocham. Luxury retailing Notes: FMCG - Fast Moving Consumer Goods, * - according to Nielsen, ^ - According to Jefferies report Source: Aranca Research
  23. For updated information, please visit www.ibef.org Retail 30 INDUSTRY ORGANISATIONS

    Visakhapatnam port traffic (million tonnes) Retailers Association of India The Franchising Association of India Address: A-13, Kailash Colony New Delhi – 110048 Tel: 91- 11- 2923 5332 Fax: 91- 11- 2923 3145 Website: www.fai.co.in Address: 111/112, Ascot Centre, Next to Hotel Le Royal Meridien, Sahar Road, Sahar, Andheri (E), Mumbai – 400099. Tel: 91- 22 - 28269527 - 28 Fax: 91- 22- 28269536 E-mail: [email protected] Website: www.rai.net.in
  24. For updated information, please visit www.ibef.org Retail 32 GLOSSARY 

    FDI: Foreign Direct Investment  FMCG: Fast Moving Consumer Goods  FY: Indian Financial Year (April to March)  So FY10 implies April 2009 to June2010  IT: Information Technology  MoU: Memorandum of Understanding  MT: Million Tonnes  MTPA: Million Tonnes Per Annum  SEZ: Special Economic Zone  US$: US Dollar  Wherever applicable, numbers have been rounded off to the nearest whole number
  25. For updated information, please visit www.ibef.org Retail 33 EXCHANGE RATES

    Exchange Rates (Fiscal Year) Exchange Rates (Calendar Year) Year INR INR Equivalent of one US$ 2004–05 44.95 2005–06 44.28 2006–07 45.29 2007–08 40.24 2008–09 45.91 2009–10 47.42 2010–11 45.58 2011–12 47.95 2012–13 54.45 2013–14 60.50 2014-15 61.15 2015-16 65.46 2016-17 67.09 2017-18 64.45 Q1 2018-19 67.04 Year INR Equivalent of one US$ 2005 44.11 2006 45.33 2007 41.29 2008 43.42 2009 48.35 2010 45.74 2011 46.67 2012 53.49 2013 58.63 2014 61.03 2015 64.15 2016 67.21 2017 65.12 Source: Reserve Bank of India, Average for the year
  26. For updated information, please visit www.ibef.org Retail 34 DISCLAIMER India

    Brand Equity Foundation (IBEF) engaged Aranca to prepare this presentation and the same has been prepared by Aranca in consultation with IBEF. All rights reserved. All copyright in this presentation and related works is solely and exclusively owned by IBEF. The same may not be reproduced, wholly or in part in any material form (including photocopying or storing it in any medium by electronic means and whether or not transiently or incidentally to some other use of this presentation), modified or in any manner communicated to any third party except with the written approval of IBEF. This presentation is for information purposes only. While due care has been taken during the compilation of this presentation to ensure that the information is accurate to the best of Aranca and IBEF’s knowledge and belief, the content is not to be construed in any manner whatsoever as a substitute for professional advice. Aranca and IBEF neither recommend nor endorse any specific products or services that may have been mentioned in this presentation and nor do they assume any liability or responsibility for the outcome of decisions taken as a result of any reliance placed on this presentation. Neither Aranca nor IBEF shall be liable for any direct or indirect damages that may arise due to any act or omission on the part of the user due to any reliance placed or guidance taken from any portion of this presentation.