Upgrade to Pro — share decks privately, control downloads, hide ads and more …

IstioとGrafanaで実現する多言語に対応したモニタリング基盤

 IstioとGrafanaで実現する多言語に対応したモニタリング基盤

マイクロサービスが日々増え続けているUzabaseの開発環境では、多くの言語(Kotlin, Clojure, Rust, Go, Elixer...)が採用されています。多岐に渡るプロダクト・マイクロサービスを管理するSREがどうやって統一的にロギング・モニタリングしているかをお話します。

Avatar for kterui9019

kterui9019

August 01, 2022
Tweet

Other Decks in Programming

Transcript

  1. The four golden signals of monitoring are latency, traffic, errors,

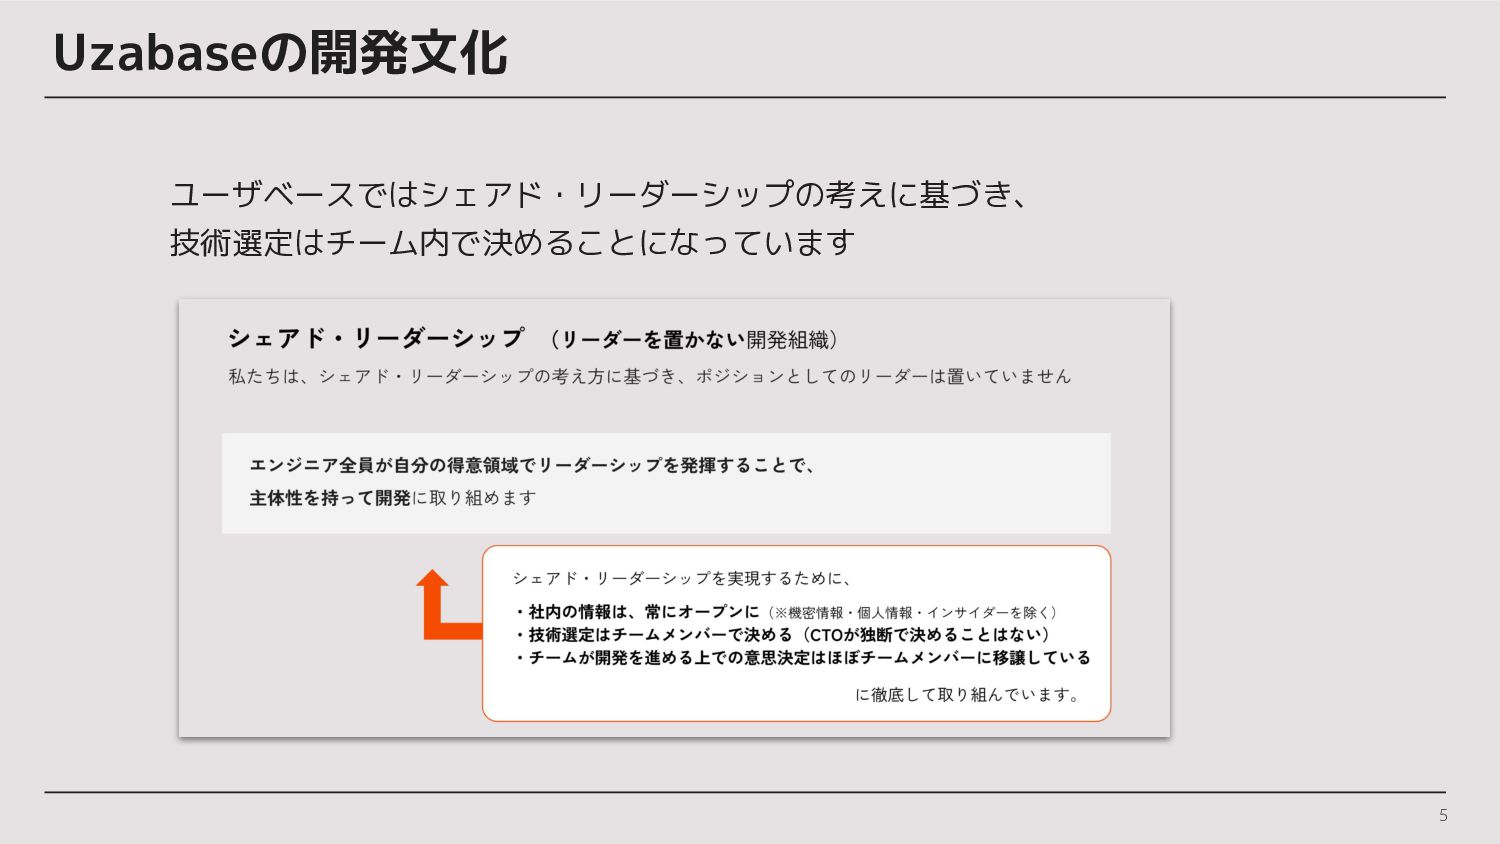
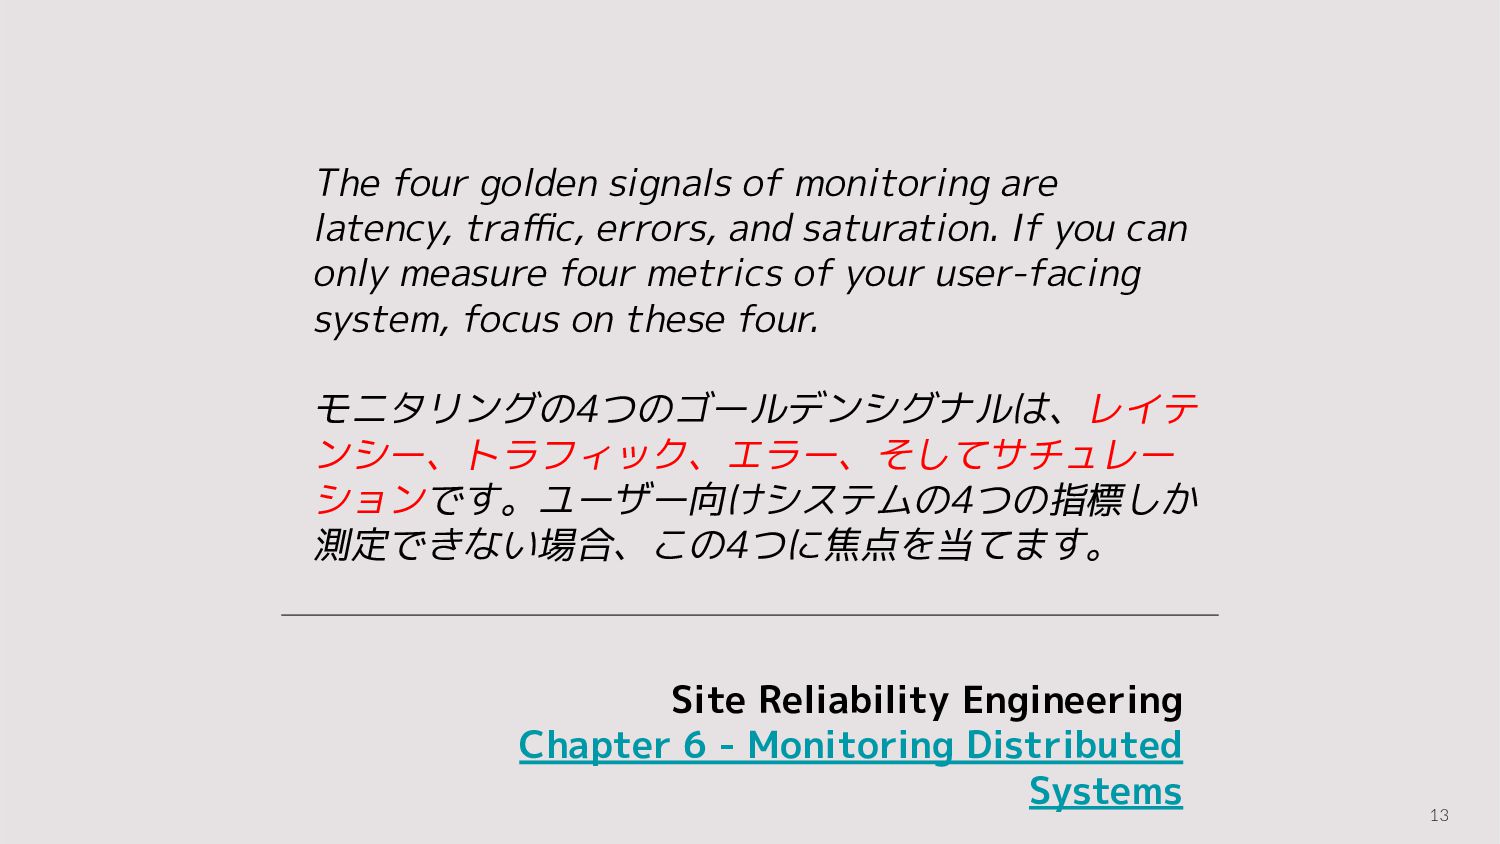
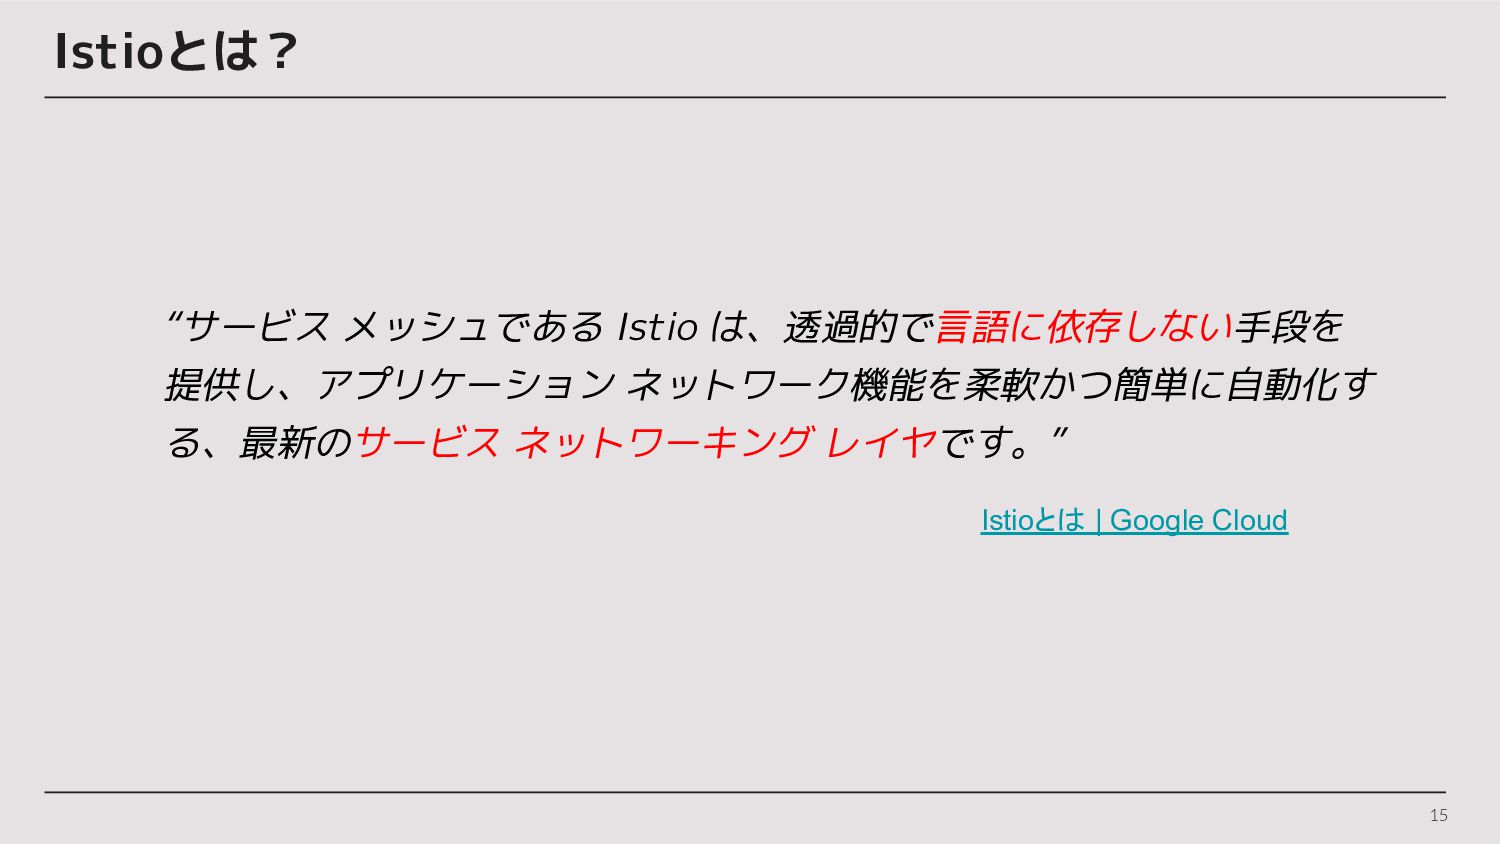
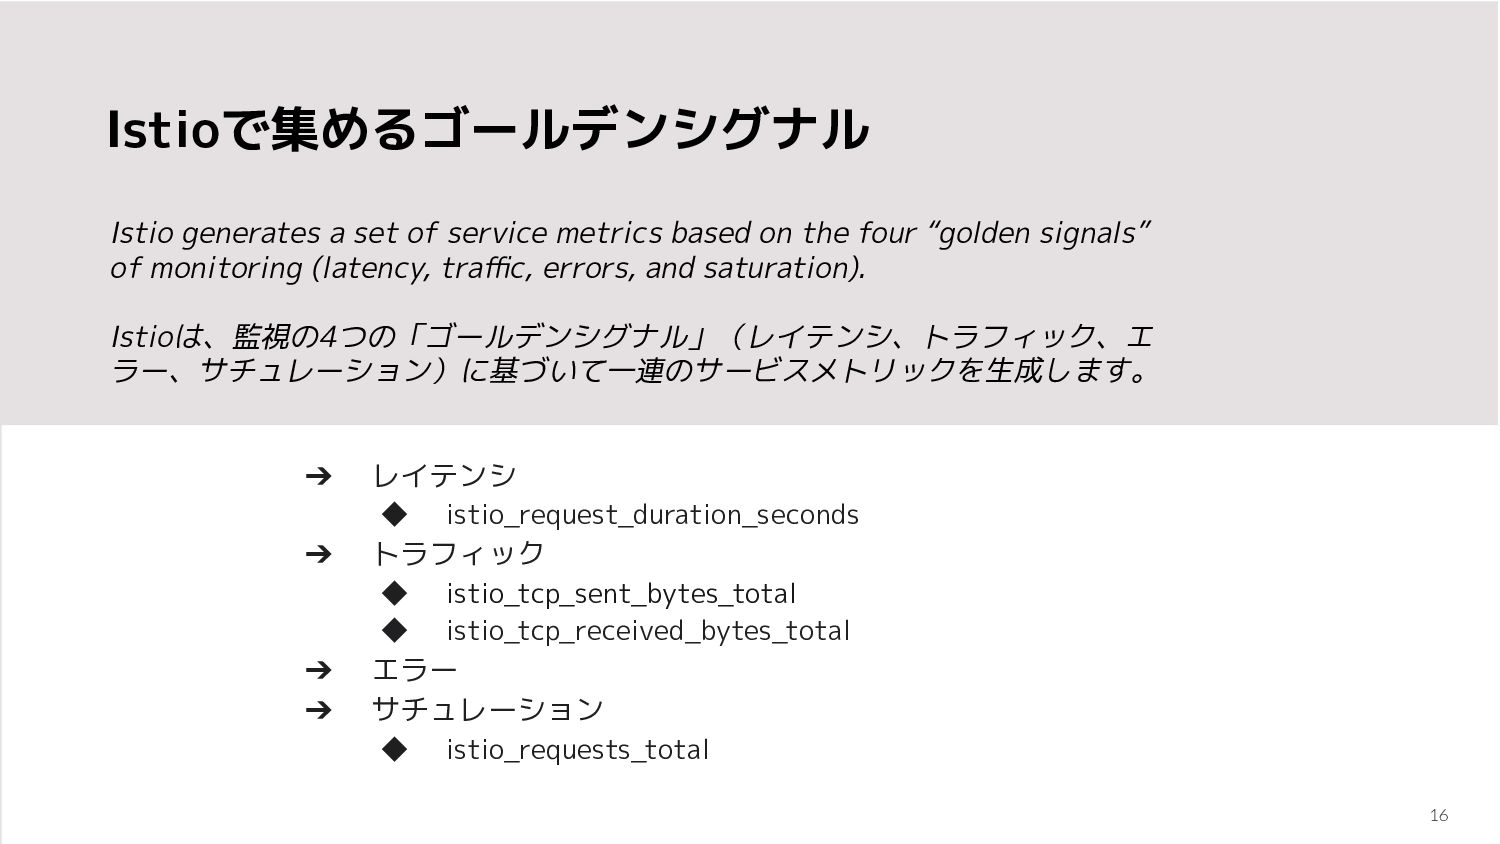
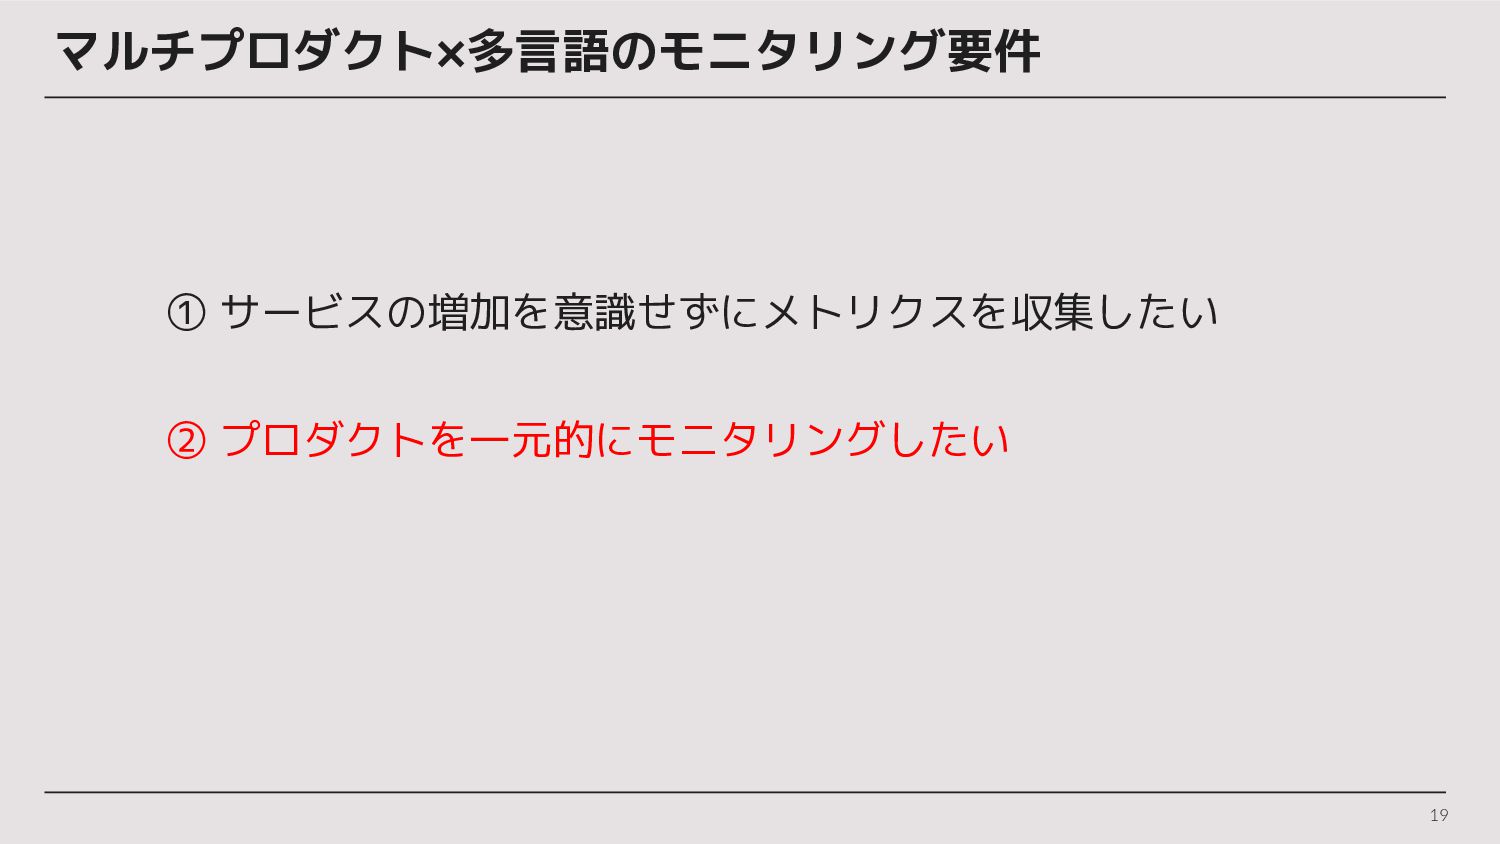
    and saturation. If you can only measure four metrics of your user-facing system, focus on these four. モニタリングの4つのゴールデンシグナルは、レイテ ンシー、トラフィック、エラー、そしてサチュレー ションです。ユーザー向けシステムの4つの指標しか 測定できない場合、この4つに焦点を当てます。 Site Reliability Engineering Chapter 6 - Monitoring Distributed Systems 13
  2. 14

  3. Istioで集めるゴールデンシグナル Istio generates a set of service metrics based on

    the four “golden signals” of monitoring (latency, traffic, errors, and saturation). Istioは、監視の4つの「ゴールデンシグナル」(レイテンシ、トラフィック、エ ラー、サチュレーション)に基づいて一連のサービスメトリックを生成します。 ➔ レイテンシ ◆ istio_request_duration_seconds ➔ トラフィック ◆ istio_tcp_sent_bytes_total ◆ istio_tcp_received_bytes_total ➔ エラー ➔ サチュレーション ◆ istio_requests_total 16
  4. Prometheusフェデレーション 22 scrape_configs: - job_name: 'federate-{{CLUSTER_NAME}}' scrape_interval: 15s honor_labels: true

    metrics_path: '/federate' params: 'match[]': - '{job="kubernetes-pods"}' static_configs: - targets: - 'prometheus.{{INGRESS_DOMAIN}}' labels: cluster: '{{CLUSTER_NAME}}' Prometheusサーバではフェデレーション用に /federateパスが公開されている Configure Prometheus federation