Lomas [email protected] www.kaleidicassociates.com Kaleidic Associates Historic Market Thoughts – 3rd Jan 2009 Summary Since I turned bullish on bunds on 3rd July 2008 we have seen a wondrous rally with market commentators expecting QE to be implemented across regions. It is now time to exit longs and look for opportunities to establish shorts – either near current levels via options, or using countertrend technical indicators to short outright with a tight stop (making several attempts if necessary). Evidence may emerge to suggest that this is a turn of a significant order. At this juncture a great deal is discounted - there is a good chance we see a very substantial selloff associated with an improvement in animal spirits from their present state of unrelenting gloom and despondency. Even the permabulls have come round to the depression scenario. The response of the authorities has been without precedent - the US has a new president, and perhaps confidence in the new administration may stave off the worst consequences of the epidemic contagion of fear - for now, at least. It is certain that for the time being we shall avoid the 29-33 collapse that was associated with every sovereign issuer in Europe except Britain, and much of Latin America and Asia defaulting as well as large numbers of banks in the US (in the days before deposit insurance). Buy commodity-related equities, buy breakevens, and sell global fixed income. Why? Maybe it’s just time. Thoughts Bonds and economic activity Since I turned bullish on European fixed income on the 3rd of July ahead of the ECB meeting, fixed income markets globally have seen a wondrous rally with market commentators expecting quantitative easing to be implemented across regions. I initially expected upside for ERZ9 from 94.63 towards the 95.77/96.00 level, but that proved much too conservative and the contract settled on Friday at 97.795. I think it is now time to exit longs and look for opportunities to establish shorts (either near current levels via options, or using countertrend technical indicators to short outright with a tight step making several attempts, if necessary). Time horizon for the shorts will be initially tactical, but as the trade proceeds evidence may emerge to suggest that it is a turn of a more significant order. Why be bearish? After all, the change in Nonfarm Payrolls for November was a shocking -533K (vs survey -335) and prior month was revised down from -240k to -320K. This is pretty consistent
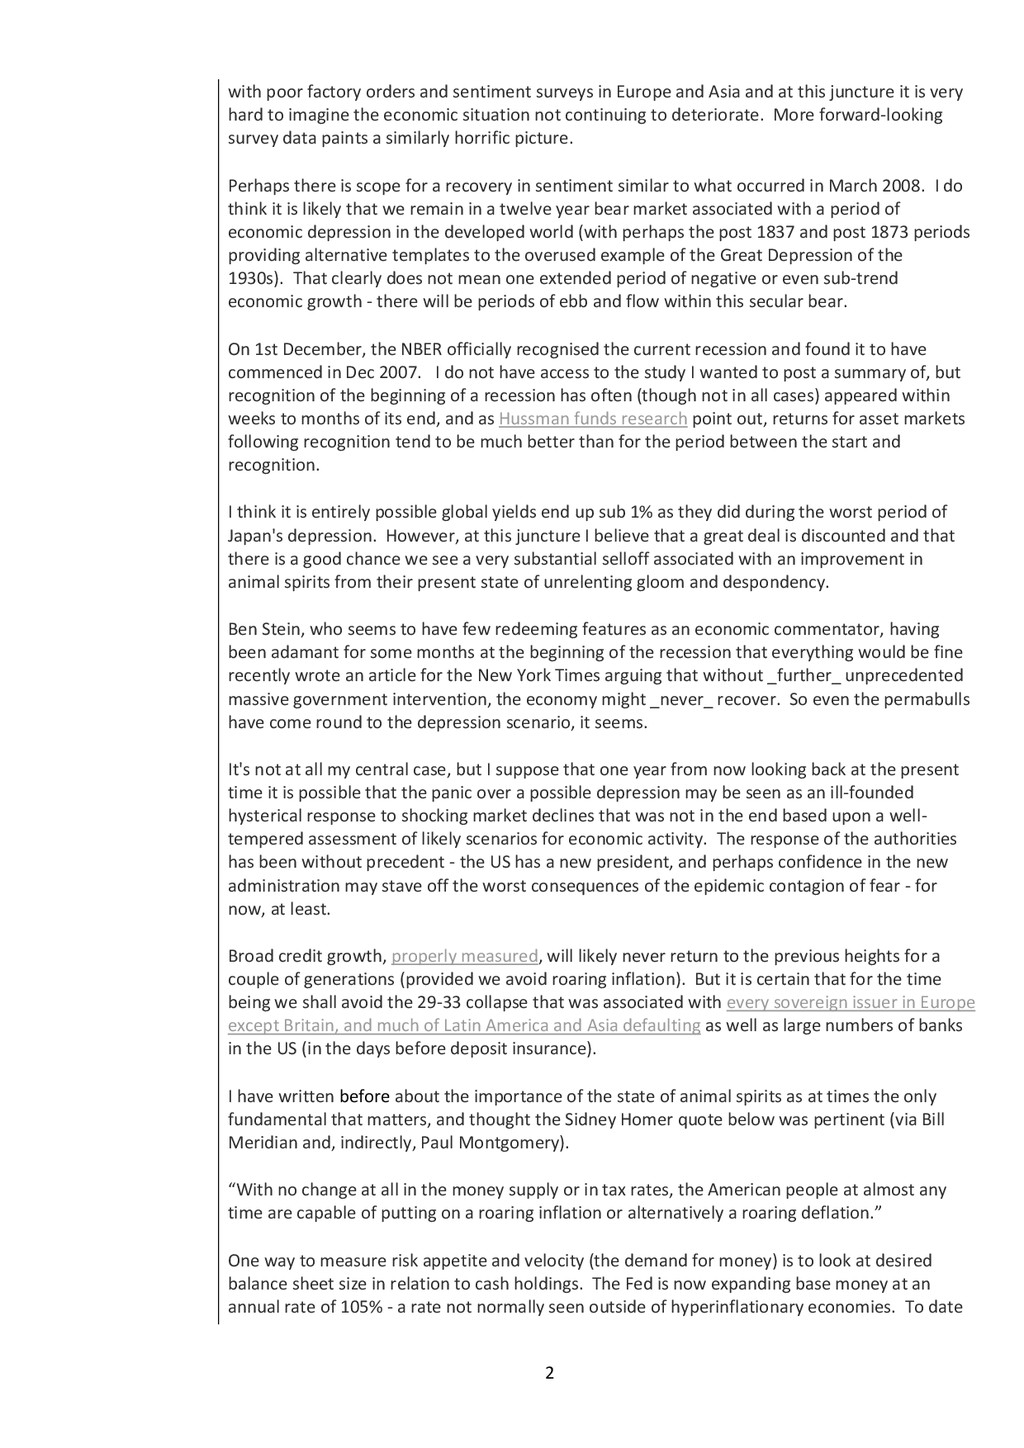
and Asia and at this juncture it is very hard to imagine the economic situation not continuing to deteriorate. More forward-looking survey data paints a similarly horrific picture. Perhaps there is scope for a recovery in sentiment similar to what occurred in March 2008. I do think it is likely that we remain in a twelve year bear market associated with a period of economic depression in the developed world (with perhaps the post 1837 and post 1873 periods providing alternative templates to the overused example of the Great Depression of the 1930s). That clearly does not mean one extended period of negative or even sub-trend economic growth - there will be periods of ebb and flow within this secular bear. On 1st December, the NBER officially recognised the current recession and found it to have commenced in Dec 2007. I do not have access to the study I wanted to post a summary of, but recognition of the beginning of a recession has often (though not in all cases) appeared within weeks to months of its end, and as Hussman funds research point out, returns for asset markets following recognition tend to be much better than for the period between the start and recognition. I think it is entirely possible global yields end up sub 1% as they did during the worst period of Japan's depression. However, at this juncture I believe that a great deal is discounted and that there is a good chance we see a very substantial selloff associated with an improvement in animal spirits from their present state of unrelenting gloom and despondency. Ben Stein, who seems to have few redeeming features as an economic commentator, having been adamant for some months at the beginning of the recession that everything would be fine recently wrote an article for the New York Times arguing that without _further_ unprecedented massive government intervention, the economy might _never_ recover. So even the permabulls have come round to the depression scenario, it seems. It's not at all my central case, but I suppose that one year from now looking back at the present time it is possible that the panic over a possible depression may be seen as an ill-founded hysterical response to shocking market declines that was not in the end based upon a well- tempered assessment of likely scenarios for economic activity. The response of the authorities has been without precedent - the US has a new president, and perhaps confidence in the new administration may stave off the worst consequences of the epidemic contagion of fear - for now, at least. Broad credit growth, properly measured, will likely never return to the previous heights for a couple of generations (provided we avoid roaring inflation). But it is certain that for the time being we shall avoid the 29-33 collapse that was associated with every sovereign issuer in Europe except Britain, and much of Latin America and Asia defaulting as well as large numbers of banks in the US (in the days before deposit insurance). I have written before about the importance of the state of animal spirits as at times the only fundamental that matters, and thought the Sidney Homer quote below was pertinent (via Bill Meridian and, indirectly, Paul Montgomery). “With no change at all in the money supply or in tax rates, the American people at almost any time are capable of putting on a roaring inflation or alternatively a roaring deflation.” One way to measure risk appetite and velocity (the demand for money) is to look at desired balance sheet size in relation to cash holdings. The Fed is now expanding base money at an annual rate of 105% - a rate not normally seen outside of hyperinflationary economies. To date
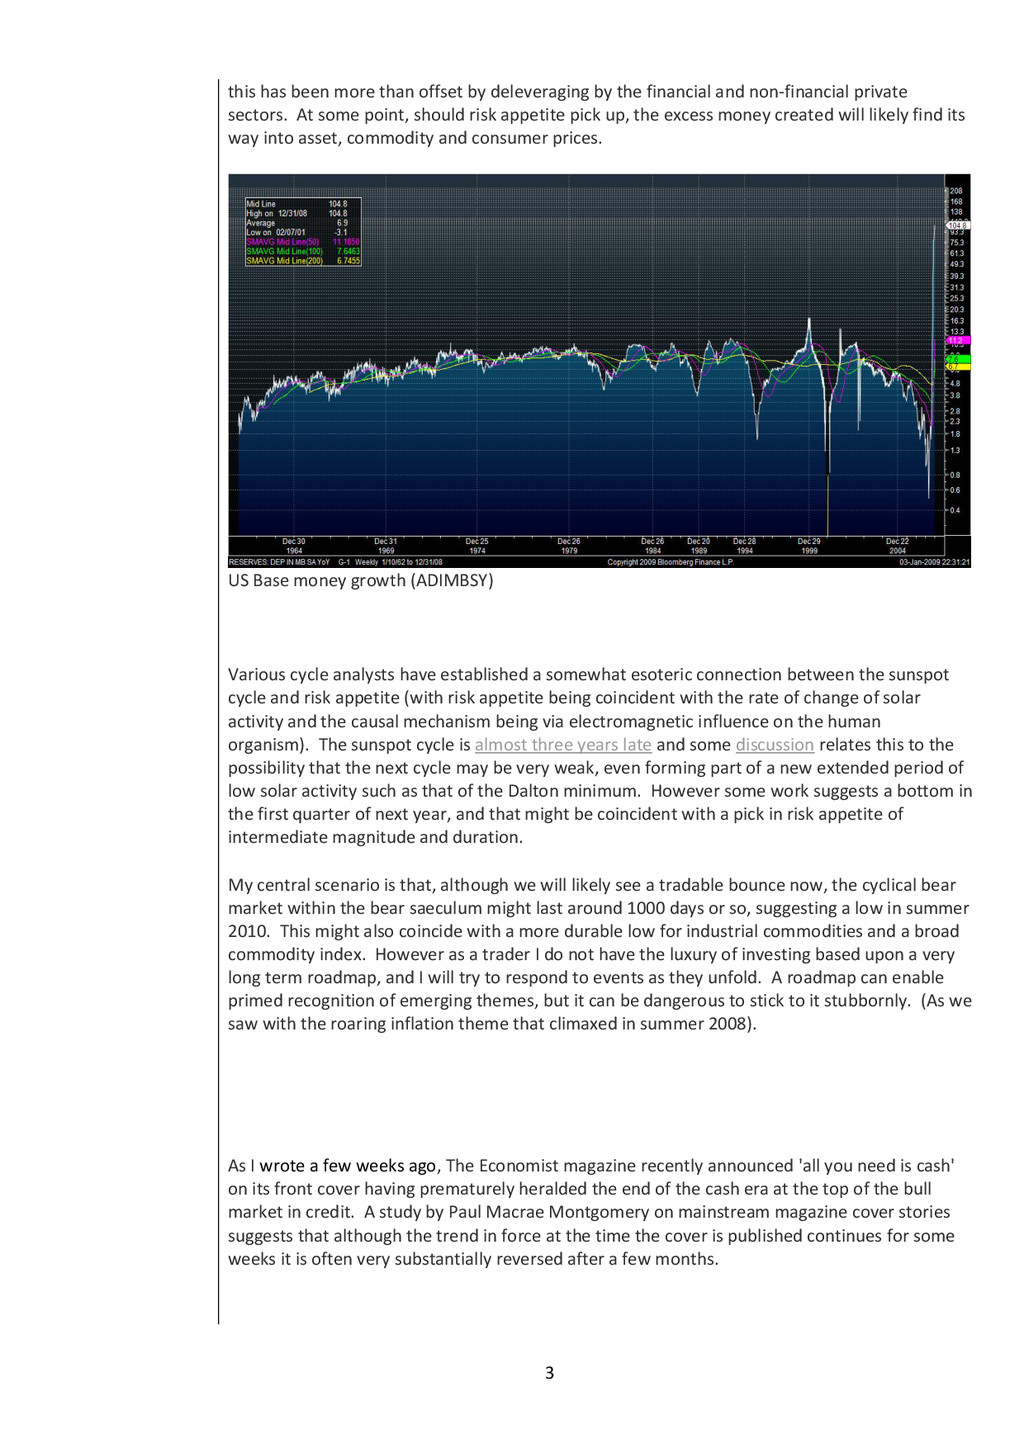
the financial and non-financial private sectors. At some point, should risk appetite pick up, the excess money created will likely find its way into asset, commodity and consumer prices. US Base money growth (ADIMBSY) Various cycle analysts have established a somewhat esoteric connection between the sunspot cycle and risk appetite (with risk appetite being coincident with the rate of change of solar activity and the causal mechanism being via electromagnetic influence on the human organism). The sunspot cycle is almost three years late and some discussion relates this to the possibility that the next cycle may be very weak, even forming part of a new extended period of low solar activity such as that of the Dalton minimum. However some work suggests a bottom in the first quarter of next year, and that might be coincident with a pick in risk appetite of intermediate magnitude and duration. My central scenario is that, although we will likely see a tradable bounce now, the cyclical bear market within the bear saeculum might last around 1000 days or so, suggesting a low in summer 2010. This might also coincide with a more durable low for industrial commodities and a broad commodity index. However as a trader I do not have the luxury of investing based upon a very long term roadmap, and I will try to respond to events as they unfold. A roadmap can enable primed recognition of emerging themes, but it can be dangerous to stick to it stubbornly. (As we saw with the roaring inflation theme that climaxed in summer 2008). As I wrote a few weeks ago, The Economist magazine recently announced 'all you need is cash' on its front cover having prematurely heralded the end of the cash era at the top of the bull market in credit. A study by Paul Macrae Montgomery on mainstream magazine cover stories suggests that although the trend in force at the time the cover is published continues for some weeks it is often very substantially reversed after a few months.
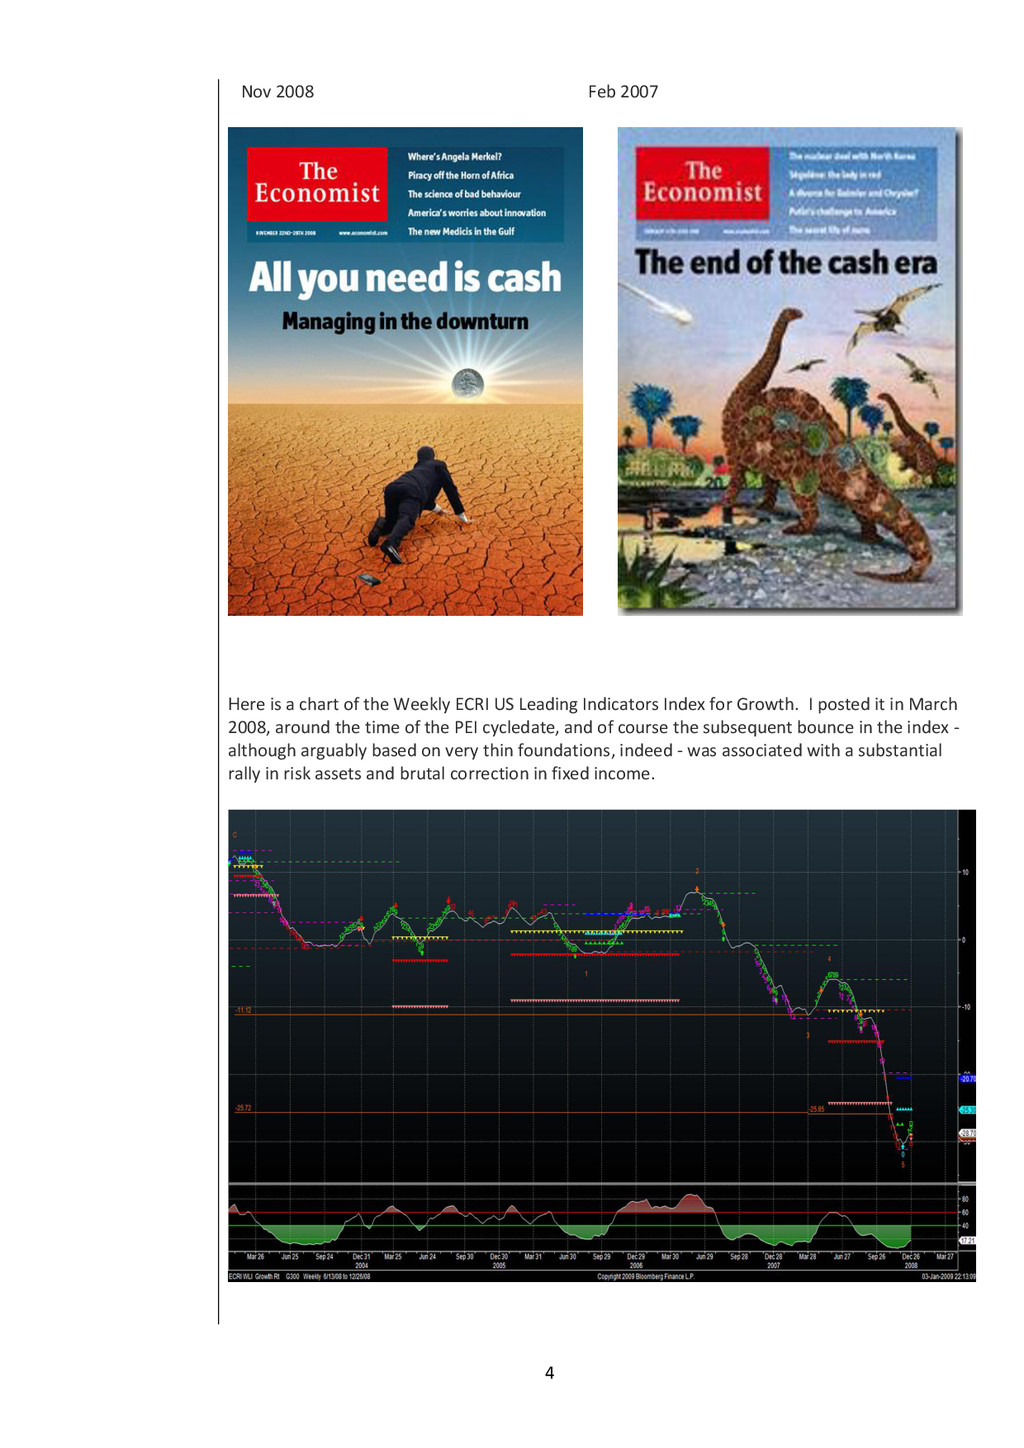
the Weekly ECRI US Leading Indicators Index for Growth. I posted it in March 2008, around the time of the PEI cycledate, and of course the subsequent bounce in the index - although arguably based on very thin foundations, indeed - was associated with a substantial rally in risk assets and brutal correction in fixed income.
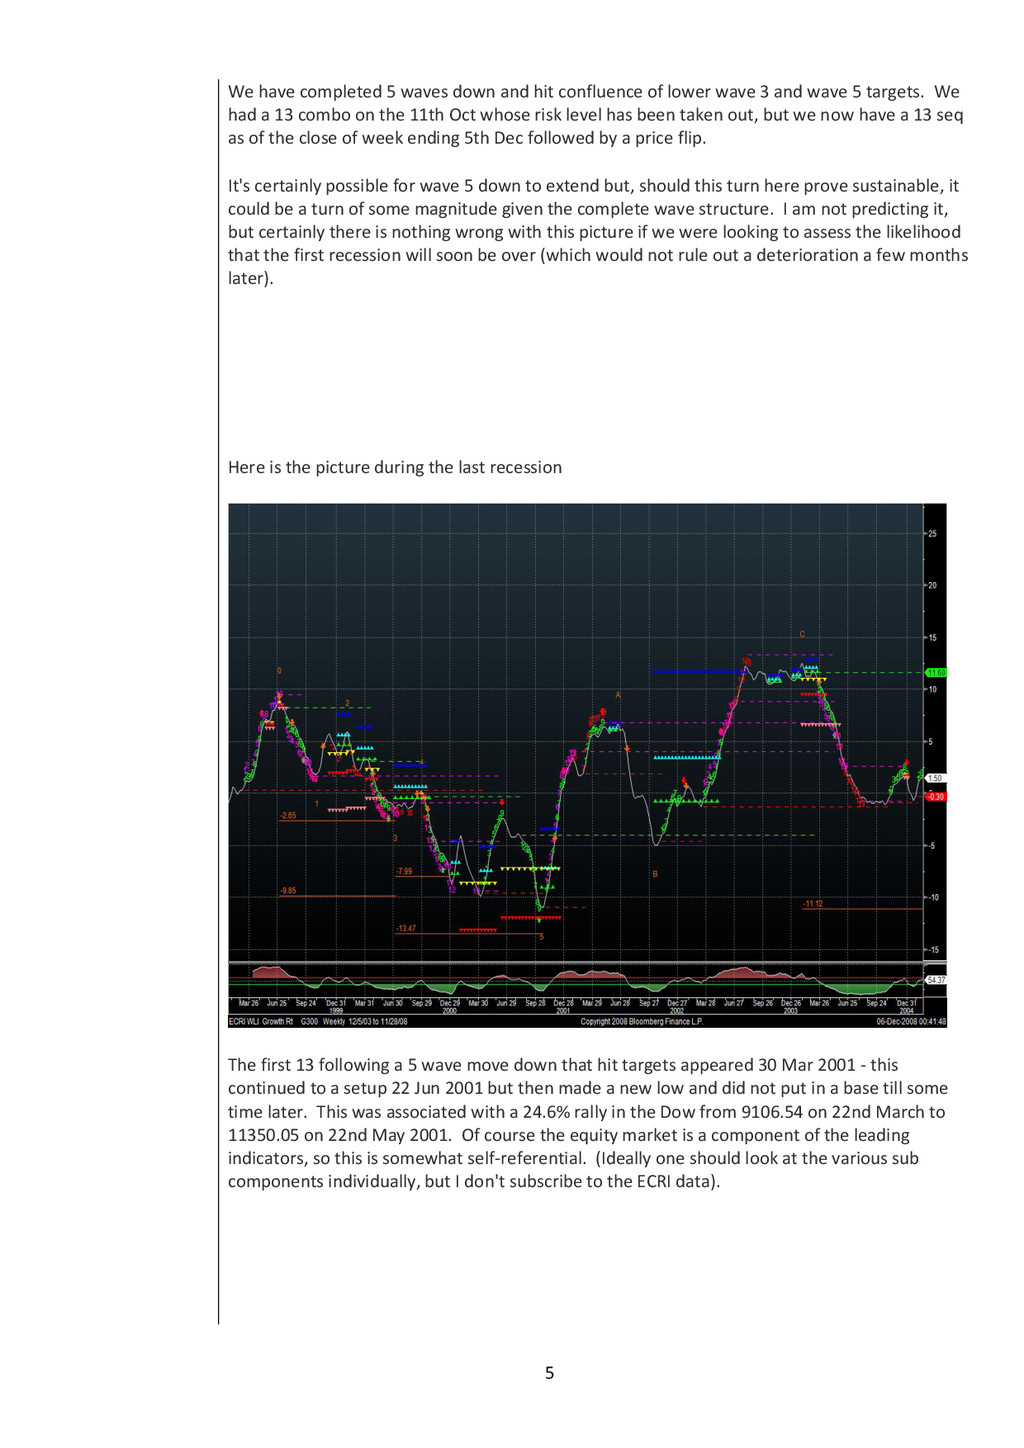
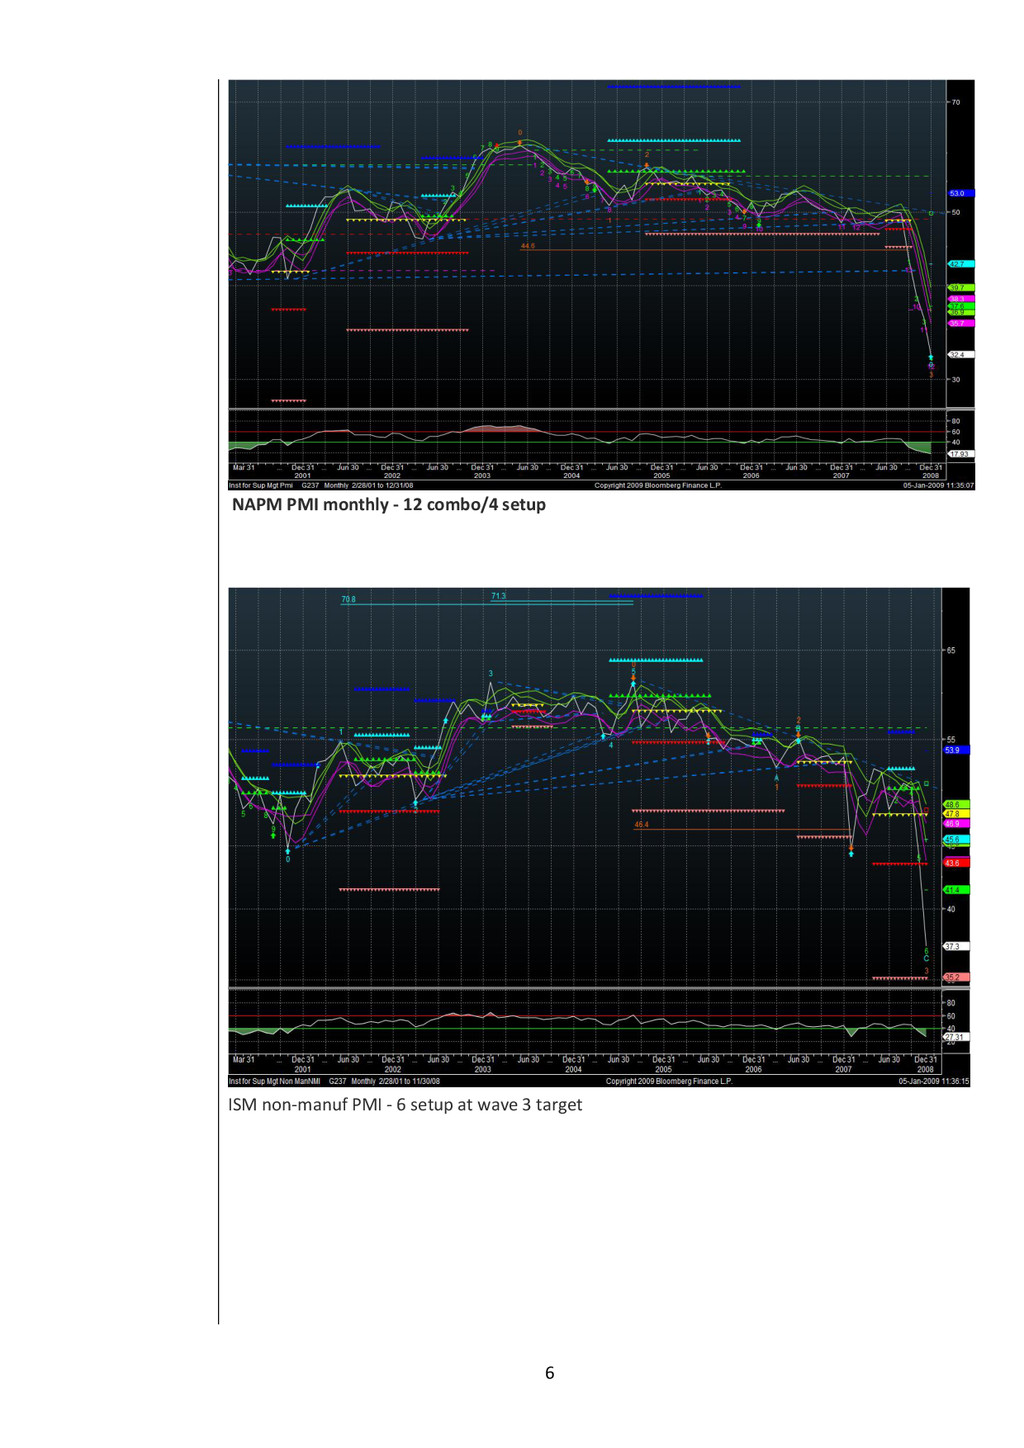
of lower wave 3 and wave 5 targets. We had a 13 combo on the 11th Oct whose risk level has been taken out, but we now have a 13 seq as of the close of week ending 5th Dec followed by a price flip. It's certainly possible for wave 5 down to extend but, should this turn here prove sustainable, it could be a turn of some magnitude given the complete wave structure. I am not predicting it, but certainly there is nothing wrong with this picture if we were looking to assess the likelihood that the first recession will soon be over (which would not rule out a deterioration a few months later). Here is the picture during the last recession The first 13 following a 5 wave move down that hit targets appeared 30 Mar 2001 - this continued to a setup 22 Jun 2001 but then made a new low and did not put in a base till some time later. This was associated with a 24.6% rally in the Dow from 9106.54 on 22nd March to 11350.05 on 22nd May 2001. Of course the equity market is a component of the leading indicators, so this is somewhat self-referential. (Ideally one should look at the various sub components individually, but I don't subscribe to the ECRI data).
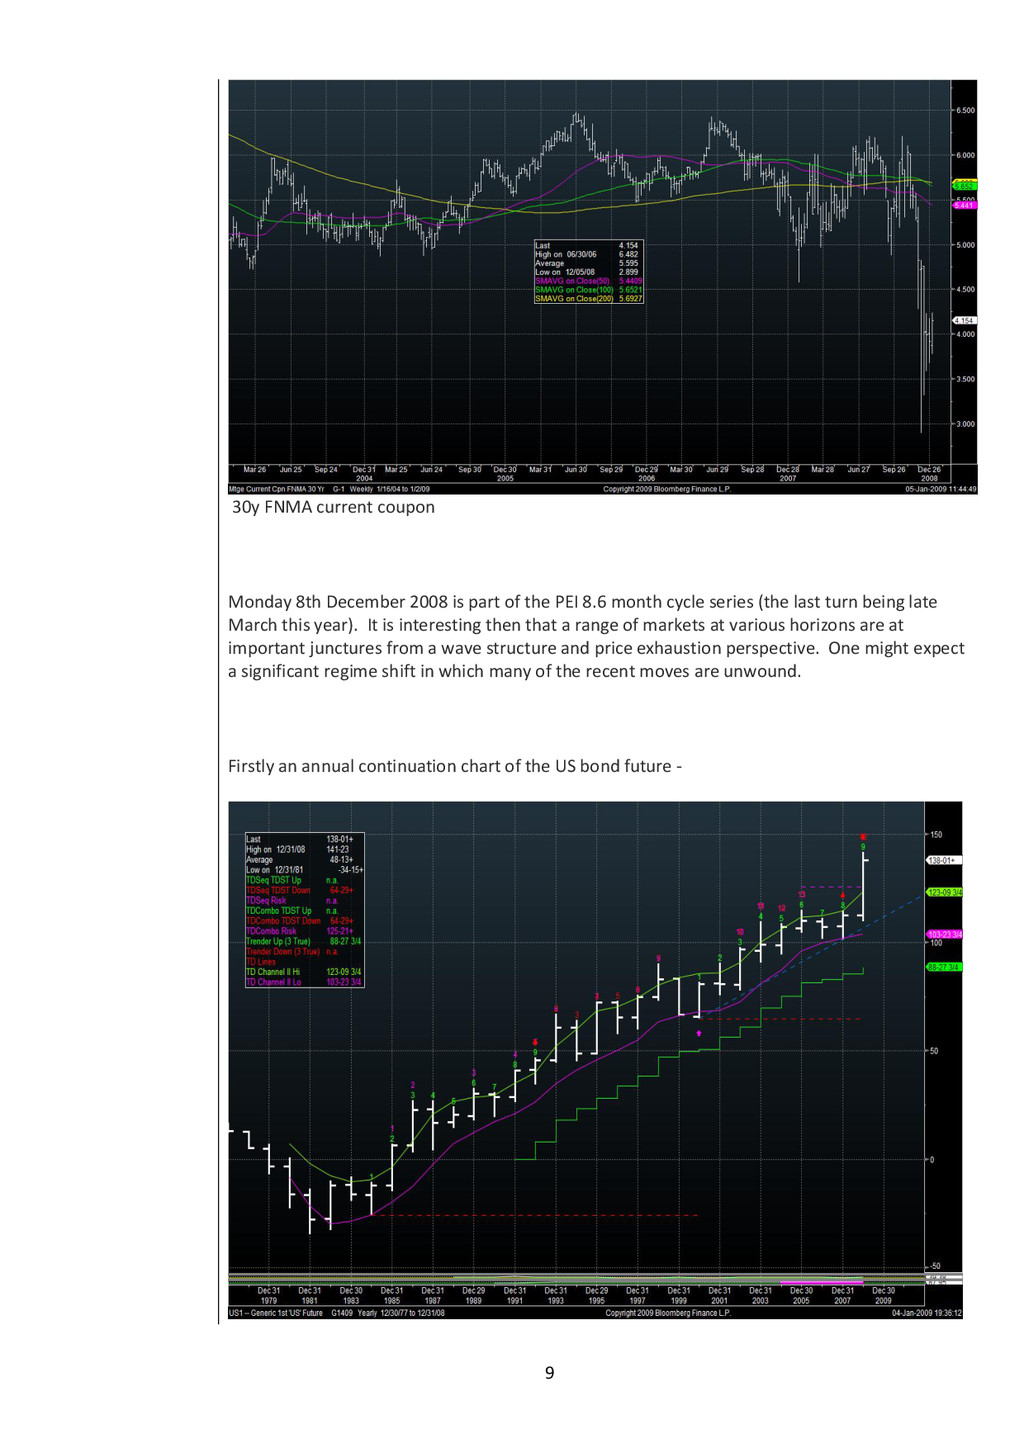
part of the PEI 8.6 month cycle series (the last turn being late March this year). It is interesting then that a range of markets at various horizons are at important junctures from a wave structure and price exhaustion perspective. One might expect a significant regime shift in which many of the recent moves are unwound. Firstly an annual continuation chart of the US bond future -
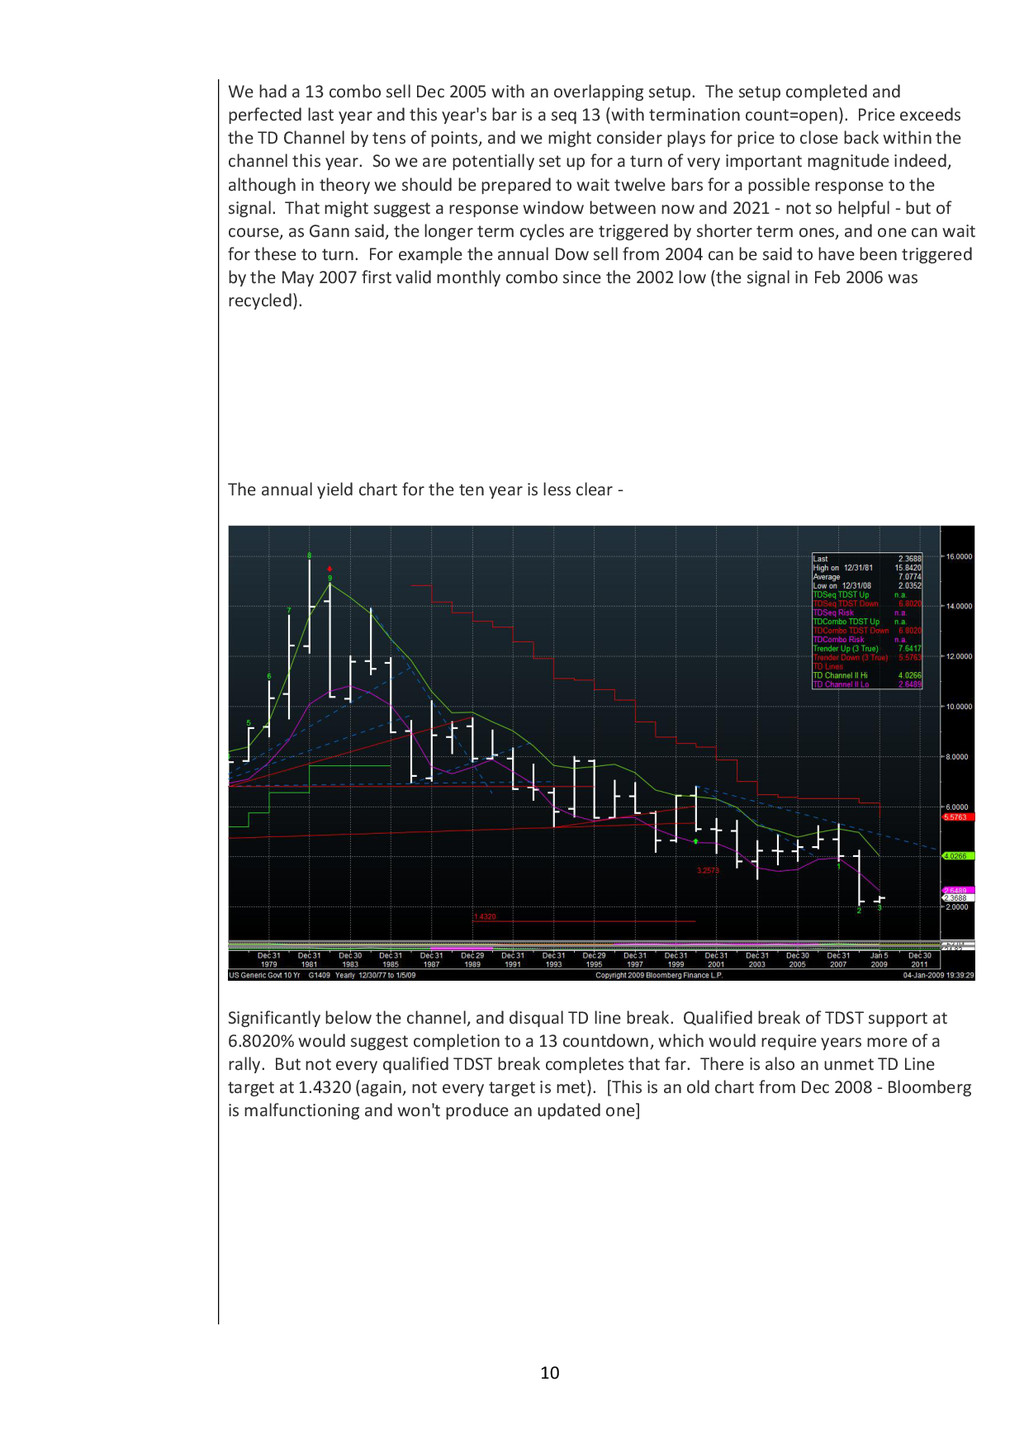
an overlapping setup. The setup completed and perfected last year and this year's bar is a seq 13 (with termination count=open). Price exceeds the TD Channel by tens of points, and we might consider plays for price to close back within the channel this year. So we are potentially set up for a turn of very important magnitude indeed, although in theory we should be prepared to wait twelve bars for a possible response to the signal. That might suggest a response window between now and 2021 - not so helpful - but of course, as Gann said, the longer term cycles are triggered by shorter term ones, and one can wait for these to turn. For example the annual Dow sell from 2004 can be said to have been triggered by the May 2007 first valid monthly combo since the 2002 low (the signal in Feb 2006 was recycled). The annual yield chart for the ten year is less clear - Significantly below the channel, and disqual TD line break. Qualified break of TDST support at 6.8020% would suggest completion to a 13 countdown, which would require years more of a rally. But not every qualified TDST break completes that far. There is also an unmet TD Line target at 1.4320 (again, not every target is met). [This is an old chart from Dec 2008 - Bloomberg is malfunctioning and won't produce an updated one]
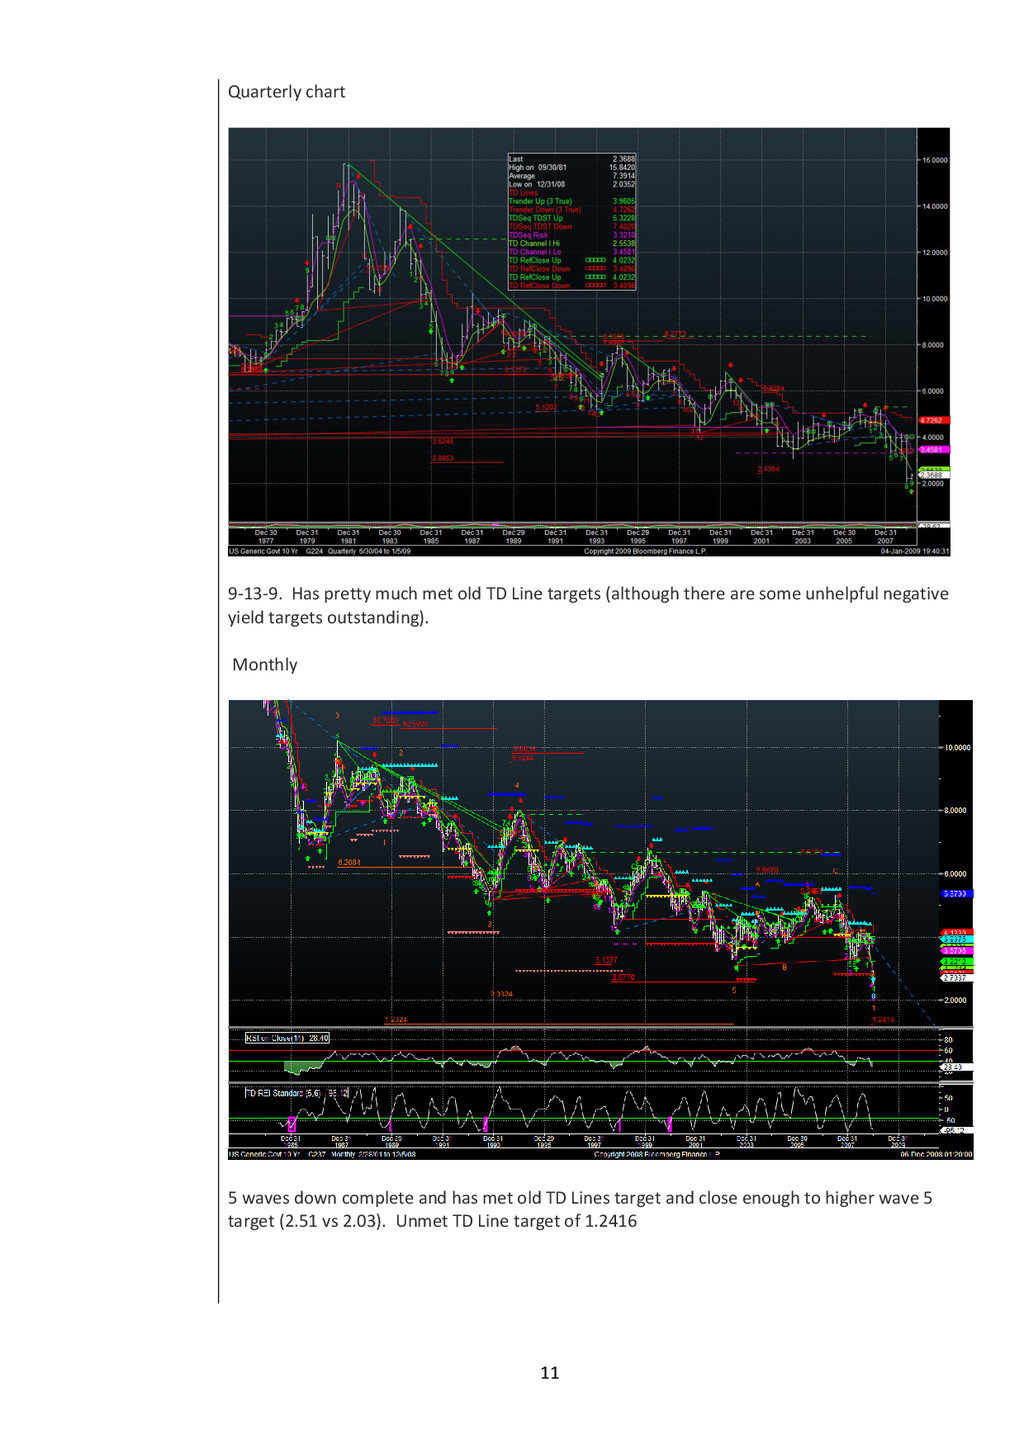
Line targets (although there are some unhelpful negative yield targets outstanding). Monthly 5 waves down complete and has met old TD Lines target and close enough to higher wave 5 target (2.51 vs 2.03). Unmet TD Line target of 1.2416
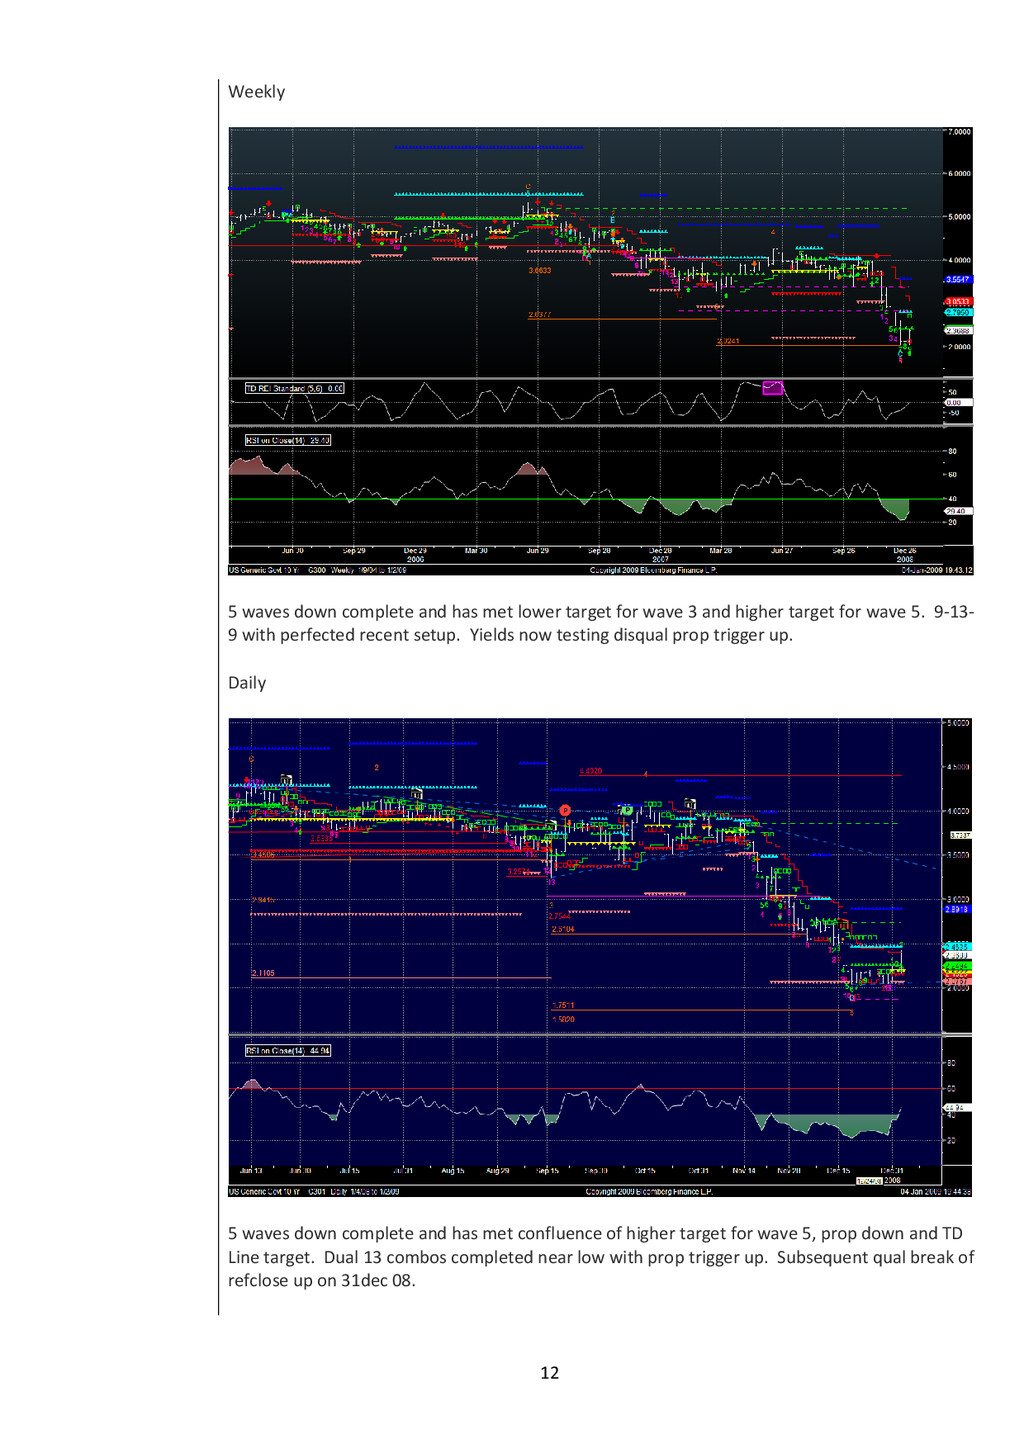
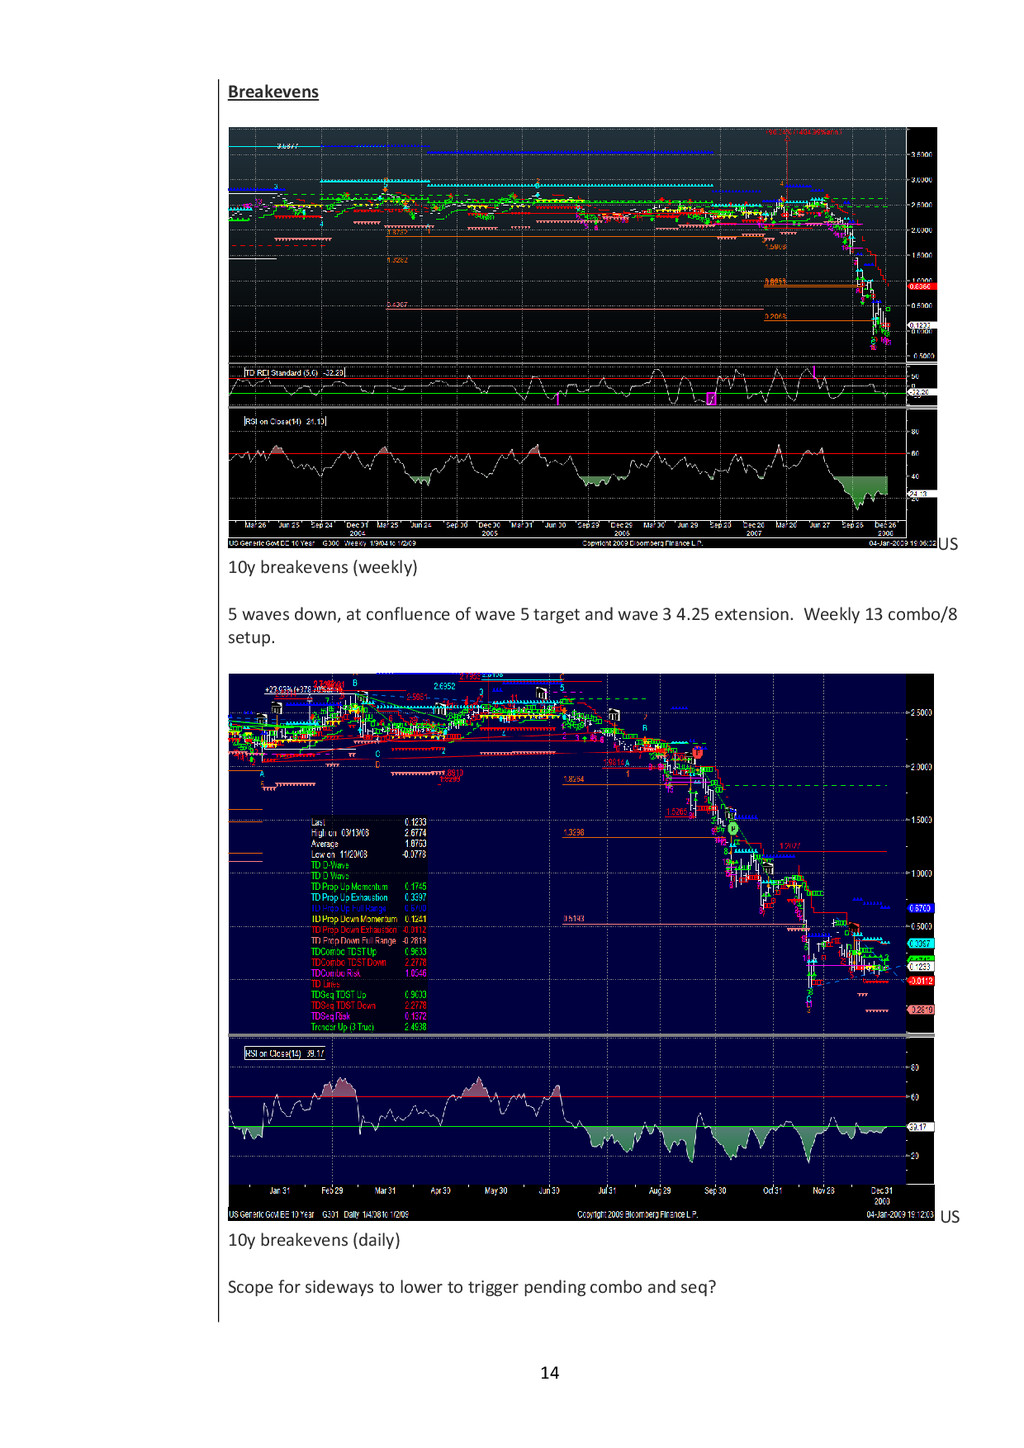
target for wave 3 and higher target for wave 5. 9-13- 9 with perfected recent setup. Yields now testing disqual prop trigger up. Daily 5 waves down complete and has met confluence of higher target for wave 5, prop down and TD Line target. Dual 13 combos completed near low with prop trigger up. Subsequent qual break of refclose up on 31dec 08.
confluence of wave 5 target and wave 3 4.25 extension. Weekly 13 combo/8 setup. US 10y breakevens (daily) Scope for sideways to lower to trigger pending combo and seq?
The information, tools and material presented herein are provided for informational purposes only and are not to be used or considered as an offer or a solicitation to buy or subscribe for securities, investment products or other financial instruments, nor to constitute any advice or recommendation with respect to such securities, investment products or other financial instruments. This research report is prepared for general circulation. It does not have regard to the specific investment objectives, financial situation and the particular needs of any specific person who may receive this report. You should independently evaluate particular investments and consult an independent financial adviser before making any investments or entering into any transaction in relation to any securities mentioned in this report. Author & Publisher Subscriptions and enquiries LAEETH ISHARC KALEIDIC ASSOCIATES Research Editor & Subscription Tel: + 44 7841 260 462 [email protected] Email: [email protected] Web: www.kaleidicassociates.com
![1 Kaleidic Associates Laeeth Isharc Partner [email protected] Enquiries – Rosie](https://files.speakerdeck.com/presentations/9ddab6e017d64495927c32428261a547/slide_0.jpg)