Upgrade to Pro
— share decks privately, control downloads, hide ads and more …
Speaker Deck
Features
Speaker Deck
PRO
Sign in
Sign up for free
Search
Search
Data Driven Deviations
Search
Sponsored
·
Your Podcast. Everywhere. Effortlessly.
Share. Educate. Inspire. Entertain. You do you. We'll handle the rest.
→
Max Humber
June 20, 2017
250
3
Share
Embed
Copy iframe code
Copy JS code
Copy link
Start on current slide
Data Driven Deviations
Big Data Toronto / June 20, 2017 at 3:30 - 4:00pm
Max Humber
June 20, 2017
More Decks by Max Humber
See All by Max Humber
Building Better Budgets
maxhumber
7
77
Accessible Algorithms
maxhumber
7
120
Amusing Algorithms
maxhumber
3
280
Data Creationism
maxhumber
4
660
Data Engineering for Data Scientists
maxhumber
6
1.2k
Personal Pynance
maxhumber
3
530
Visualizing Models
maxhumber
2
530
Webscraping with rvest and purrr
maxhumber
4
1.6k
Patsy (PyData Berlin)
maxhumber
4
300
Featured
See All Featured
Everyday Curiosity
cassininazir
0
250
How GitHub (no longer) Works
holman
316
150k
Future Trends and Review - Lecture 12 - Web Technologies (1019888BNR)
signer
PRO
0
3.6k
I Don’t Have Time: Getting Over the Fear to Launch Your Podcast
jcasabona
34
2.8k
Unsuck your backbone
ammeep
672
58k
Into the Great Unknown - MozCon
thekraken
41
2.6k
Writing Fast Ruby
sferik
630
63k
Skip the Path - Find Your Career Trail
mkilby
1
160
Leveraging LLMs for student feedback in introductory data science courses - posit::conf(2025)
minecr
1
310
Efficient Content Optimization with Google Search Console & Apps Script
katarinadahlin
PRO
1
680
Digital Ethics as a Driver of Design Innovation
axbom
PRO
1
340
Jamie Indigo - Trashchat’s Guide to Black Boxes: Technical SEO Tactics for LLMs
techseoconnect
PRO
0
290
Transcript
None
data driven deviations
whoami
None
None
None
None
None
whoareu
None
None
None
None
3rd party data investors infrastructure
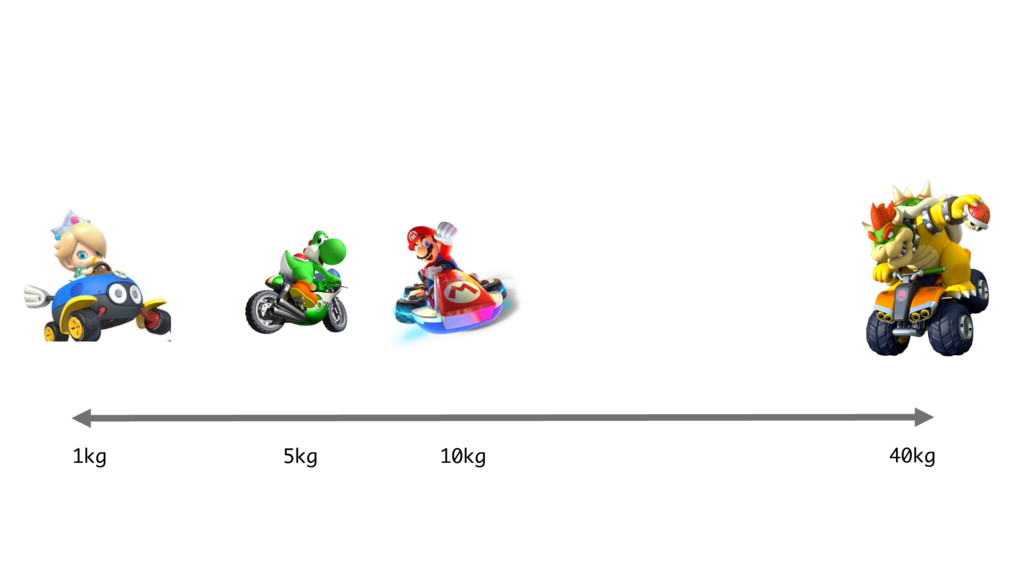
Green Shell Insurance *cough* *cough*
None
None
1kg 5kg 10kg 40kg
None
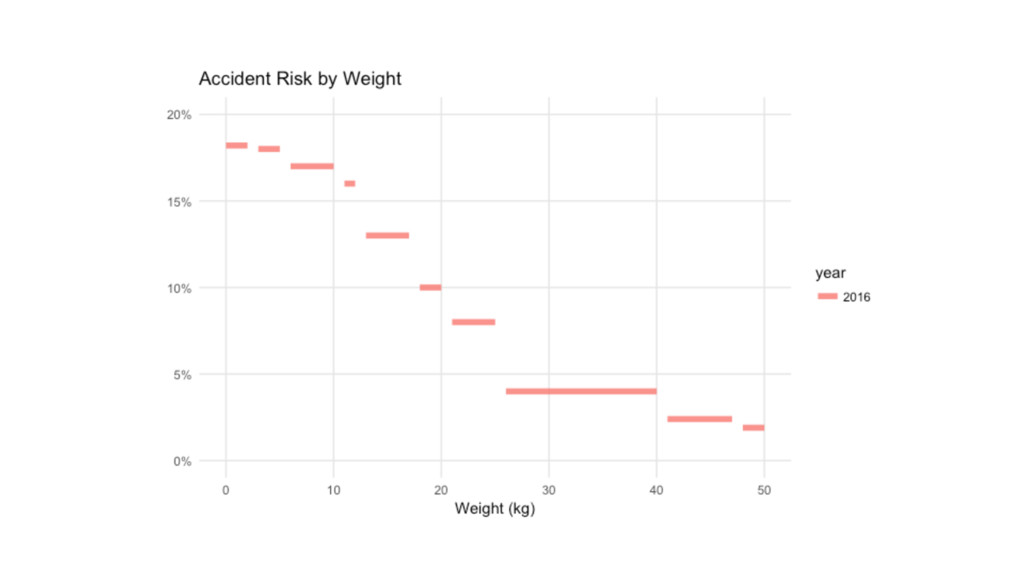
3rd party data
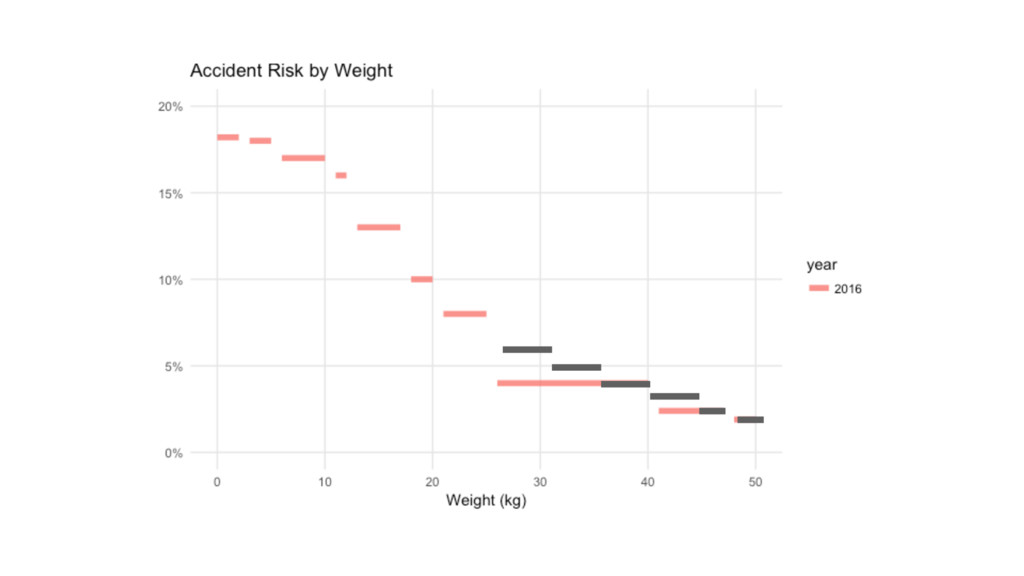
Mushroom Kingdom Weight Risk 0-2 18.2% 3-5 18.0% 6-10 17.0%
11-12 16.0% 13-17 13.0% 18-20 10.0% 21-25 8.00% 26-40 4.00% 41-47 2.40% 48-50 1.90%
None
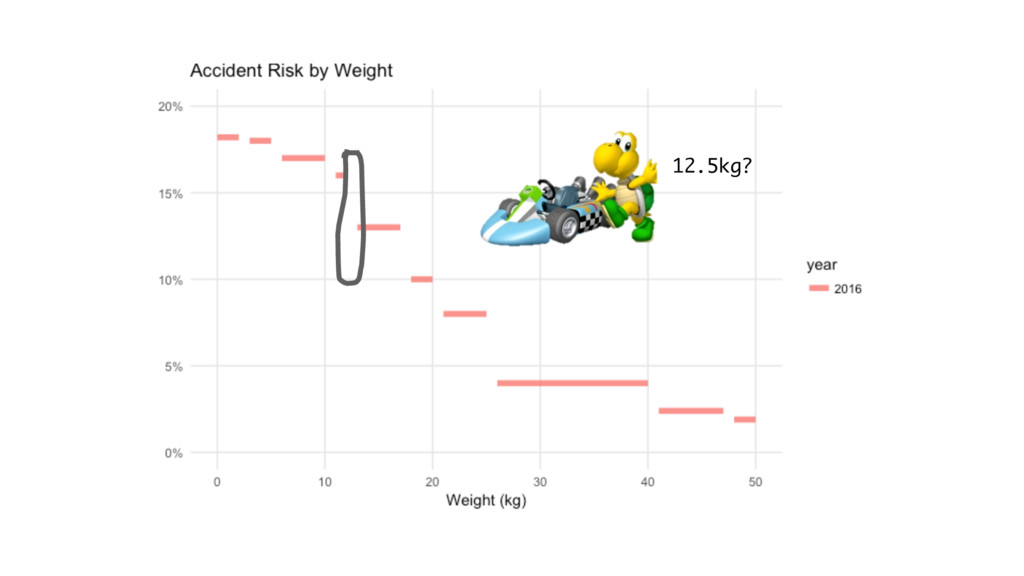
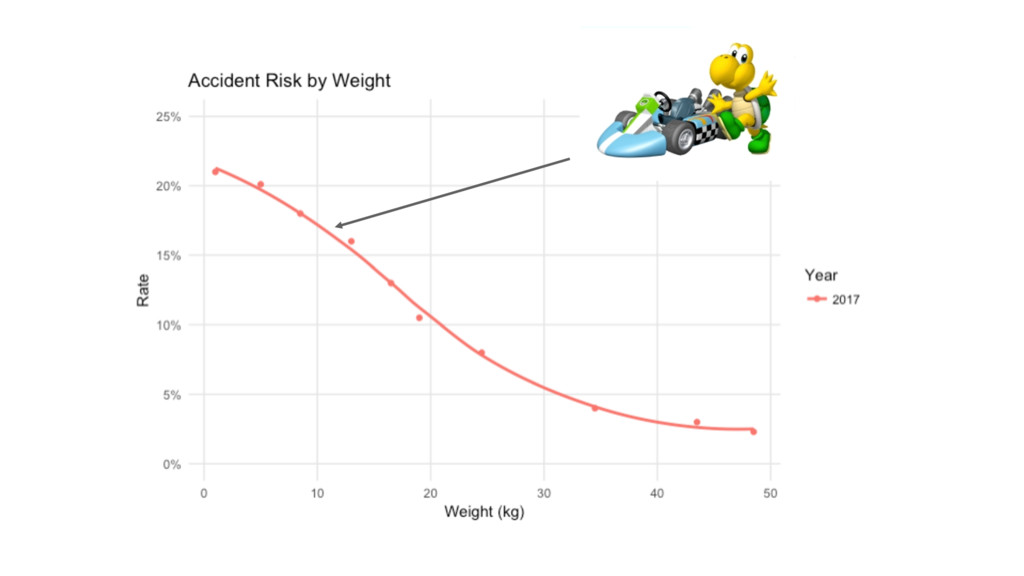
12.5kg?
None
None
None
None
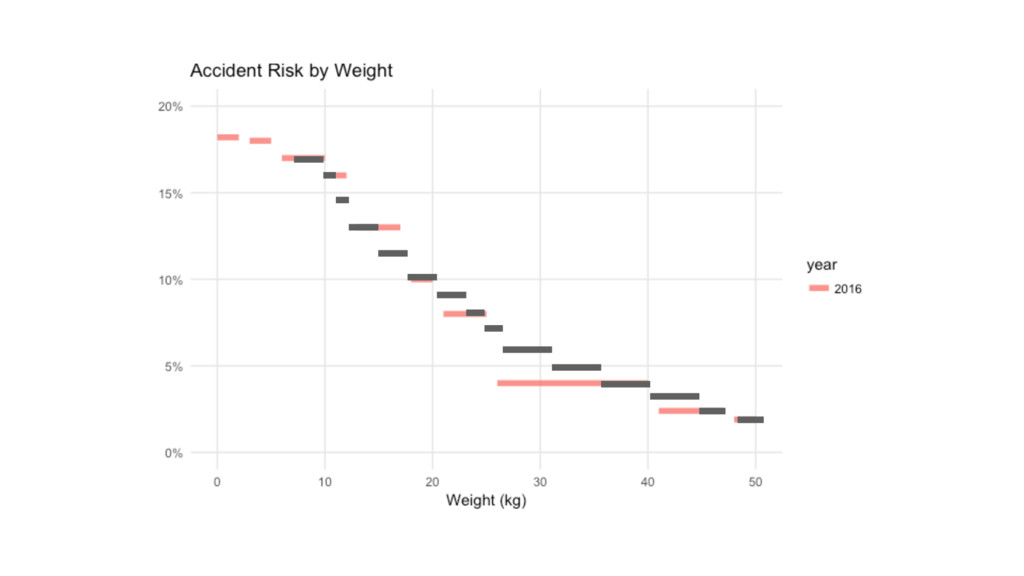
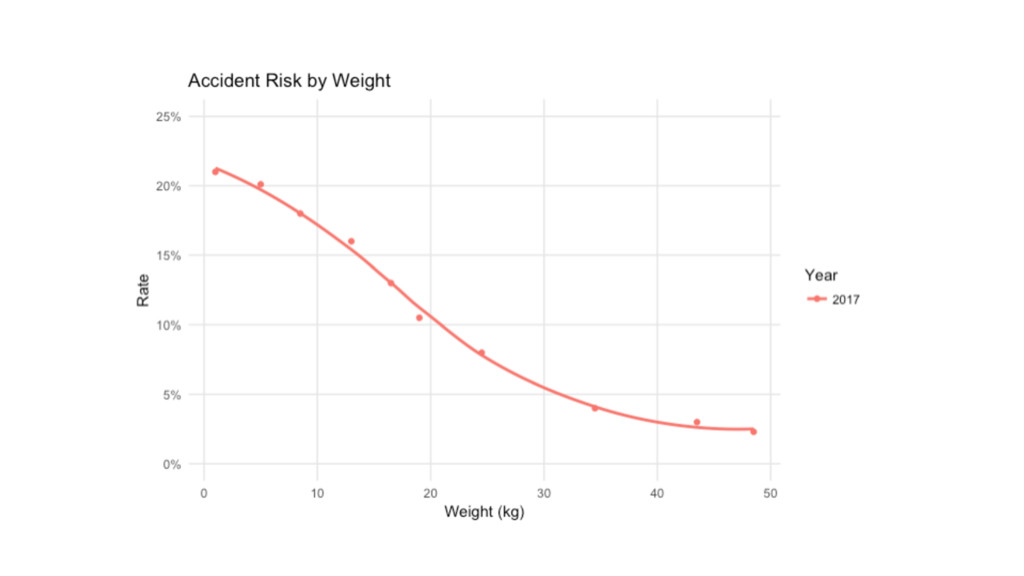
Weight Risk 0-2 21.0% 4-6 20.1% 7-10 18.0% 11-15 16.0%
16-17 13.0% 18-20 10.5% 21-28 8.00% 29-40 4.00% 41-46 3.00% 47-50 2.30% Weight Risk 0-2 18.2% 3-5 18.0% 6-10 17.0% 11-12 16.0% 13-17 13.0% 18-20 10.0% 21-25 8.00% 26-40 4.00% 41-47 2.40% 48-50 1.90%
None
None
None
None
None
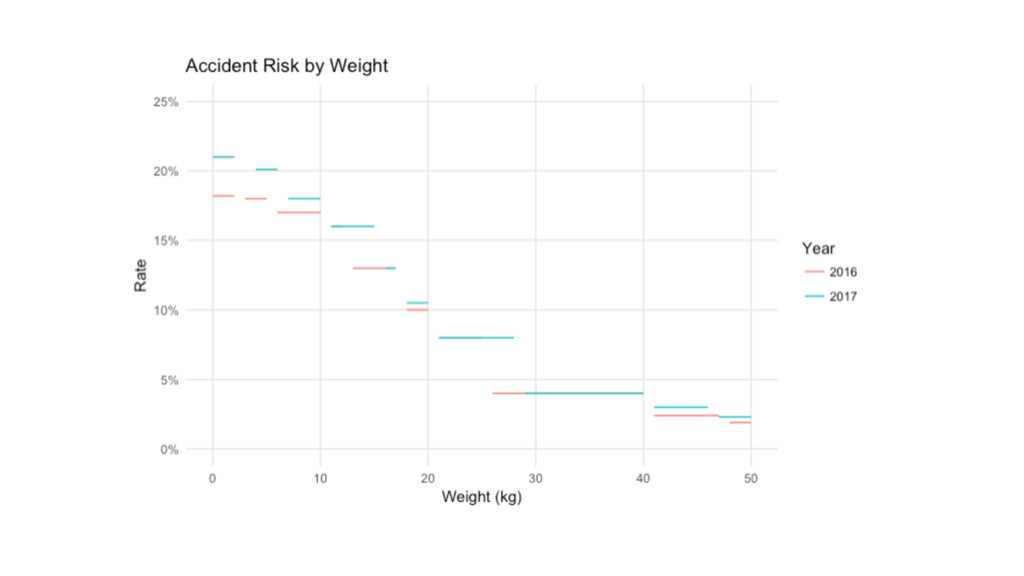
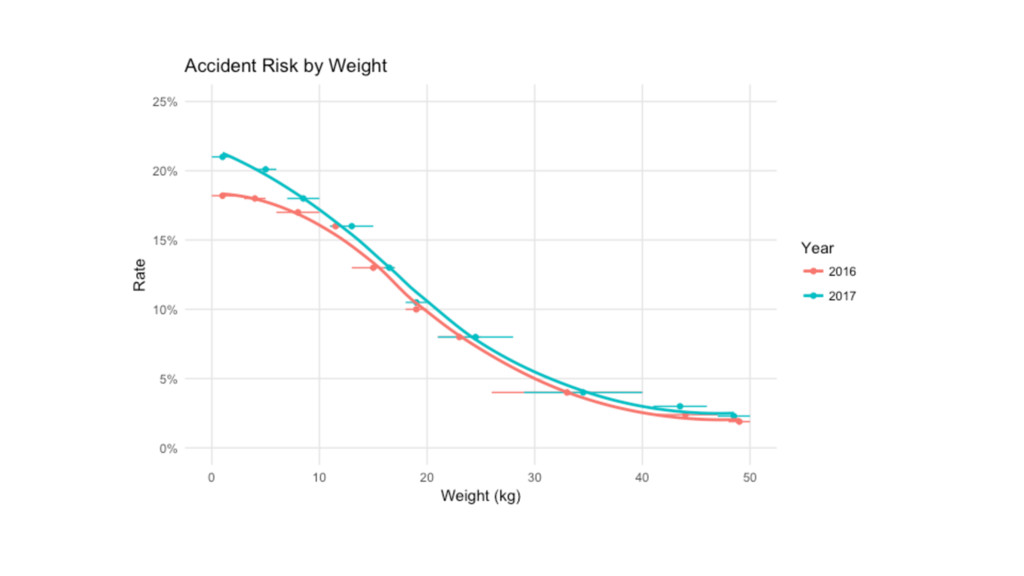
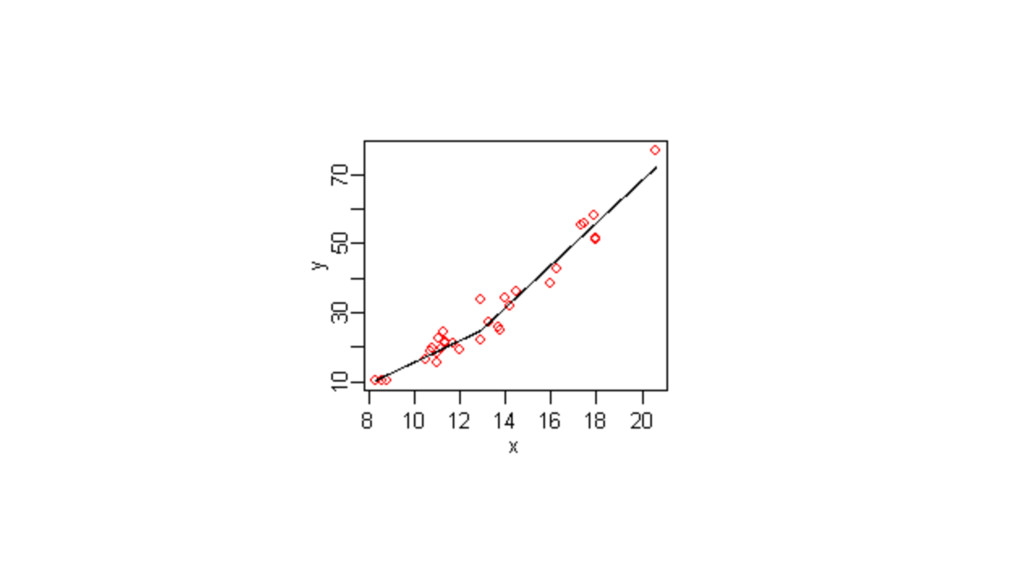
Weight Risk 1 21.0% 5 20.1% 8.5 18.0% 13 16.0%
16.5 13.0% 19 10.5% 24.5 8.00% 34.5 4.00% 43.5 3.00% 48.5 2.30% library(tidyverse); library(modelr) mod <- loess(Risk ~ Weight, data=data, span=0.8) predict(mod, tibble(Weight=12.5)) grid <- tibble(Weight = seq(0, 50, 0.5)) %>% add_predictions(mod, var = "Risk")
None
None
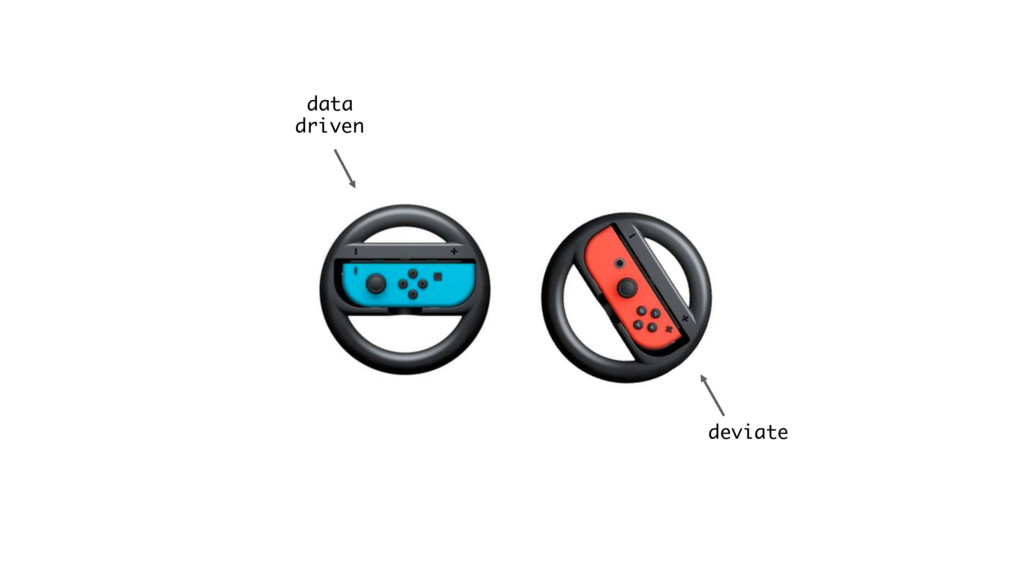
data driven deviate
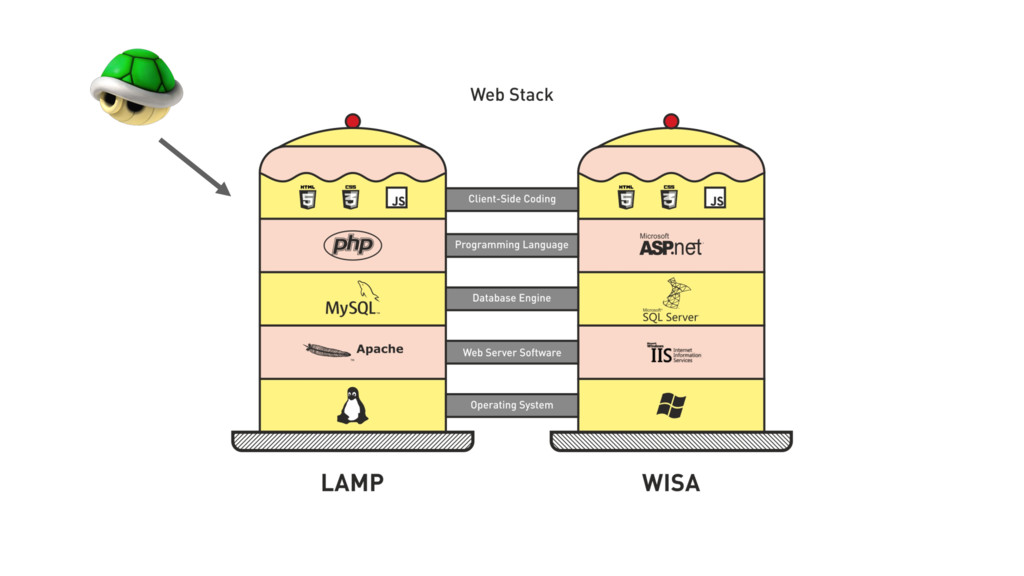
infrastructure
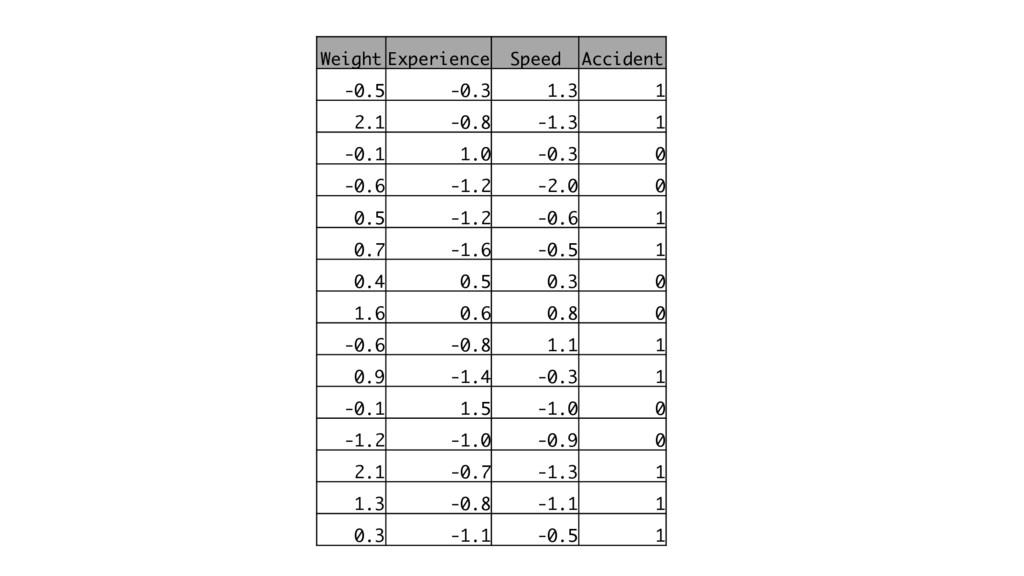
Weight Experience Speed Accident -0.5 -0.3 1.3 1 2.1 -0.8
-1.3 1 -0.1 1.0 -0.3 0 -0.6 -1.2 -2.0 0 0.5 -1.2 -0.6 1 0.7 -1.6 -0.5 1 0.4 0.5 0.3 0 1.6 0.6 0.8 0 -0.6 -0.8 1.1 1 0.9 -1.4 -0.3 1 -0.1 1.5 -1.0 0 -1.2 -1.0 -0.9 0 2.1 -0.7 -1.3 1 1.3 -0.8 -1.1 1 0.3 -1.1 -0.5 1
learning
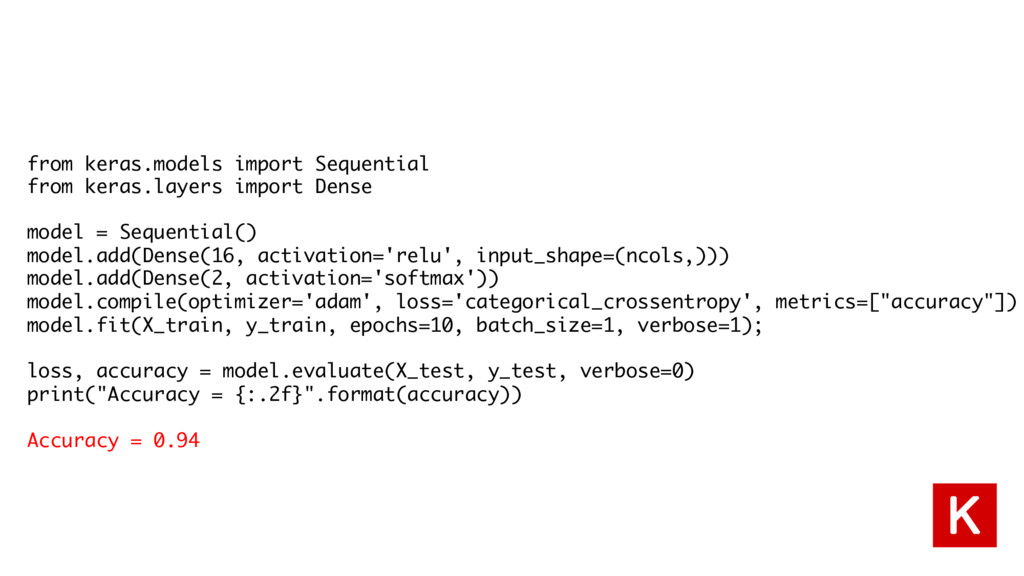
from keras.models import Sequential from keras.layers import Dense model =
Sequential() model.add(Dense(16, activation='relu', input_shape=(ncols,))) model.add(Dense(2, activation='softmax')) model.compile(optimizer='adam', loss='categorical_crossentropy', metrics=["accuracy"]) model.fit(X_train, y_train, epochs=10, batch_size=1, verbose=1); loss, accuracy = model.evaluate(X_test, y_test, verbose=0) print("Accuracy = {:.2f}".format(accuracy)) Accuracy = 0.94
[-2, -2, 0.7]
[-2, -2, 0.7] new_data = np.array([[-2, -2, 0.7]]) model.predict(new_data) 0.1964
model.predict()
None
None
None
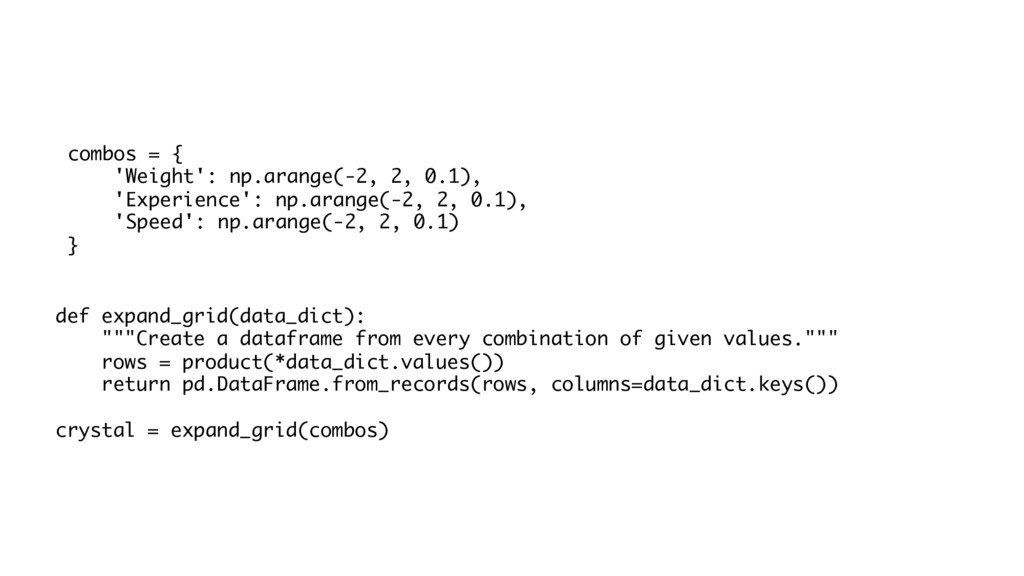
combos = { 'Weight': np.arange(-2, 2, 0.1), 'Experience': np.arange(-2, 2,
0.1), 'Speed': np.arange(-2, 2, 0.1) } def expand_grid(data_dict): """Create a dataframe from every combination of given values.""" rows = product(*data_dict.values()) return pd.DataFrame.from_records(rows, columns=data_dict.keys()) crystal = expand_grid(combos)
Weight Experience Top Speed -2 -2 -2 -2 -2 -1.9
-2 -2 -1.8 -2 -2 -1.7 -2 -2 -1.6 -2 -2 -1.5 -2 -2 -1.4 -2 -2 -1.3 -2 -2 -1.2 -2 -2 -1.1
crystal_in = np.array(crystal.values.tolist()) crystal_pred = pd.DataFrame(model.predict(crystal_in)) df_c = pd.concat([crystal.reset_index(drop=True), crystal_pred],
axis=1)
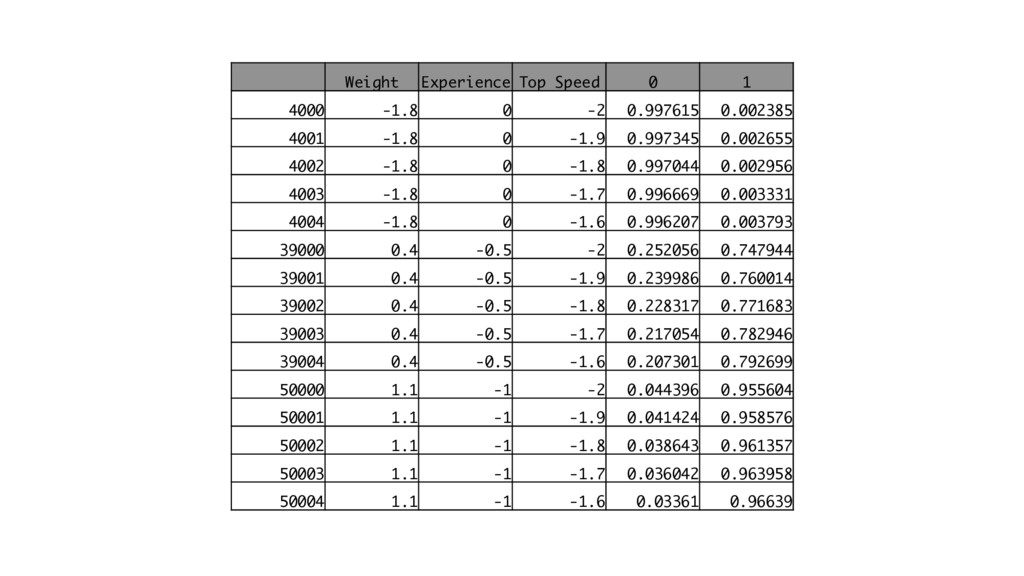
Weight Experience Top Speed 0 1 4000 -1.8 0 -2
0.997615 0.002385 4001 -1.8 0 -1.9 0.997345 0.002655 4002 -1.8 0 -1.8 0.997044 0.002956 4003 -1.8 0 -1.7 0.996669 0.003331 4004 -1.8 0 -1.6 0.996207 0.003793 39000 0.4 -0.5 -2 0.252056 0.747944 39001 0.4 -0.5 -1.9 0.239986 0.760014 39002 0.4 -0.5 -1.8 0.228317 0.771683 39003 0.4 -0.5 -1.7 0.217054 0.782946 39004 0.4 -0.5 -1.6 0.207301 0.792699 50000 1.1 -1 -2 0.044396 0.955604 50001 1.1 -1 -1.9 0.041424 0.958576 50002 1.1 -1 -1.8 0.038643 0.961357 50003 1.1 -1 -1.7 0.036042 0.963958 50004 1.1 -1 -1.6 0.03361 0.96639
None
investors
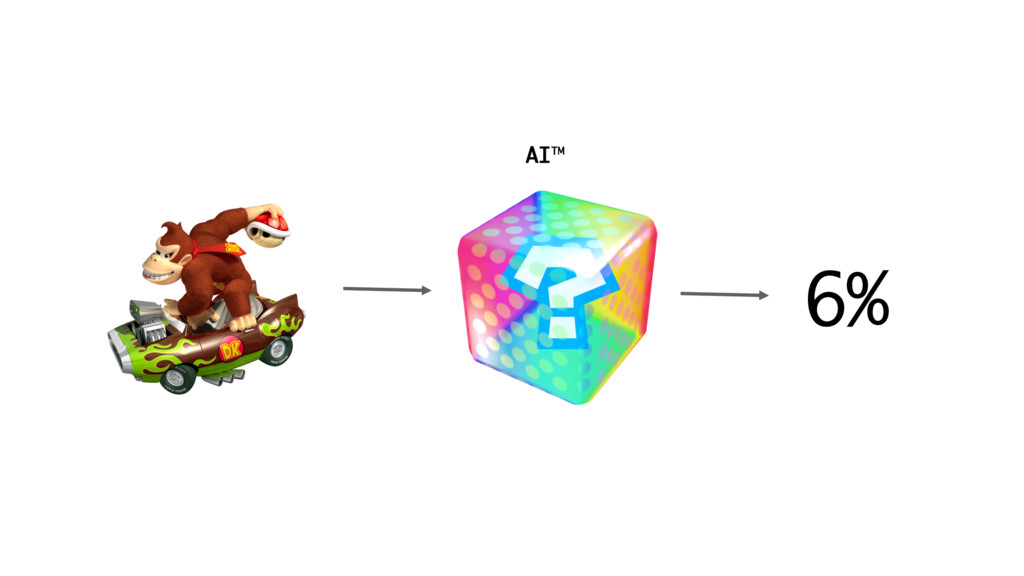
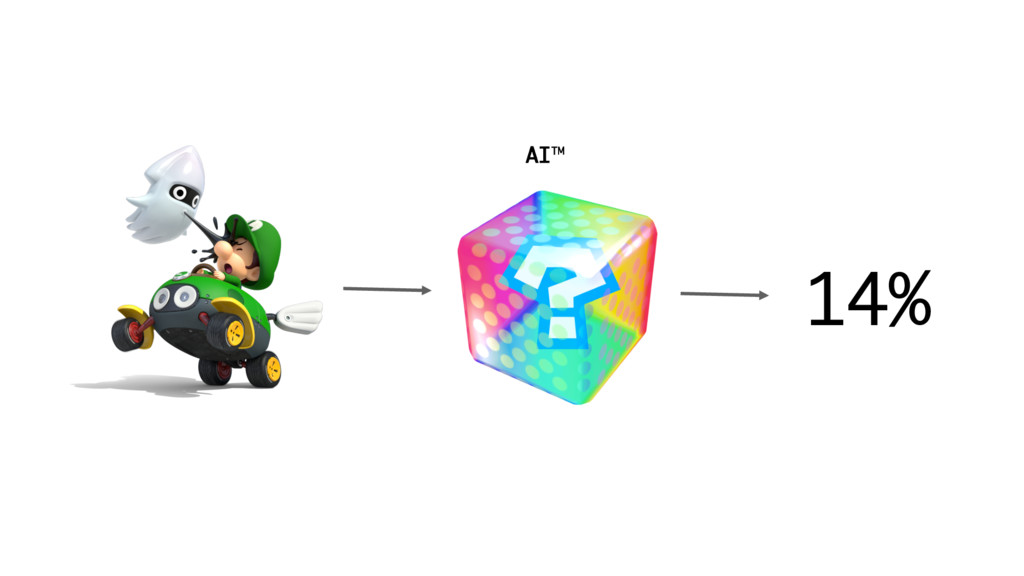
AI™
AI™ 6%
AI™ 14%
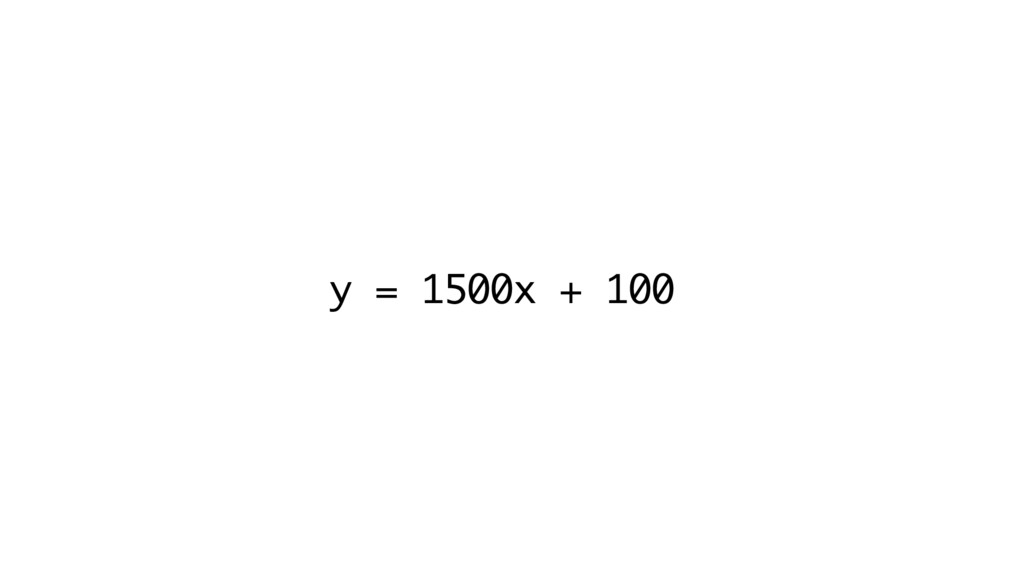
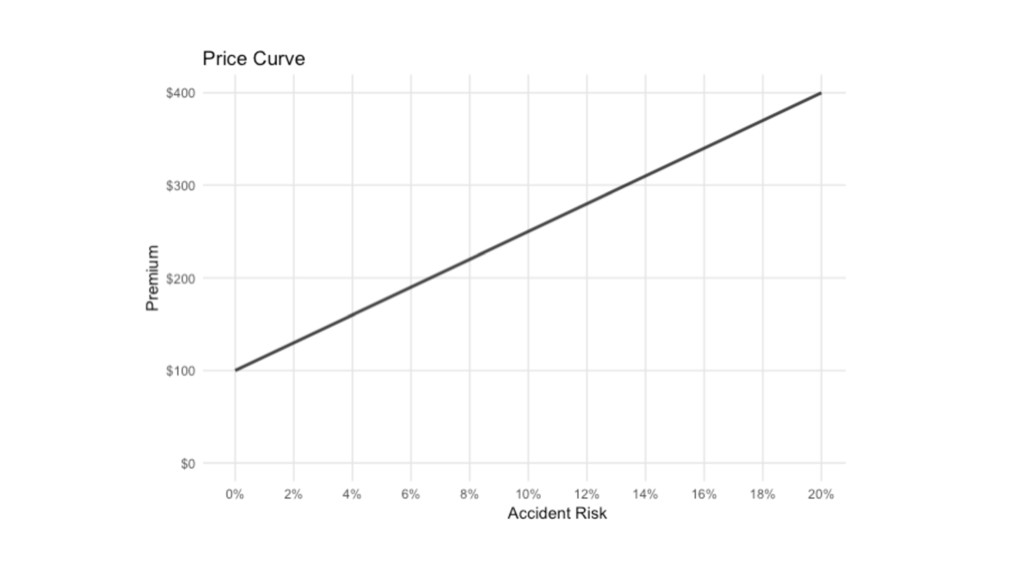
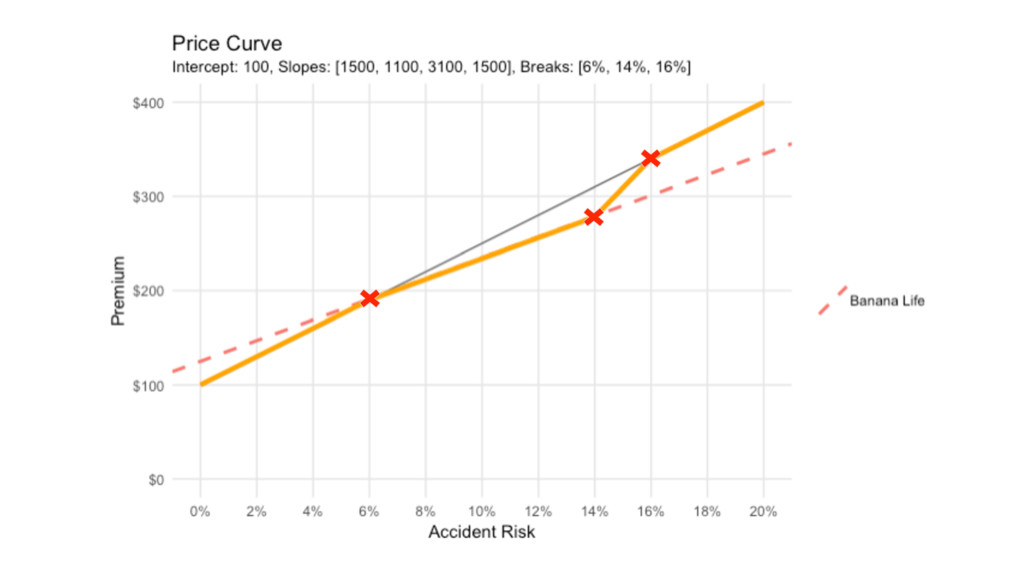
y = 1500x + 100
6% 14% $190 $310
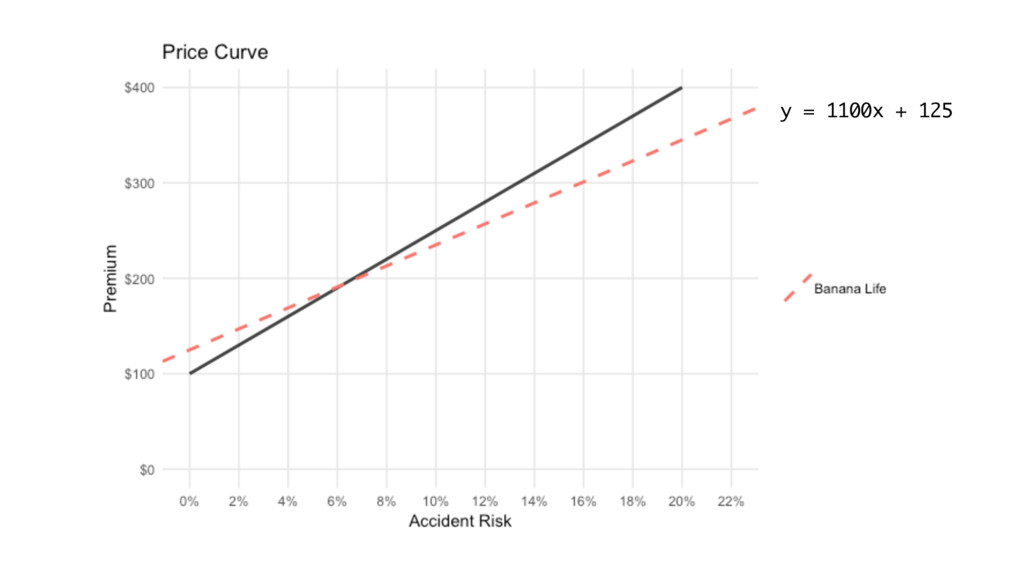
Risk Premium 2% $130 4% $160 6% $190 8% $220
10% $250 12% $280 14% $310 16% $340 18% $370 20% $400
None
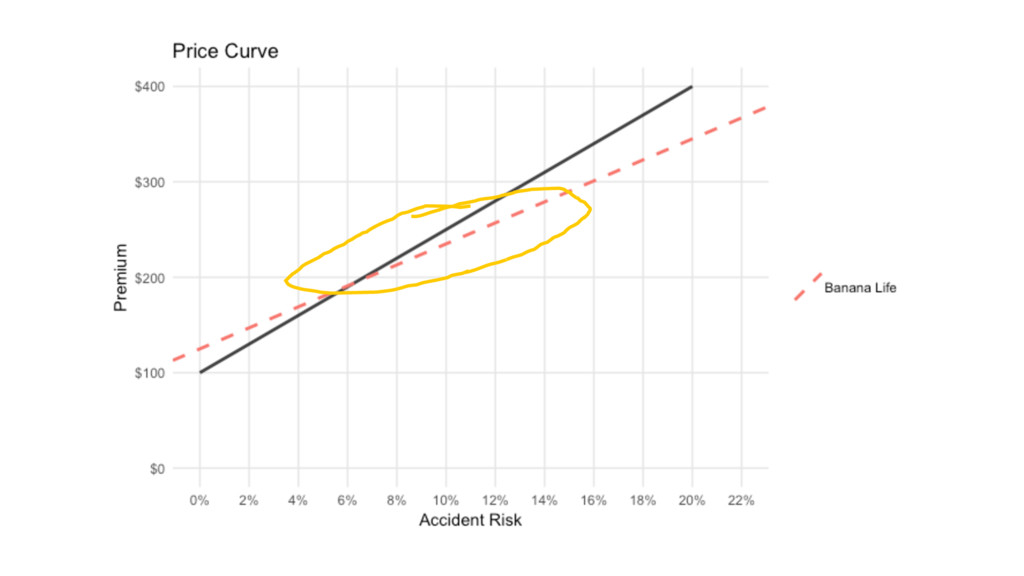
Banana Life Financial
y = 1100x + 125
None
None
None
None
None
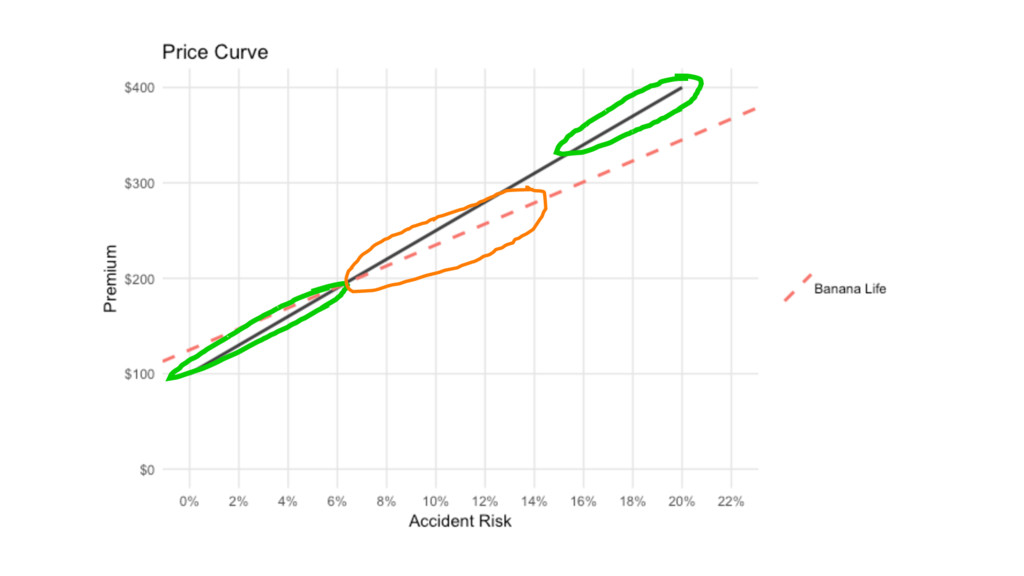
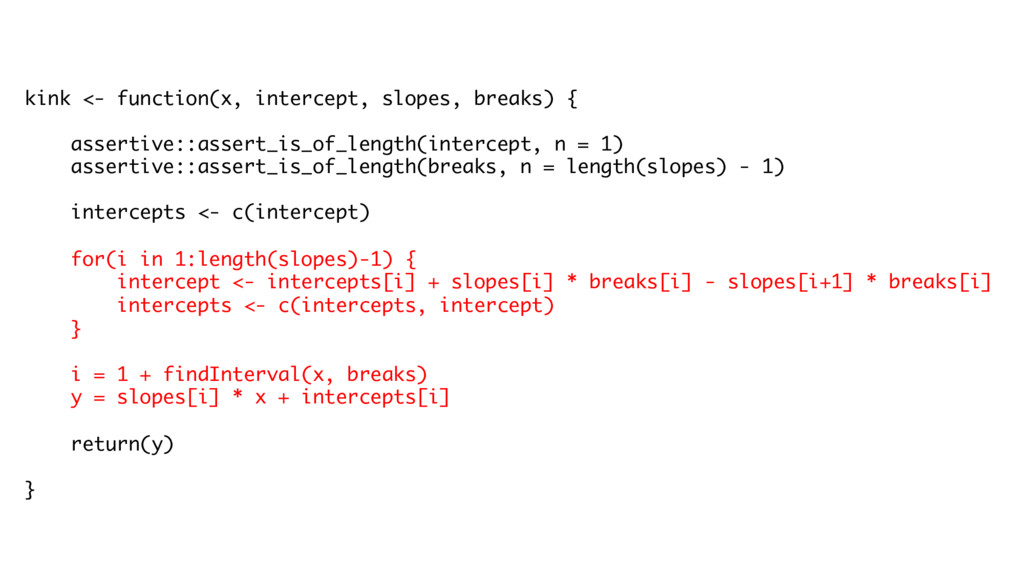
kink <- function(x, intercept, slopes, breaks) { assertive::assert_is_of_length(intercept, n =
1) assertive::assert_is_of_length(breaks, n = length(slopes) - 1) intercepts <- c(intercept) for(i in 1:length(slopes)-1) { intercept <- intercepts[i] + slopes[i] * breaks[i] - slopes[i+1] * breaks[i] intercepts <- c(intercepts, intercept) } i = 1 + findInterval(x, breaks) y = slopes[i] * x + intercepts[i] return(y) }
None
None
None
None
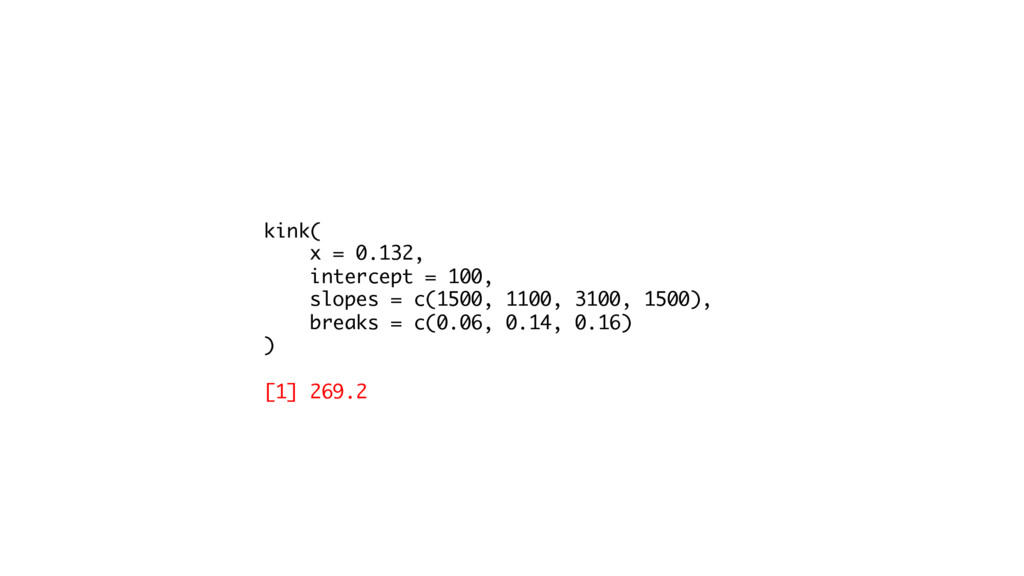
kink( x = 0.132, intercept = 100, slopes = c(1500,
1100, 3100, 1500), breaks = c(0.06, 0.14, 0.16) ) [1] 269.2
None
None
0 to
3rd party data investors infrastructure
None
0 to 80
None
maxhumber
bonus
regulators
None
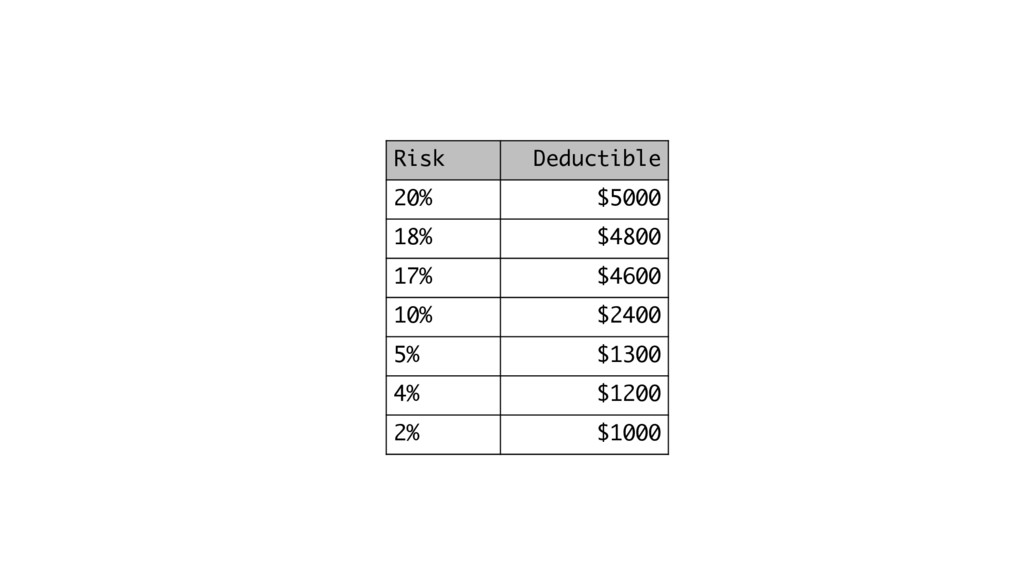
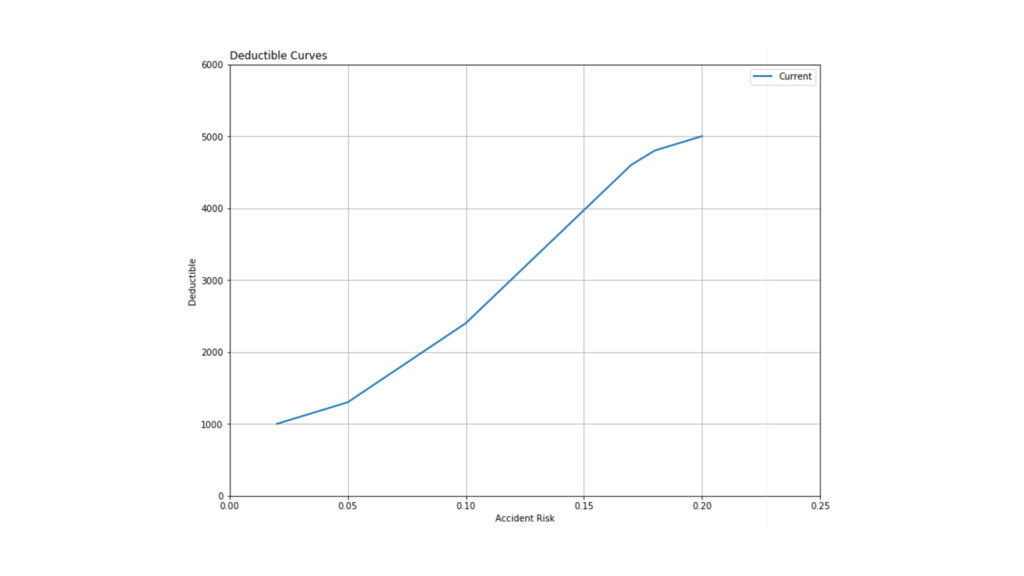
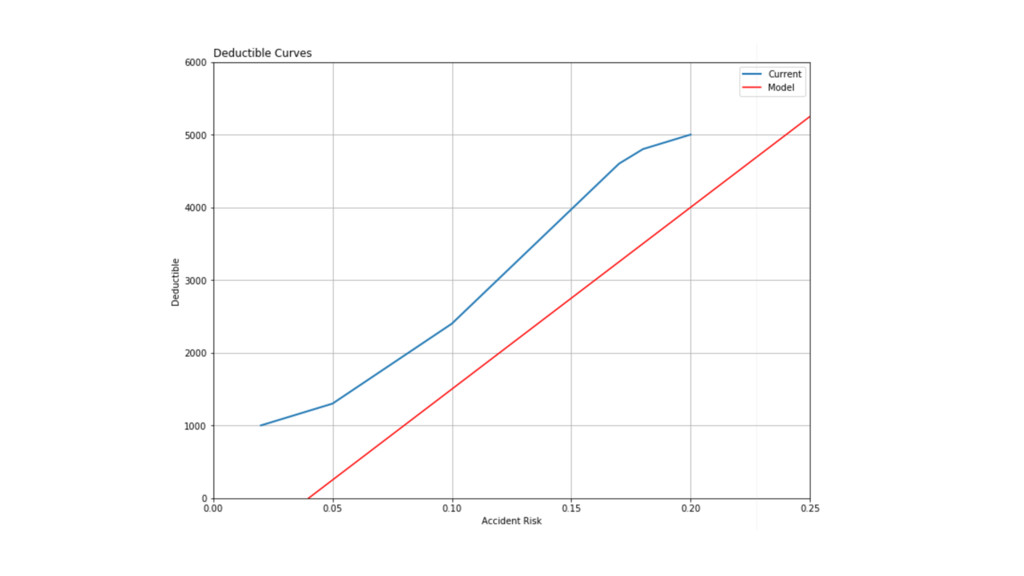
Risk Deductible 20% $5000 18% $4800 17% $4600 10% $2400
5% $1300 4% $1200 2% $1000
None
None
None
None
None
None
None
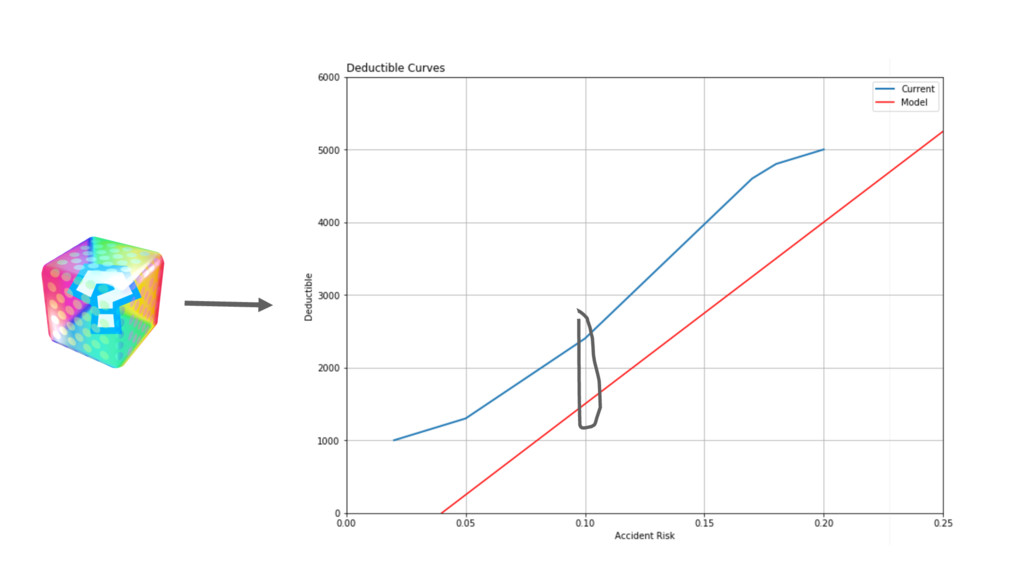
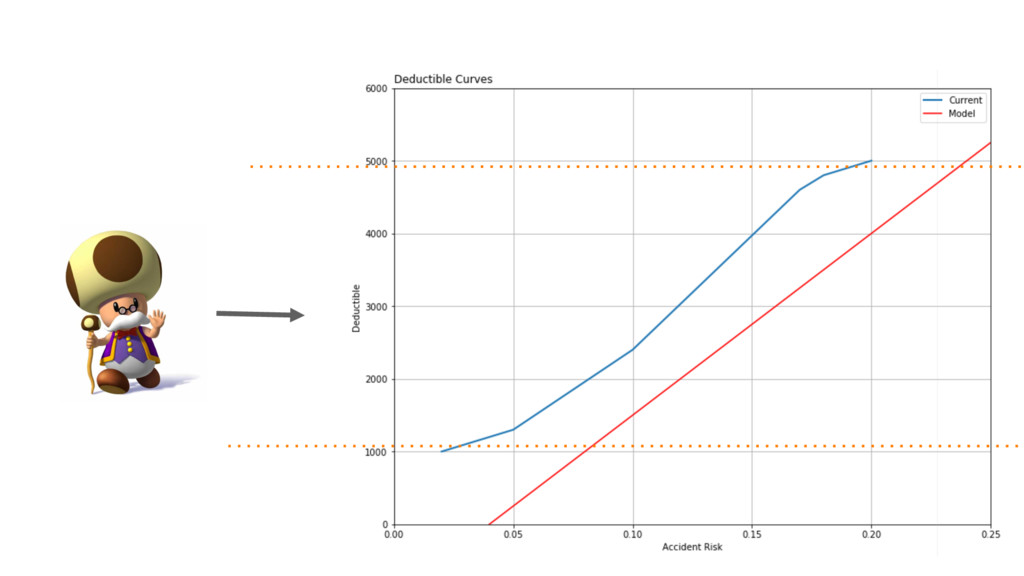
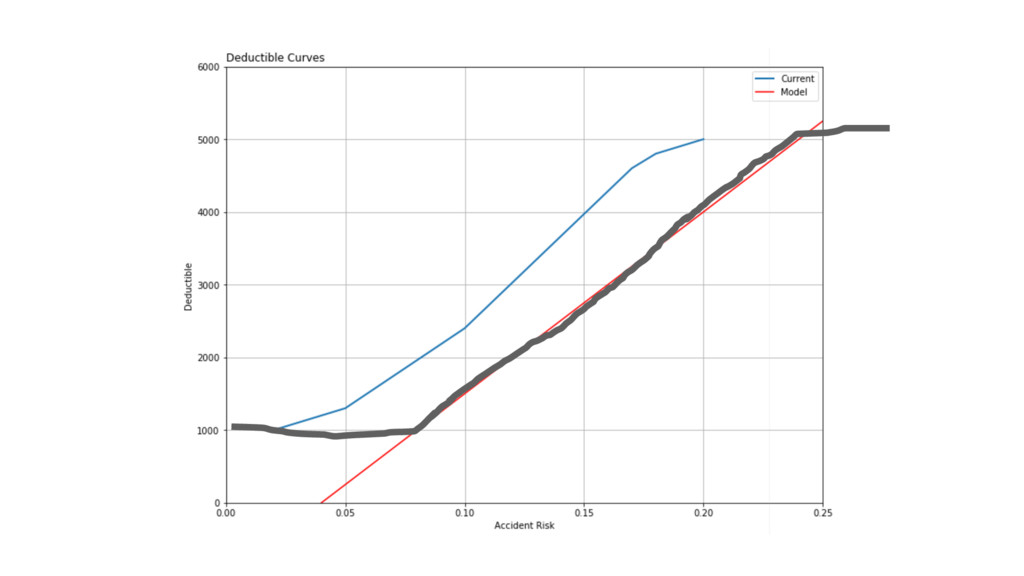
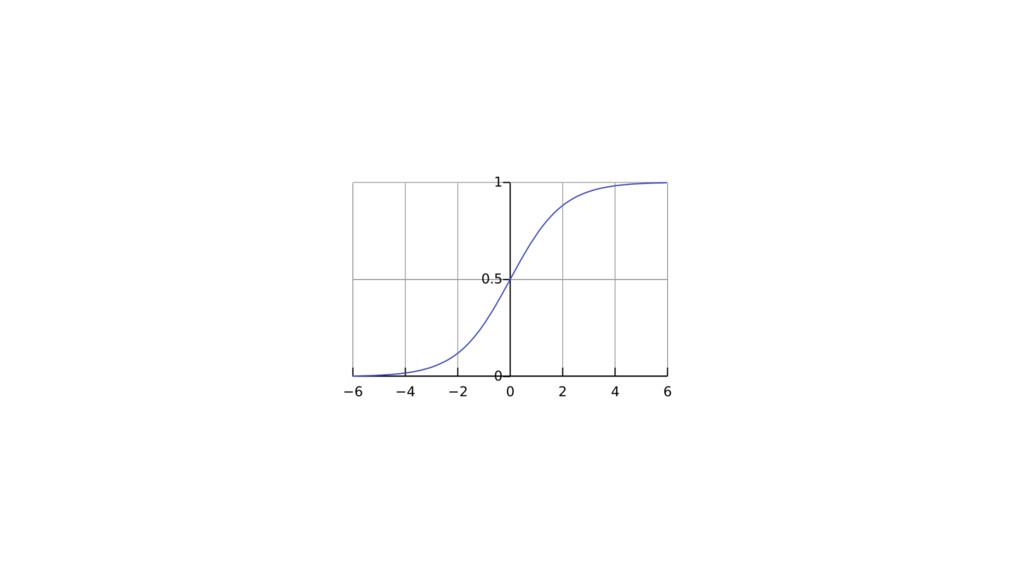
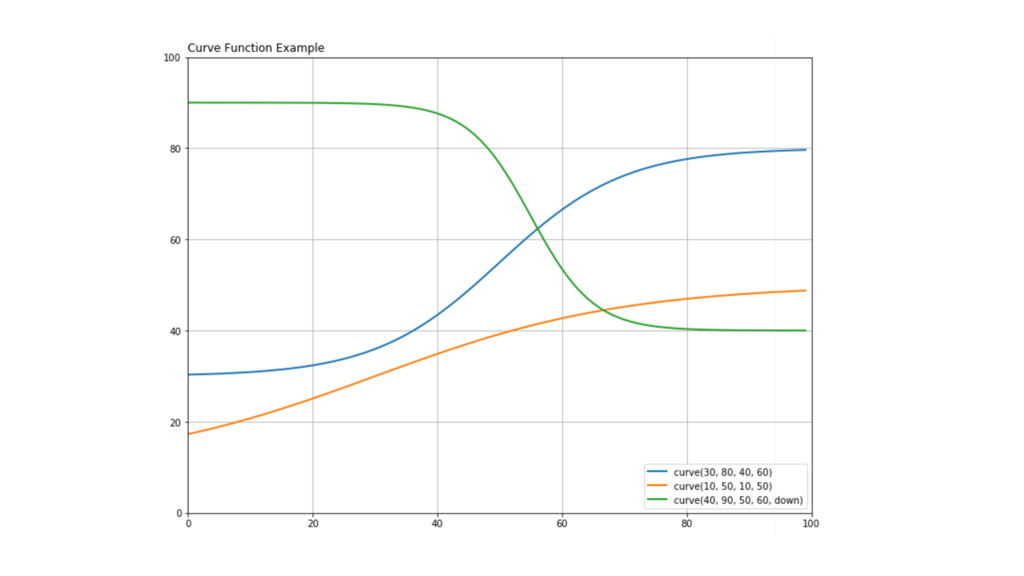
def curve(x, ymin, ymax, xhl, xhu, up=True): a = (xhl
+ xhu) / 2 b = 2 / abs(xhl - xhu) c = ymin d = ymax - c if up == True: y = c + ( d / ( 1 + np.exp(1)**( -b * (x - a) ) ) ) elif up == False: y = c + ( d / ( 1 + np.exp( b * (x - a) ) ) ) else: None return y
None
None
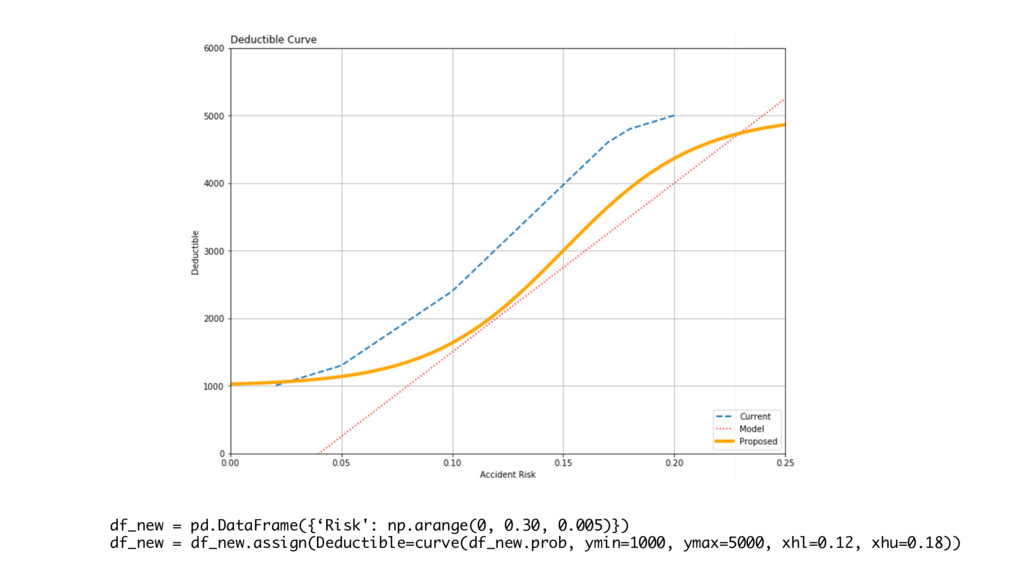
df_new = pd.DataFrame({‘Risk': np.arange(0, 0.30, 0.005)}) df_new = df_new.assign(Deductible=curve(df_new.prob, ymin=1000,
ymax=5000, xhl=0.12, xhu=0.18))
None
![[-2, -2, 0.7]](https://files.speakerdeck.com/presentations/1256439aba134c4ab7886ffce167918a/slide_41.jpg)
![[-2, -2, 0.7] new_data = np.array([[-2, -2, 0.7]]) model.predict(new_data) 0.1964](https://files.speakerdeck.com/presentations/1256439aba134c4ab7886ffce167918a/slide_42.jpg)
![crystal_in = np.array(crystal.values.tolist()) crystal_pred = pd.DataFrame(model.predict(crystal_in)) df_c = pd.concat([crystal.reset_index(drop=True), crystal_pred],](https://files.speakerdeck.com/presentations/1256439aba134c4ab7886ffce167918a/slide_49.jpg)