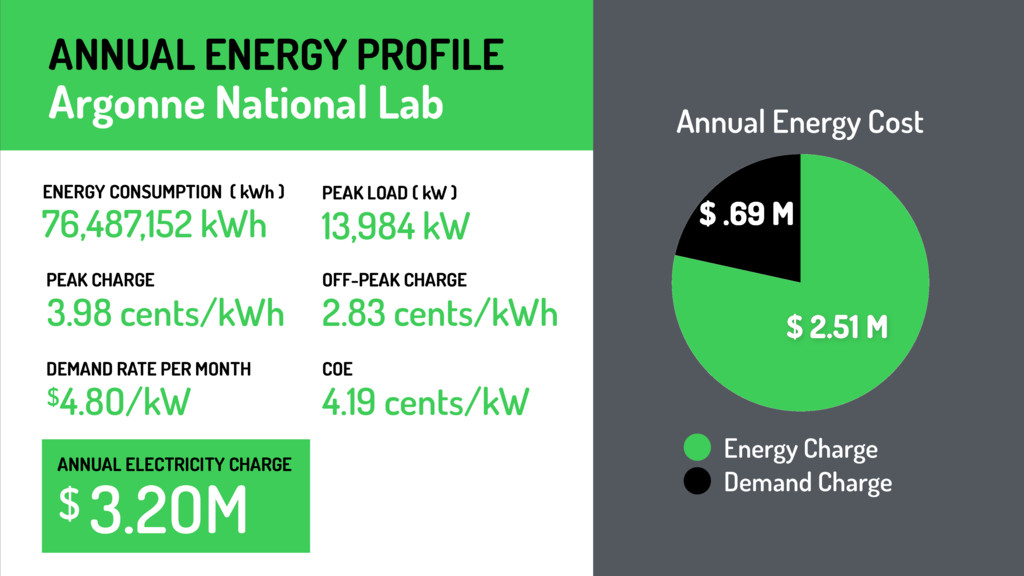
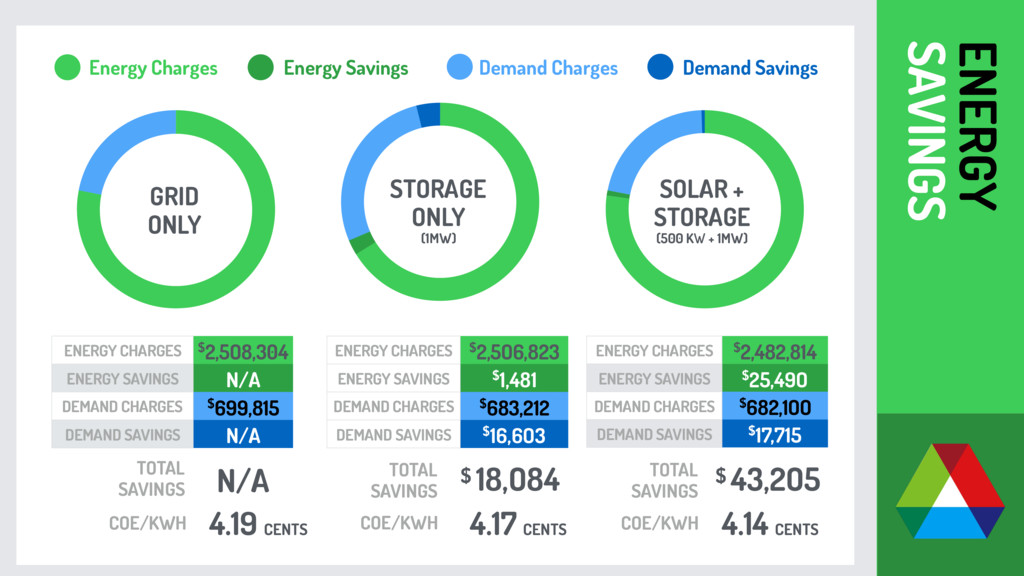
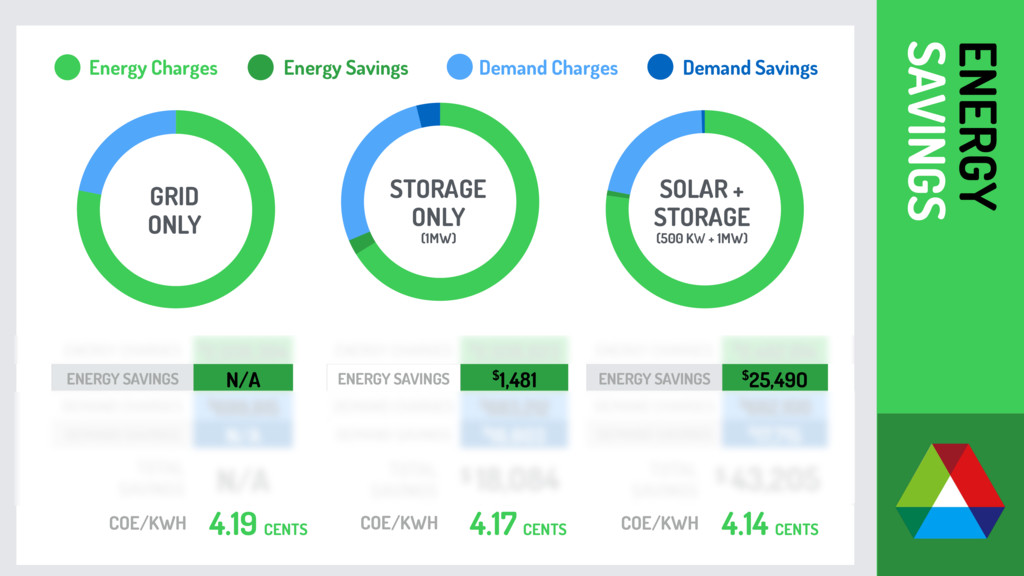
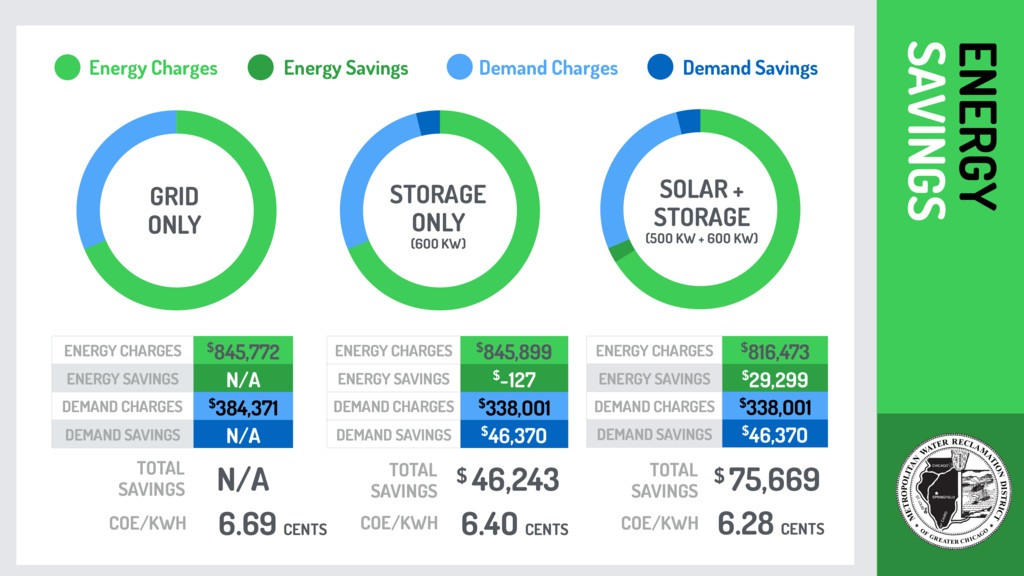
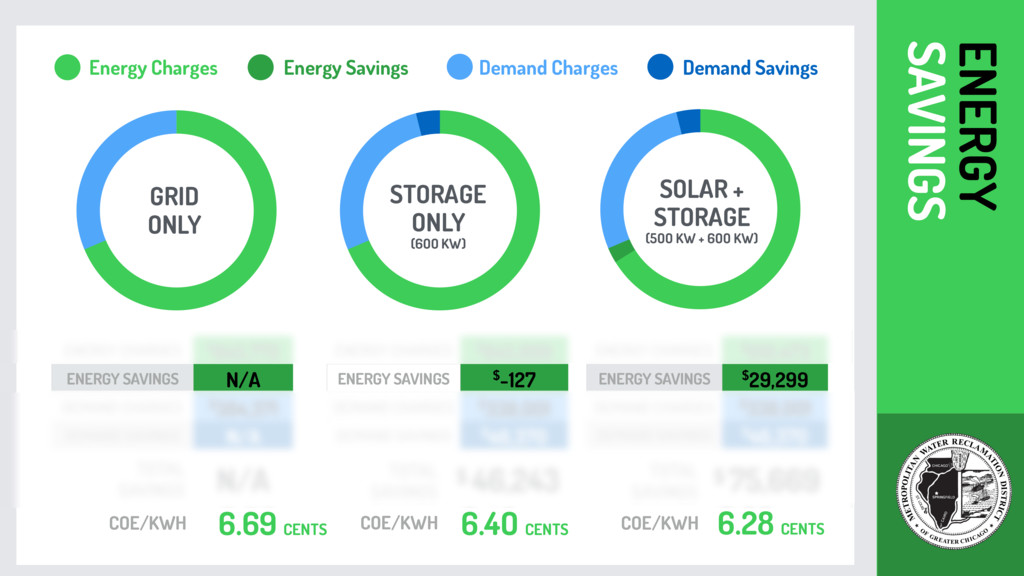
CHARGES $682,1OO DEMAND SAVINGS $17,715 ENERGY CHARGES $2,5O6,823 ENERGY SAVINGS $1,481 DEMAND CHARGES $683,212 DEMAND SAVINGS $16,6O3 TOTAL SAVINGS N/A TOTAL SAVINGS $ 18,O84 TOTAL SAVINGS $ 43,2O5 GRID ONLY SOLAR + STORAGE
(500 KW + 1MW) STORAGE
ONLY
(1MW) COE/KWH 4.17 CENTS COE/KWH 4.14 CENTS COE/KWH 4.19 CENTS ENERGY CHARGES $2,5O8,304 ENERGY SAVINGS N/A DEMAND CHARGES $699,815 DEMAND SAVINGS N/A Energy Charges Energy Savings Demand Charges Demand Savings