Upgrade to Pro
— share decks privately, control downloads, hide ads and more …
Speaker Deck
Features
Speaker Deck
PRO
Sign in
Sign up for free
Search
Search
Tech Dojo Introduction Of Monitoring
Search
NoriMuraZ
May 24, 2023
Technology
550
0
Share
Embed
Copy iframe code
Copy JS code
Copy link
Start on current slide
Tech Dojo Introduction Of Monitoring
本スライドは以下connpassで実施した資料になります。
https://ibm-developer.connpass.com/event/278896/
NoriMuraZ
May 24, 2023
More Decks by NoriMuraZ
See All by NoriMuraZ
新卒社員が初めてやってみた!GitHub編(Trying GitHub for the First Time as a New Graduate!)
norimuraz
0
230
新卒社員が初めてやってみた!GitHub編QA(Trying GitHub for the First Time as a New Graduate!)
norimuraz
0
150
いまからでも遅くない!SSL/TLS証明書超入門(It's not too late to start! SSL/TLS Certificates: The Absolute Beginner's Guide)
norimuraz
0
550
Tech Dojo OpenShift-S2I handson
norimuraz
0
320
Other Decks in Technology
See All in Technology
AI時代こそ、スケールしないことをしよう -「作る人」から「なぜ作るか」を考える人へ / Do Things That Don't Scale in the AI Era — From How to Why
kaminashi
1
100
Vポイント分析基盤におけるデータモデリング20年史
taromatsui_cccmkhd
4
730
AI Coding Agent時代のcdk-nagガードレール 〜組織ルールを強制CIで守り抜く設計の挑戦〜
mhrtech
3
510
AI x 開発生産性を取り巻く予算戦略と投資対効果
i35_267
7
2.9k
穢れた技術選定について
watany
19
6.2k
人とエージェントが高め合う協業設計
kintotechdev
0
760
Playwright × AI Agent でE2Eテストはどう変わるか AI駆動テストの可能性と実用検証の結果
taiga7543
2
810
データと地図で読む 大井町の「かわるもの、かわらないもの」
yoshiyama_hana
0
150
Webアプリ認証の全体像 / The Big Picture of Web App Authentication
kitano_yuichi
1
430
_NIKKEI_Tech_Talk__勉強会は熱量では続かない___17回続いた輪読会の設計術.pdf
_awache
1
110
複数プロダクトで進めるAI機能実装 ── 実践から得たリアルな学びとロードマップ実現への挑戦 / AICon2026_yanari
rakus_dev
1
270
ゴールデンパスは敷いただけでは道にならない ─ 企画部門のエンジニアが技術標準を事業価値に変えるまで
mhrtech
1
260
Featured
See All Featured
Are puppies a ranking factor?
jonoalderson
1
3.7k
Building the Perfect Custom Keyboard
takai
2
820
Let's Do A Bunch of Simple Stuff to Make Websites Faster
chriscoyier
508
140k
実際に使うSQLの書き方 徹底解説 / pgcon21j-tutorial
soudai
PRO
201
75k
Google's AI Overviews - The New Search
badams
0
1.1k
It's Worth the Effort
3n
188
29k
Tips & Tricks on How to Get Your First Job In Tech
honzajavorek
1
620
How to Ace a Technical Interview
jacobian
281
24k
A better future with KSS
kneath
240
18k
From π to Pie charts
rasagy
0
240
Building Adaptive Systems
keathley
44
3.1k
世界の人気アプリ100個を分析して見えたペイウォール設計の心得
akihiro_kokubo
PRO
72
40k
Transcript
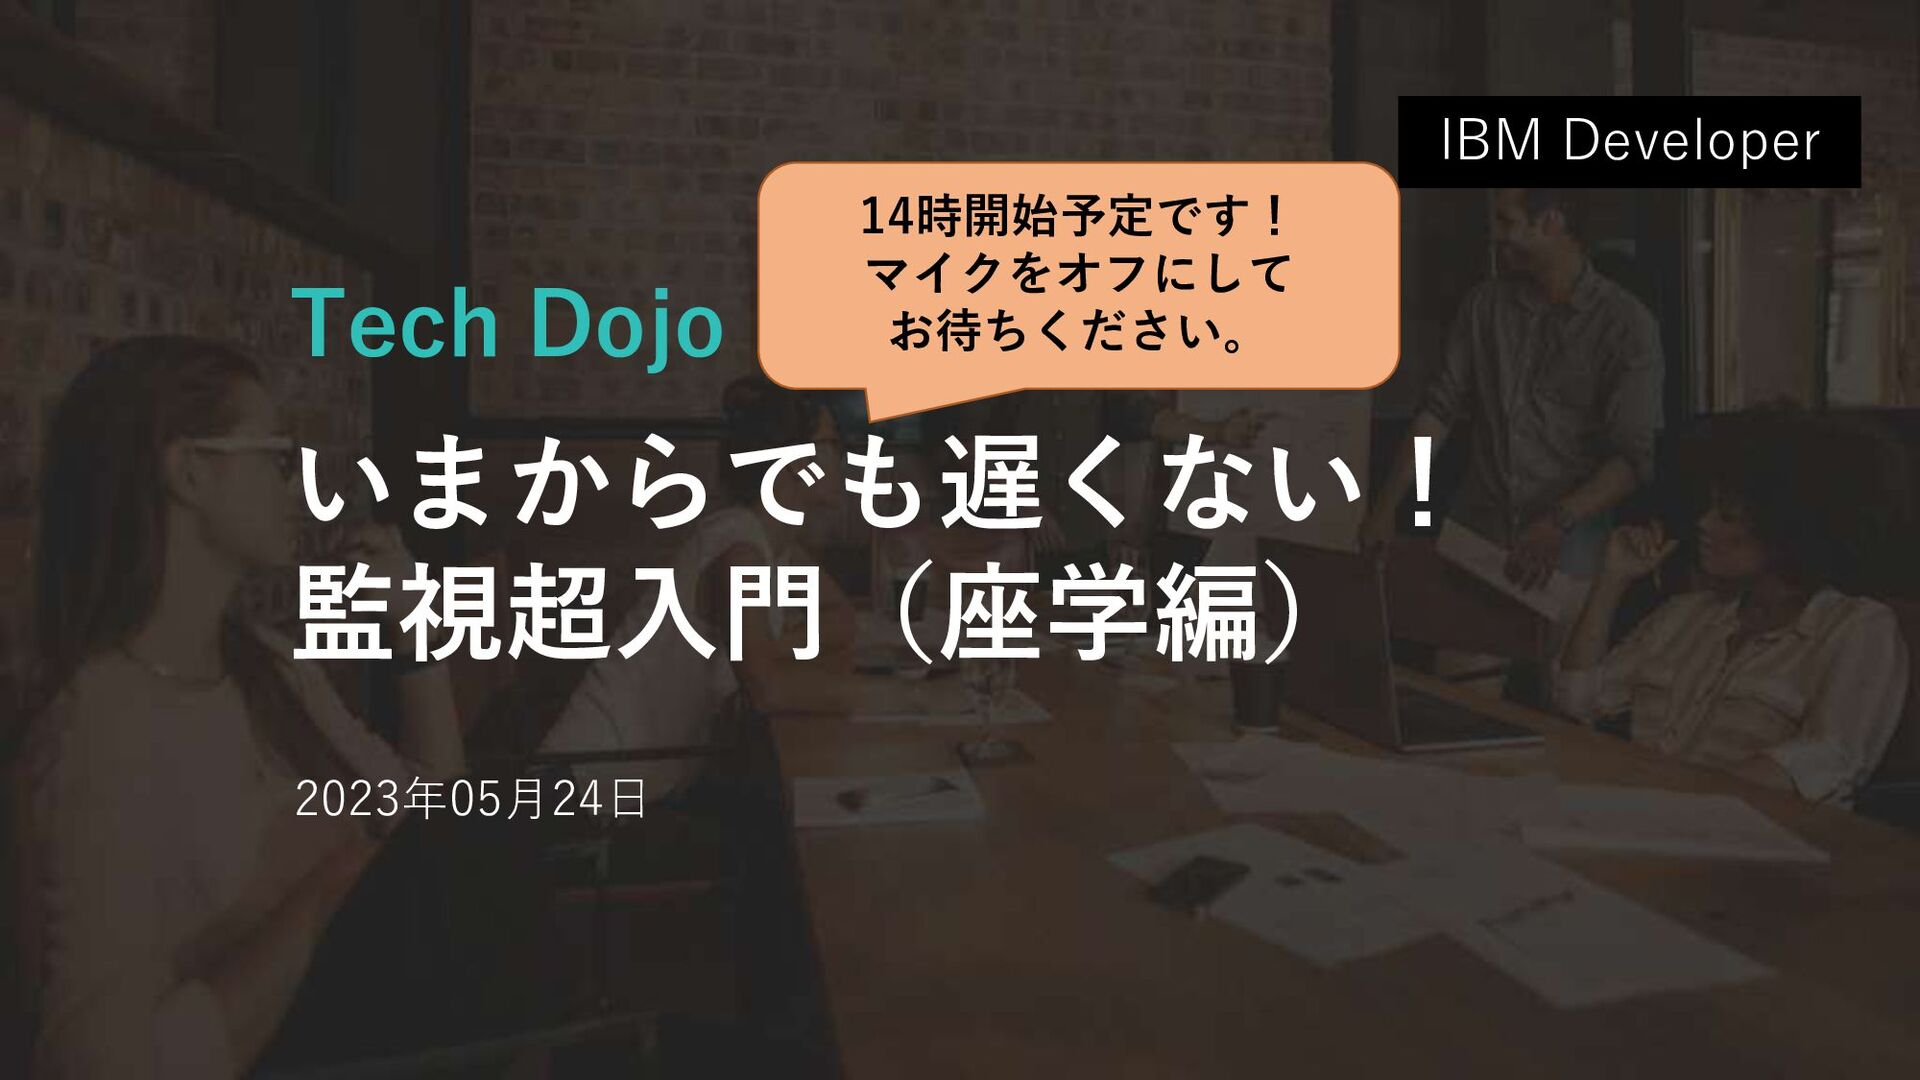
Tech Dojo いまからでも遅くない! 監視超入門(座学編) 2023年05月24日 IBM Developer 14時開始予定です! マイクをオフにして お待ちください。
2 Customer Success, IBM Technology, Japan / © 2023 IBM
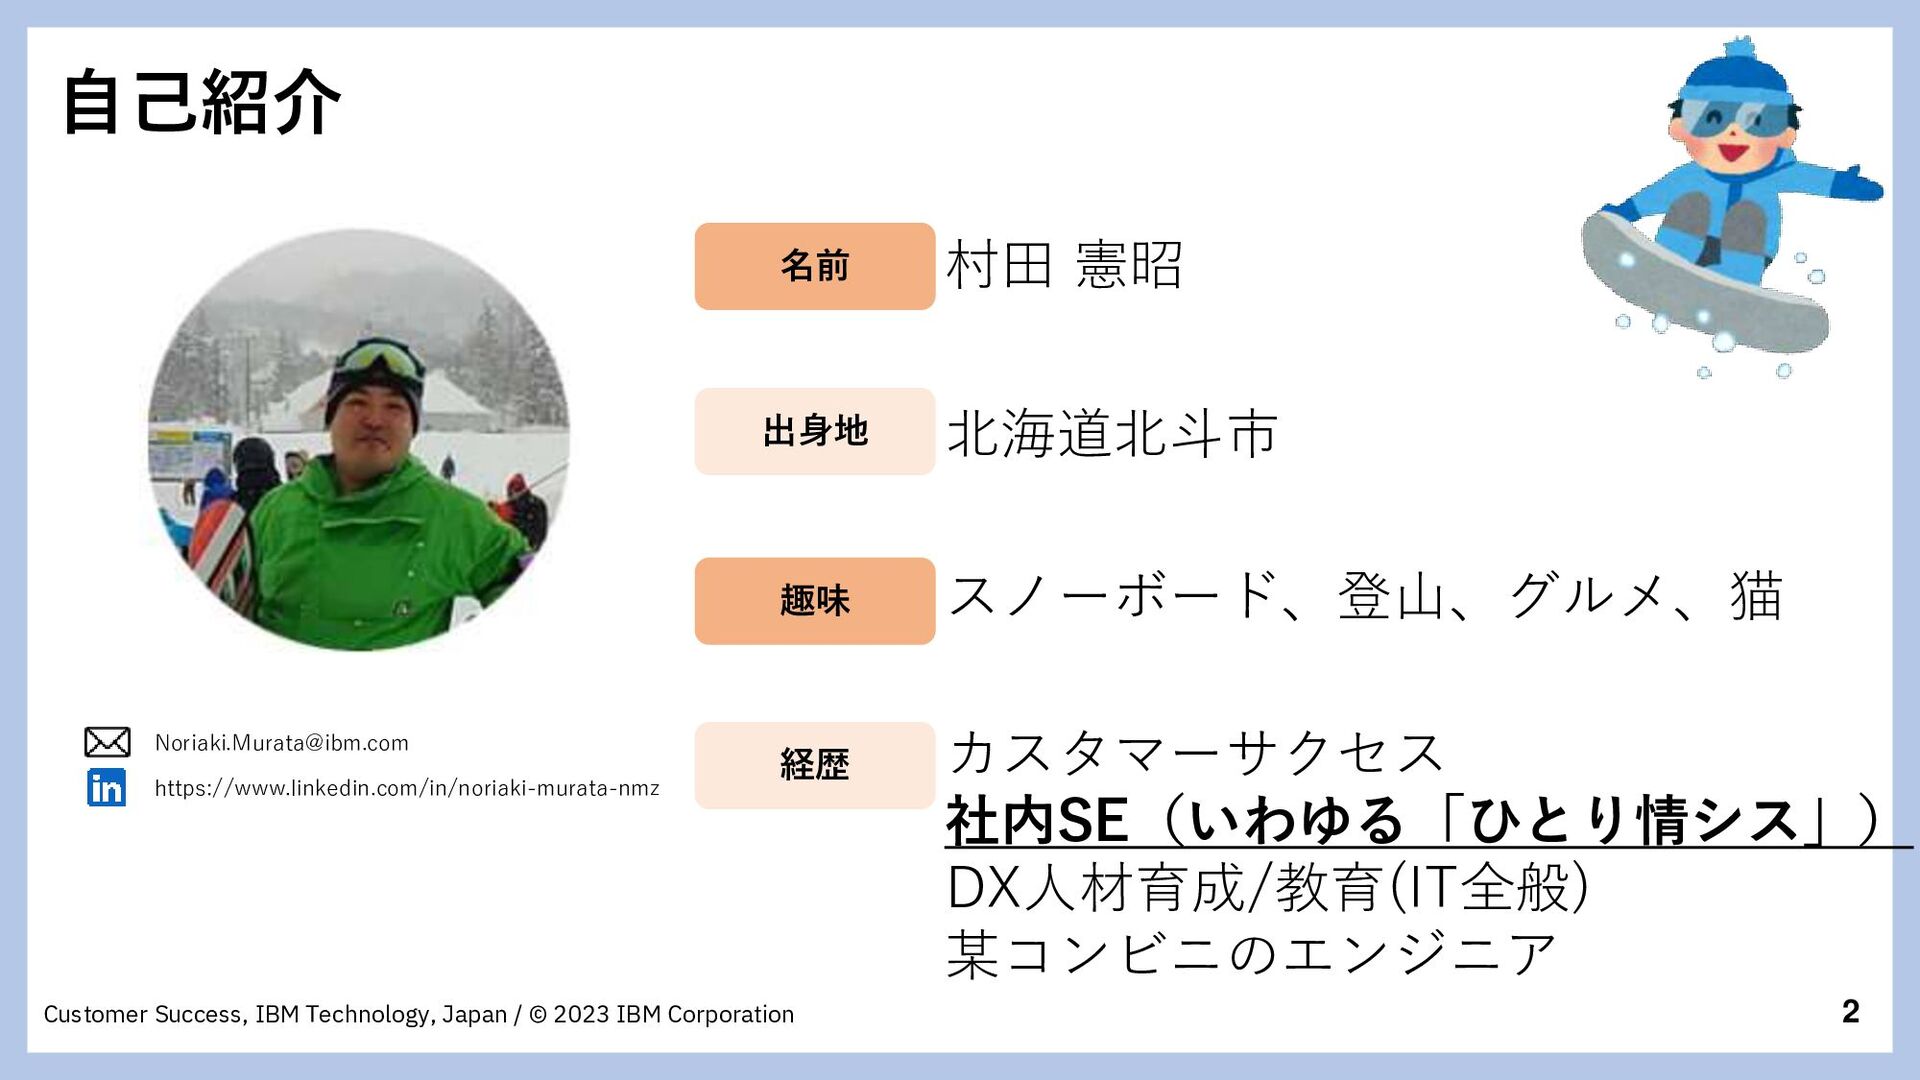
Corporation 自己紹介 村田 憲昭 北海道北斗市 スノーボード、登山、グルメ、猫 カスタマーサクセス 社内SE(いわゆる「ひとり情シス」) DX人材育成/教育(IT全般) 某コンビニのエンジニア 名前 出身地 趣味 経歴
[email protected]
https://www.linkedin.com/in/noriaki-murata-nmz
3 Customer Success, IBM Technology, Japan / © 2023 IBM
Corporation 免責事項 本資料に含まれる情報は可能な限り正確を期しておりますが、 記載された内容に関して、日本アイ・ビー・エム株式会社が 何ら保証するものではありません。 従って、本資料の情報の利用は使用者の責任において 為されるものであり、資料の内容によって受けた 如何なる被害に関しても一切の補償をするものではありません。 本日の模様は録画して、後日公開します! ご認識宜しく御願いいたします。
4 Customer Success, IBM Technology, Japan / © 2023 IBM
Corporation 監視の基本的な 概念がわかる 本Dojoのゴール
5 Customer Success, IBM Technology, Japan / © 2023 IBM
Corporation アンケート
6 Customer Success, IBM Technology, Japan / © 2023 IBM
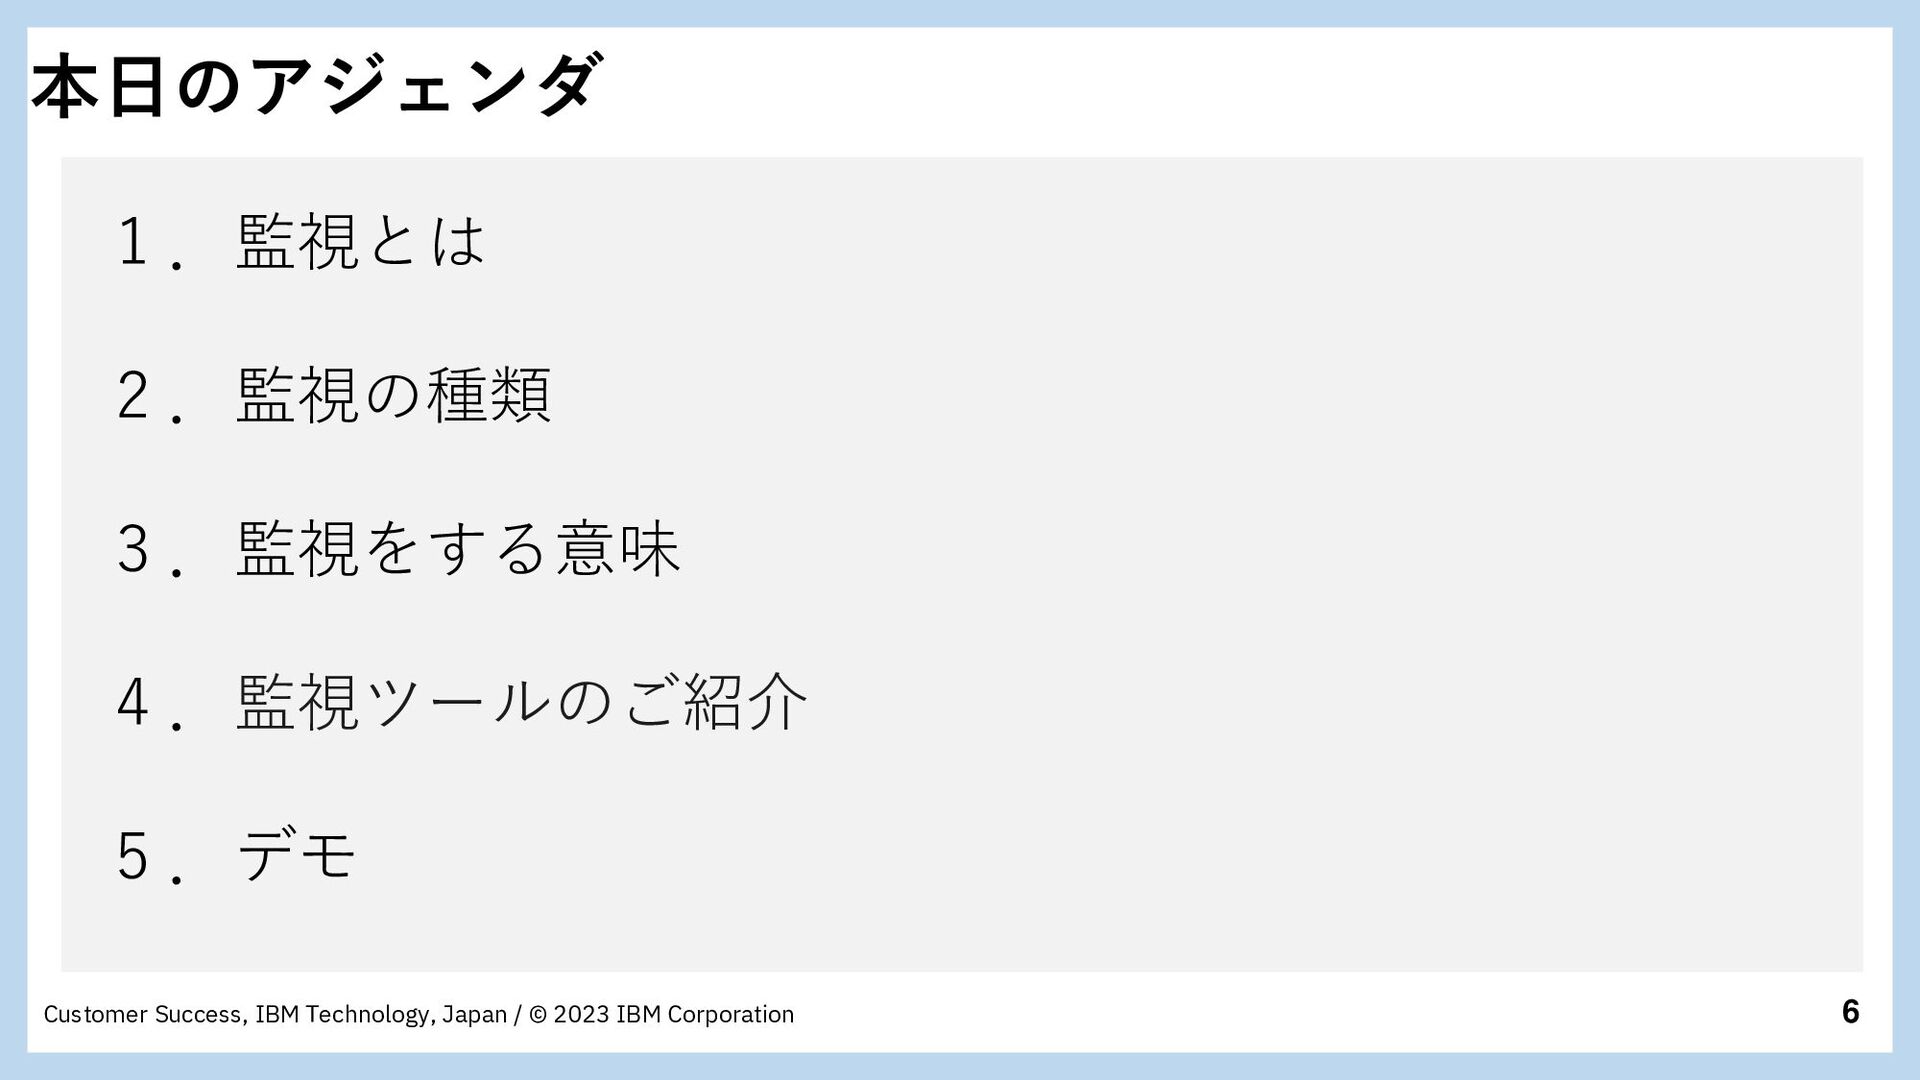
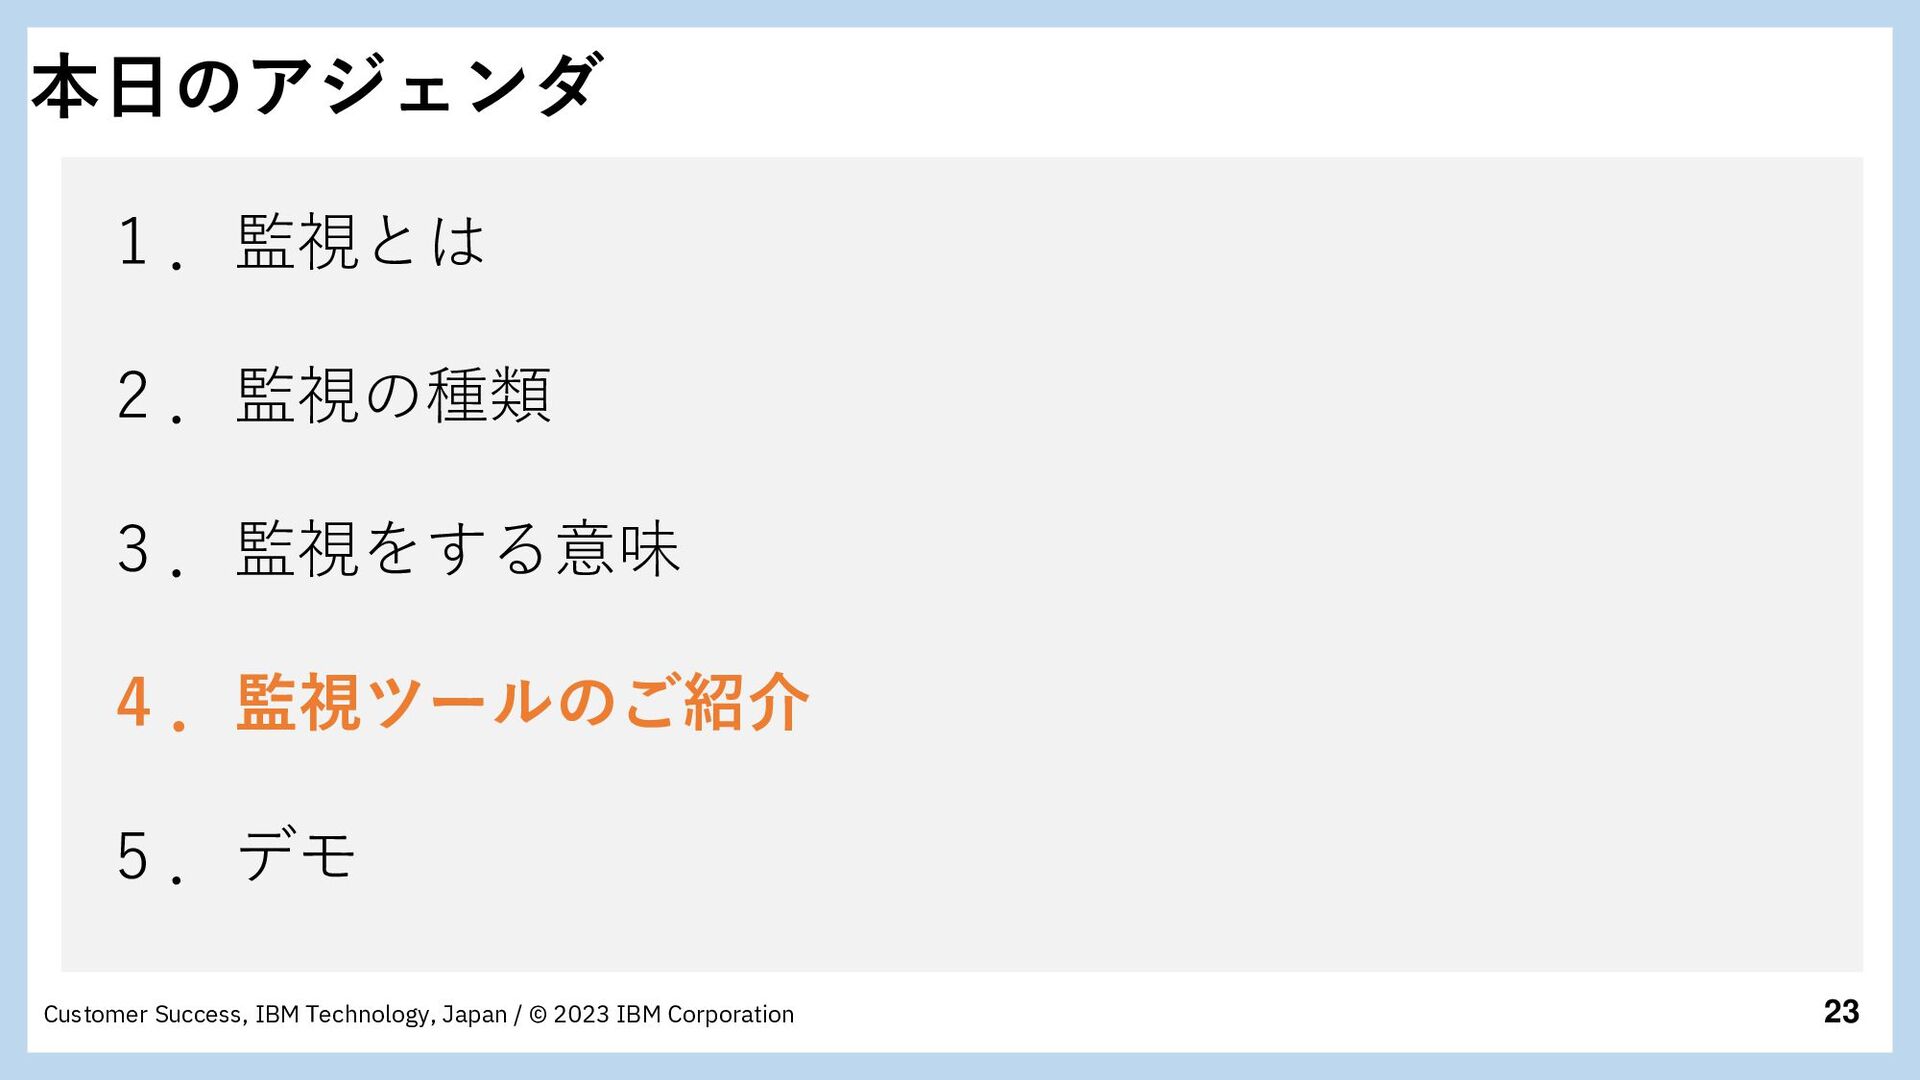
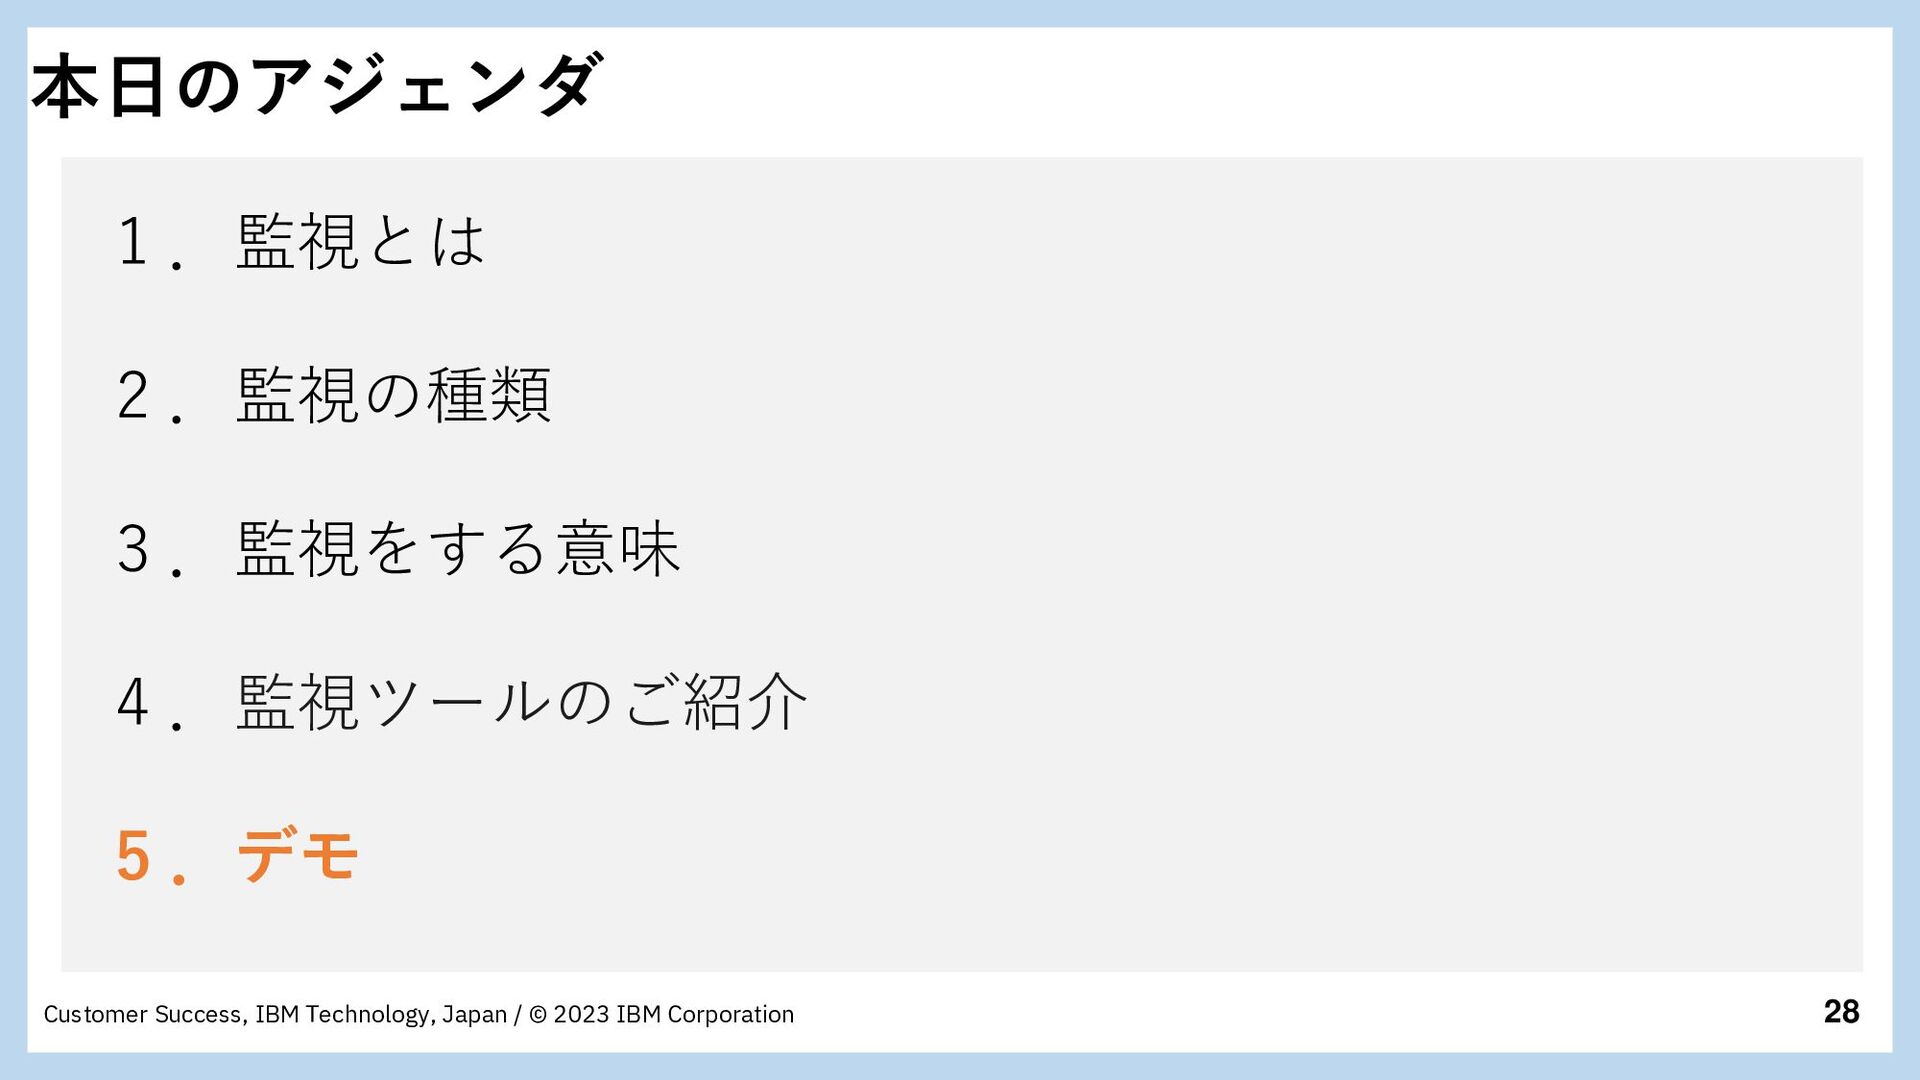
Corporation 本日のアジェンダ 1 .監視とは 2 .監視の種類 3 .監視をする意味 4 .監視ツールのご紹介 5 .デモ
7 Customer Success, IBM Technology, Japan / © 2023 IBM
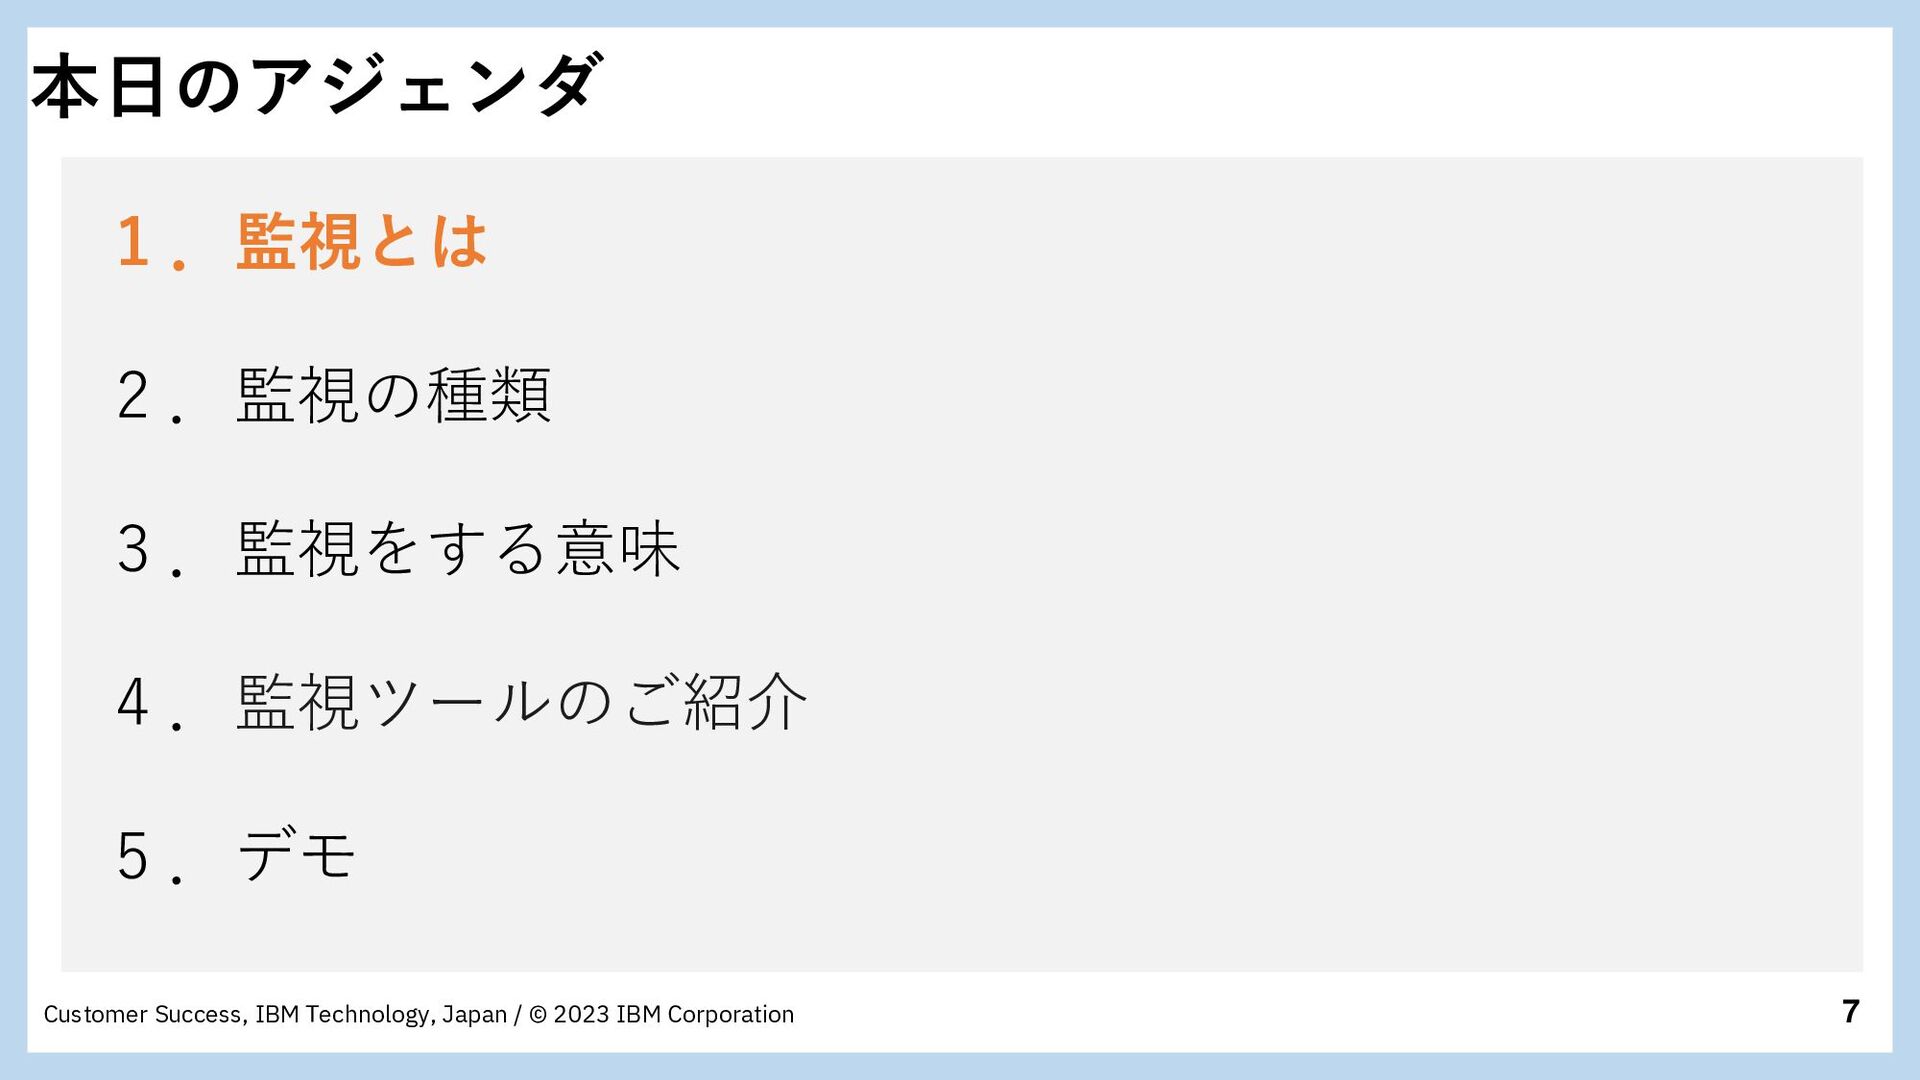
Corporation 本日のアジェンダ 1 .監視とは 2 .監視の種類 3 .監視をする意味 4 .監視ツールのご紹介 5 .デモ
8 Customer Success, IBM Technology, Japan / © 2023 IBM
Corporation 監視とは システムやネットワークの状態や活動を定期的に監視 し、問題や異常な挙動を検知すること 動いてる? 異常ない?
9 Customer Success, IBM Technology, Japan / © 2023 IBM
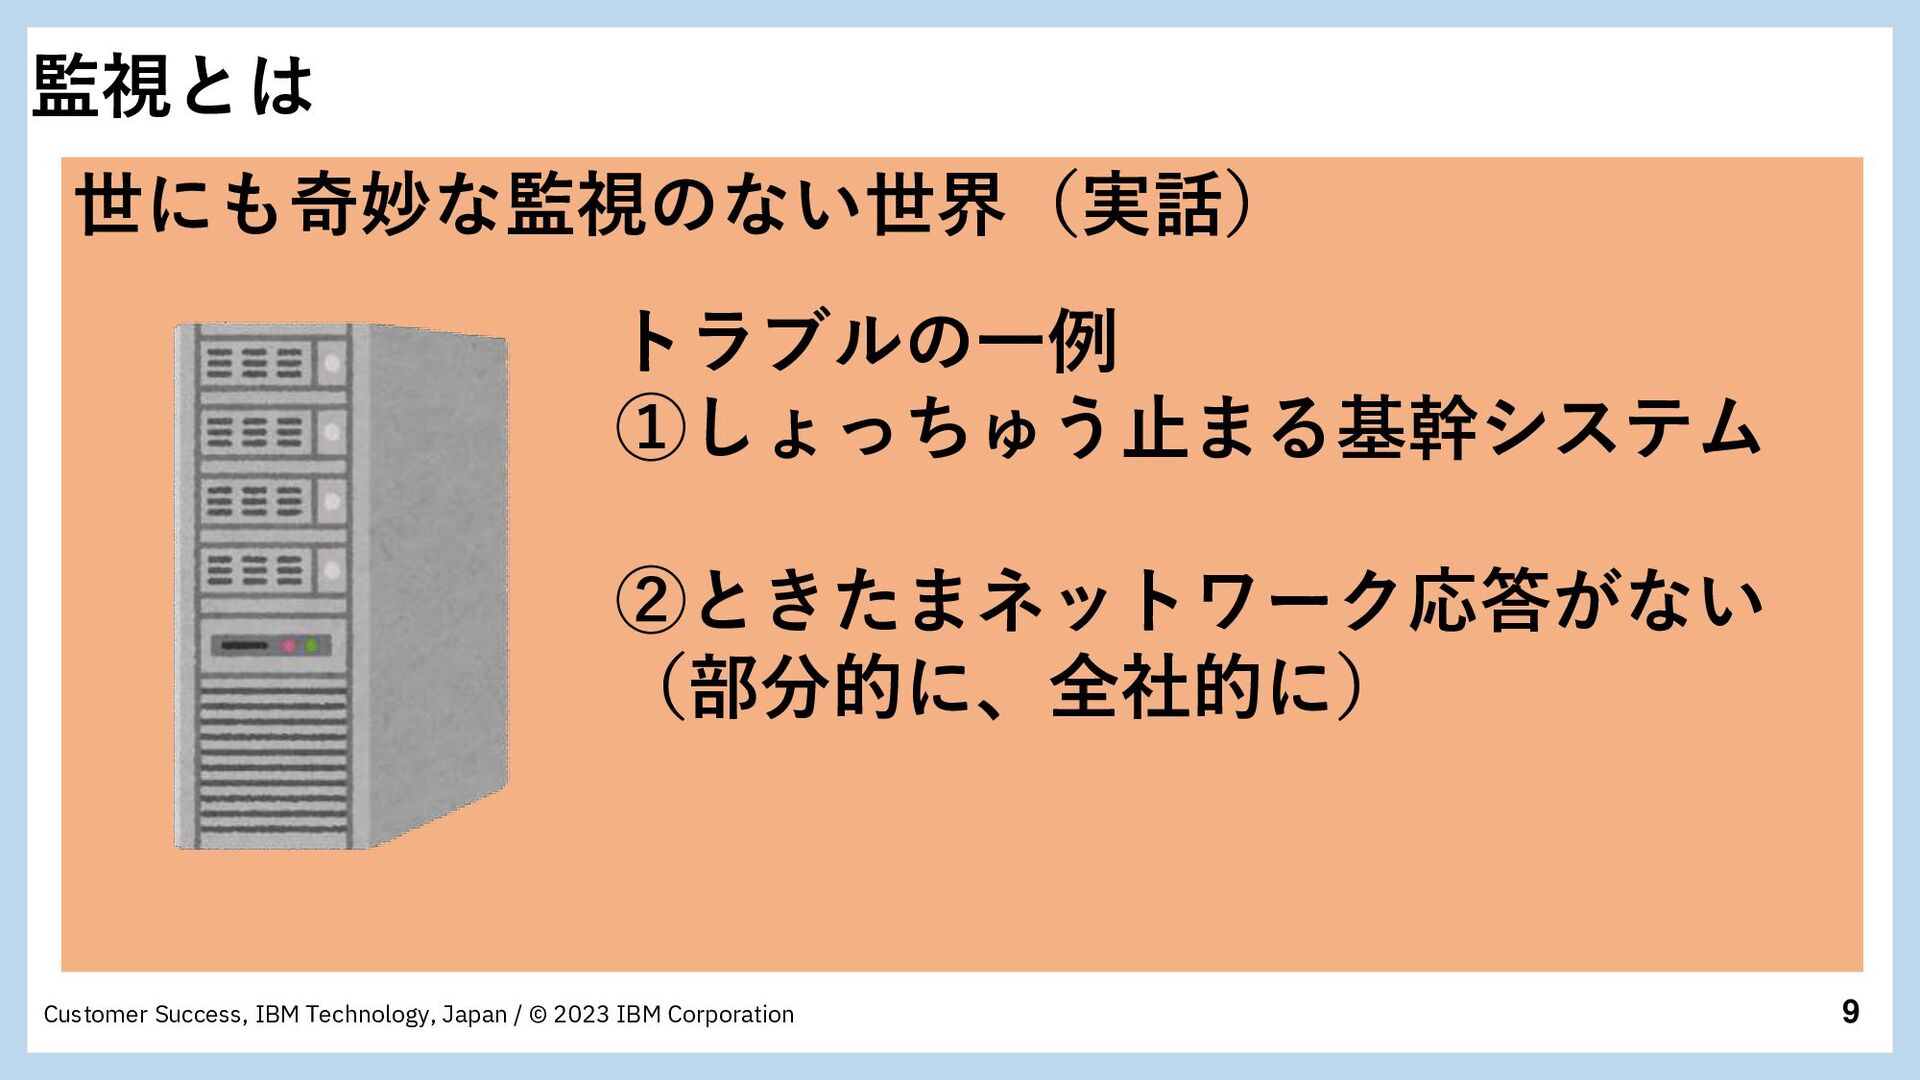
Corporation 監視とは 世にも奇妙な監視のない世界(実話) トラブルの一例 ①しょっちゅう止まる基幹システム ②ときたまネットワーク応答がない (部分的に、全社的に)
10 Customer Success, IBM Technology, Japan / © 2023 IBM
Corporation 監視とは トラブルの原因 ①データベースの停止(!?) ②ブロードキャストストーム (同じハブにLANケーブルつな ぐ) 「監視」していれば対策が打てたのでは?? 世にも奇妙な監視のない世界(実話)
11 Customer Success, IBM Technology, Japan / © 2023 IBM
Corporation 本日のアジェンダ 1 .監視とは 2 .監視の種類 3 .監視をする意味 4 .監視ツールのご紹介 5 .デモ
12 Customer Success, IBM Technology, Japan / © 2023 IBM
Corporation 監視 監視の種類 こんなにあります・・・(一部) 死活監視 リソース監視 プロセス監視 サービス監視 ログ監視 パフォーマンス監視 セキュリティ監視
13 Customer Success, IBM Technology, Japan / © 2023 IBM
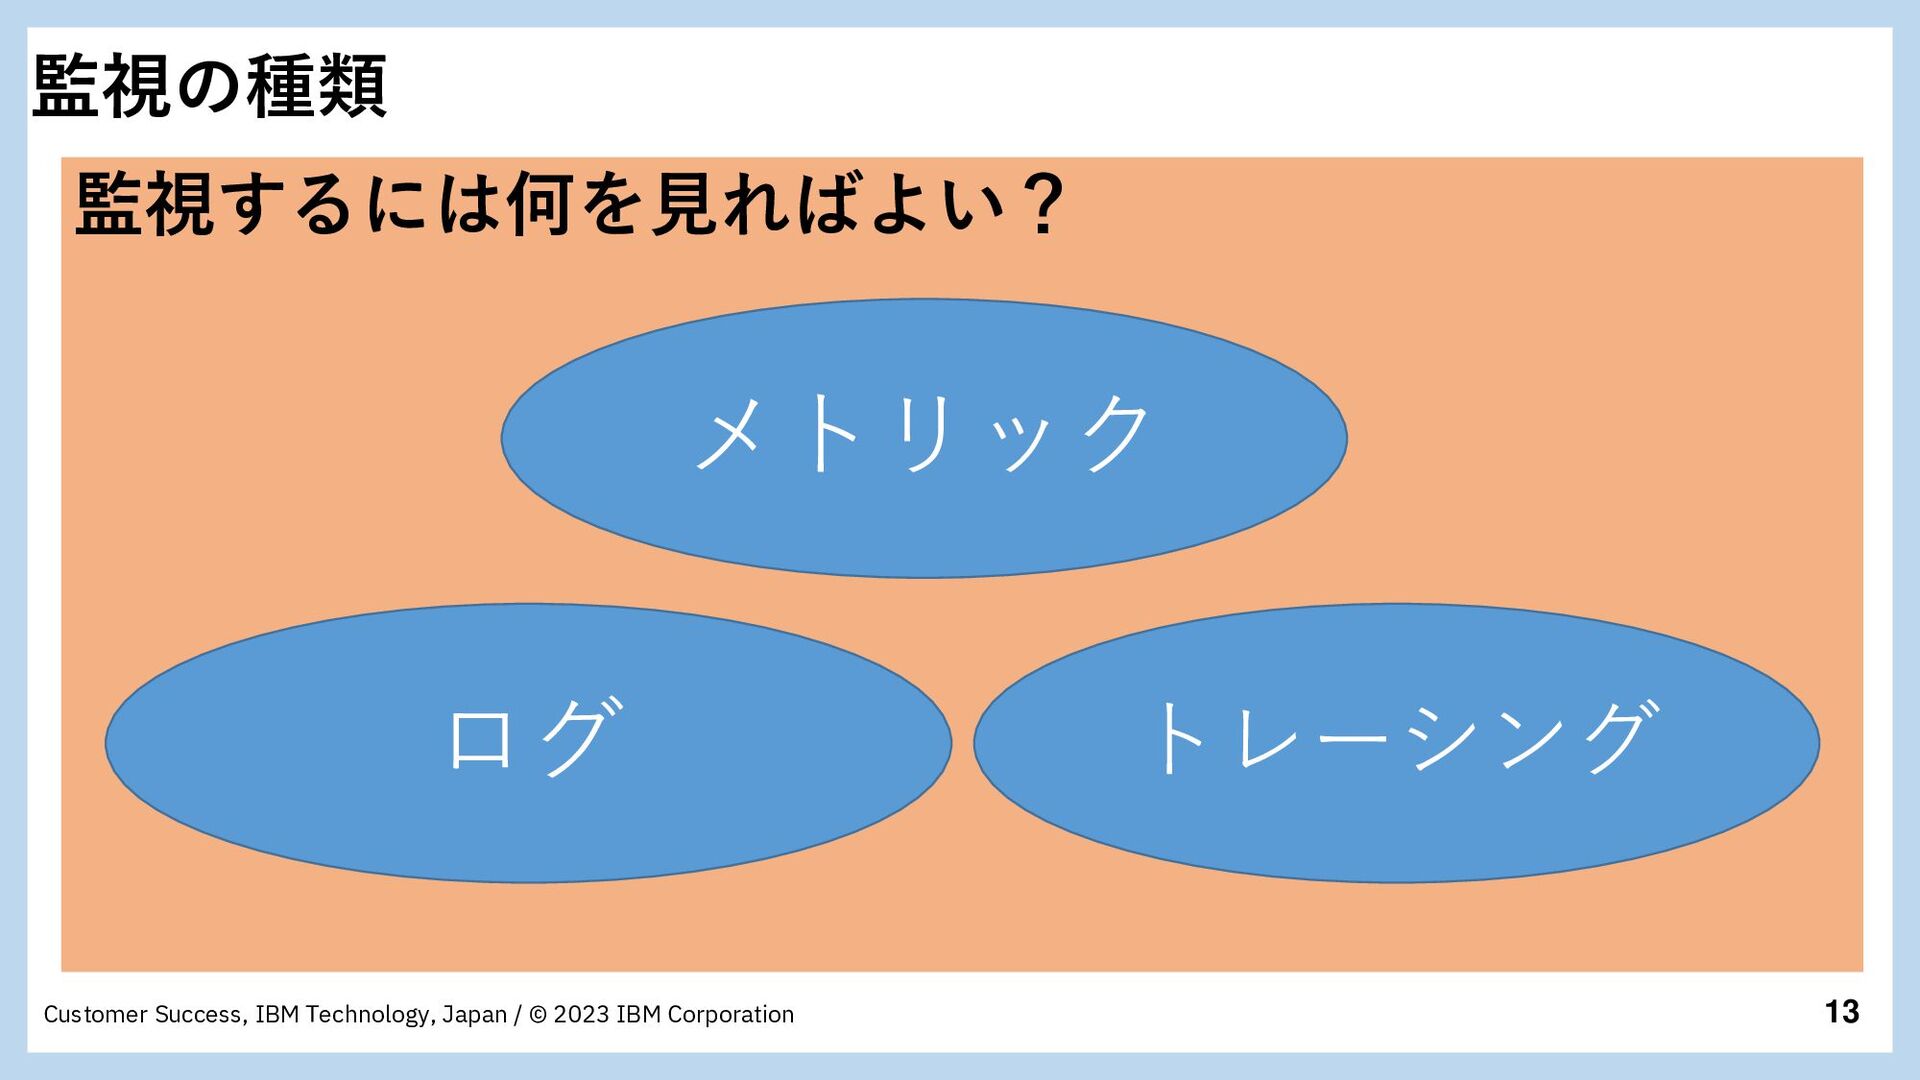
Corporation 監視の種類 監視するには何を見ればよい? メトリック ログ トレーシング
14 Customer Success, IBM Technology, Japan / © 2023 IBM
Corporation 本日のアジェンダ 1 .監視とは 2 .監視の種類 3 .監視をする意味 4 .監視ツールのご紹介 5 .デモ
15 Customer Success, IBM Technology, Japan / © 2023 IBM
Corporation 監視をする意味 監視をするのはなぜ??
16 Customer Success, IBM Technology, Japan / © 2023 IBM
Corporation 監視をする意味 以下の5つにおいて、意味がある • 可用性 • パフォーマンス最適化 • セキュリティ • トラブルシューティングと障害復旧 • 分析と予測
17 Customer Success, IBM Technology, Japan / © 2023 IBM
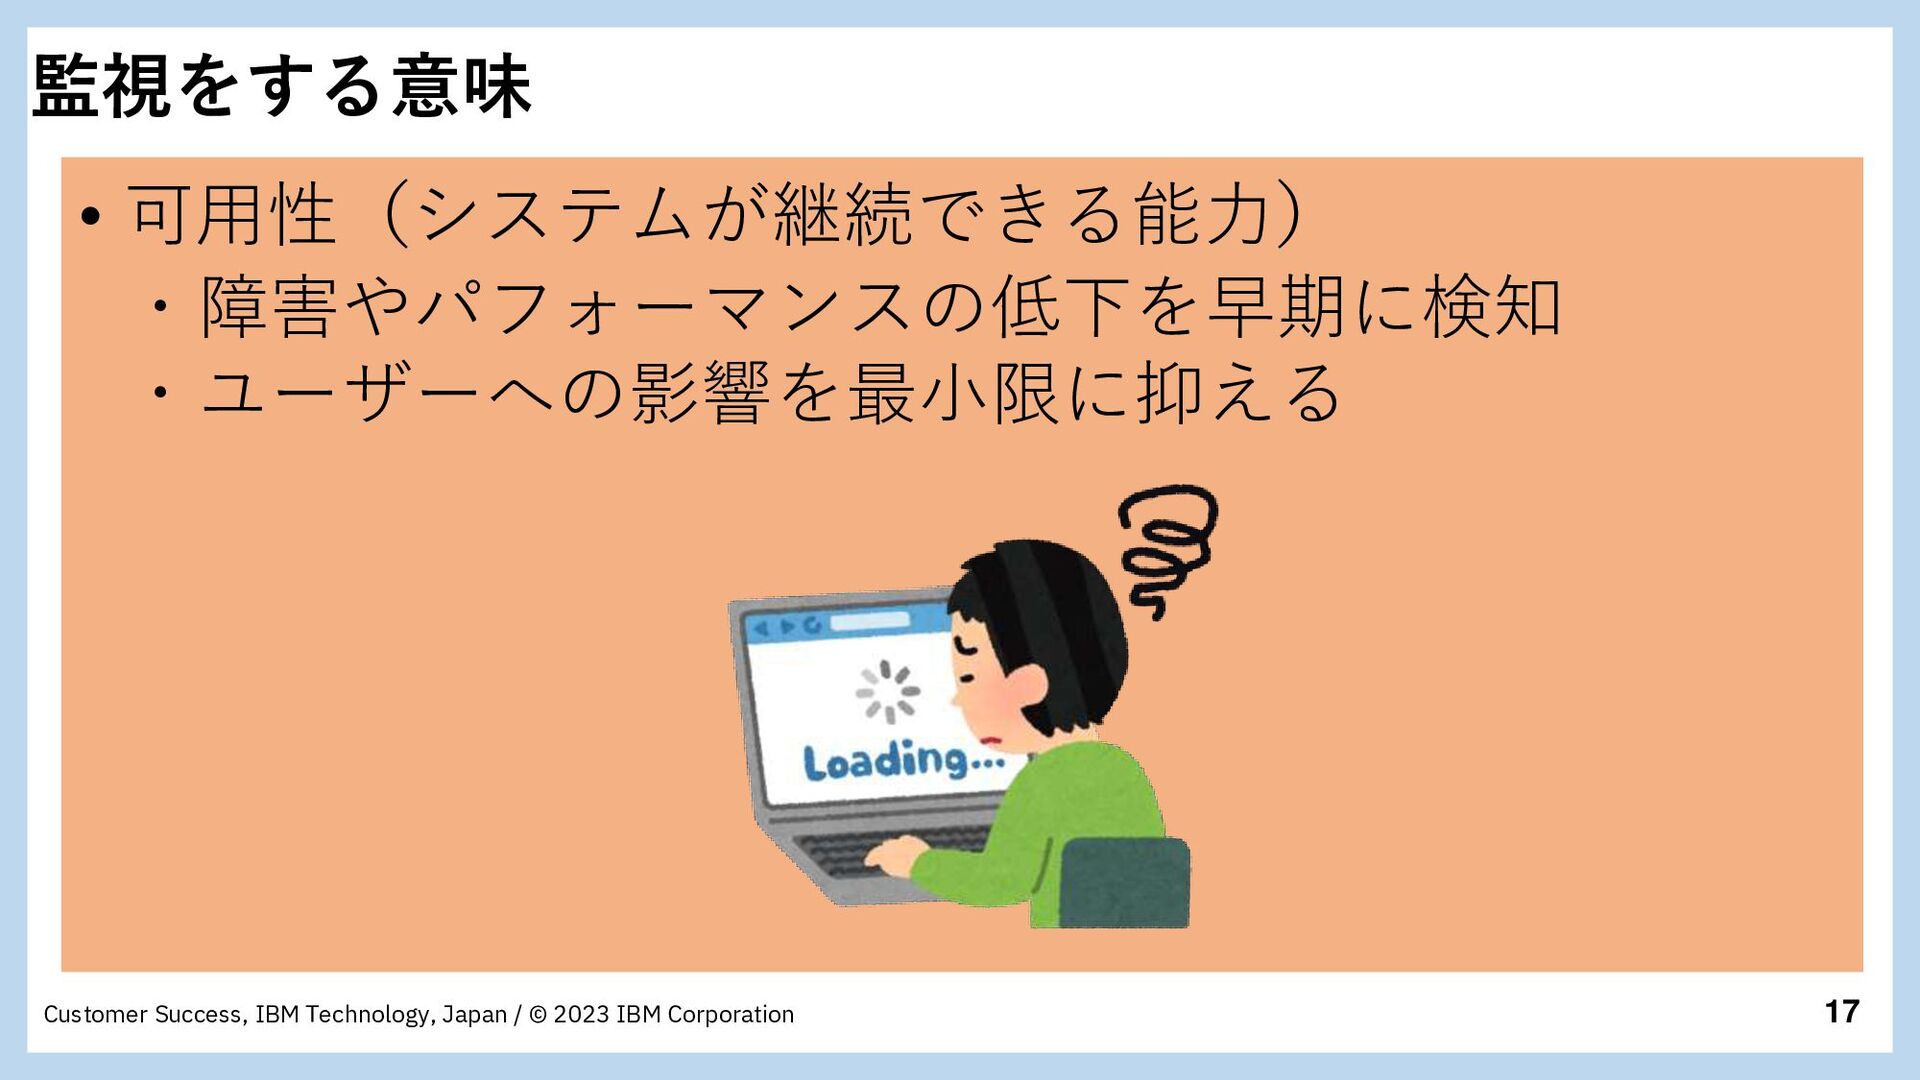
Corporation 監視をする意味 • 可用性(システムが継続できる能力) ・障害やパフォーマンスの低下を早期に検知 ・ユーザーへの影響を最小限に抑える
18 Customer Success, IBM Technology, Japan / © 2023 IBM
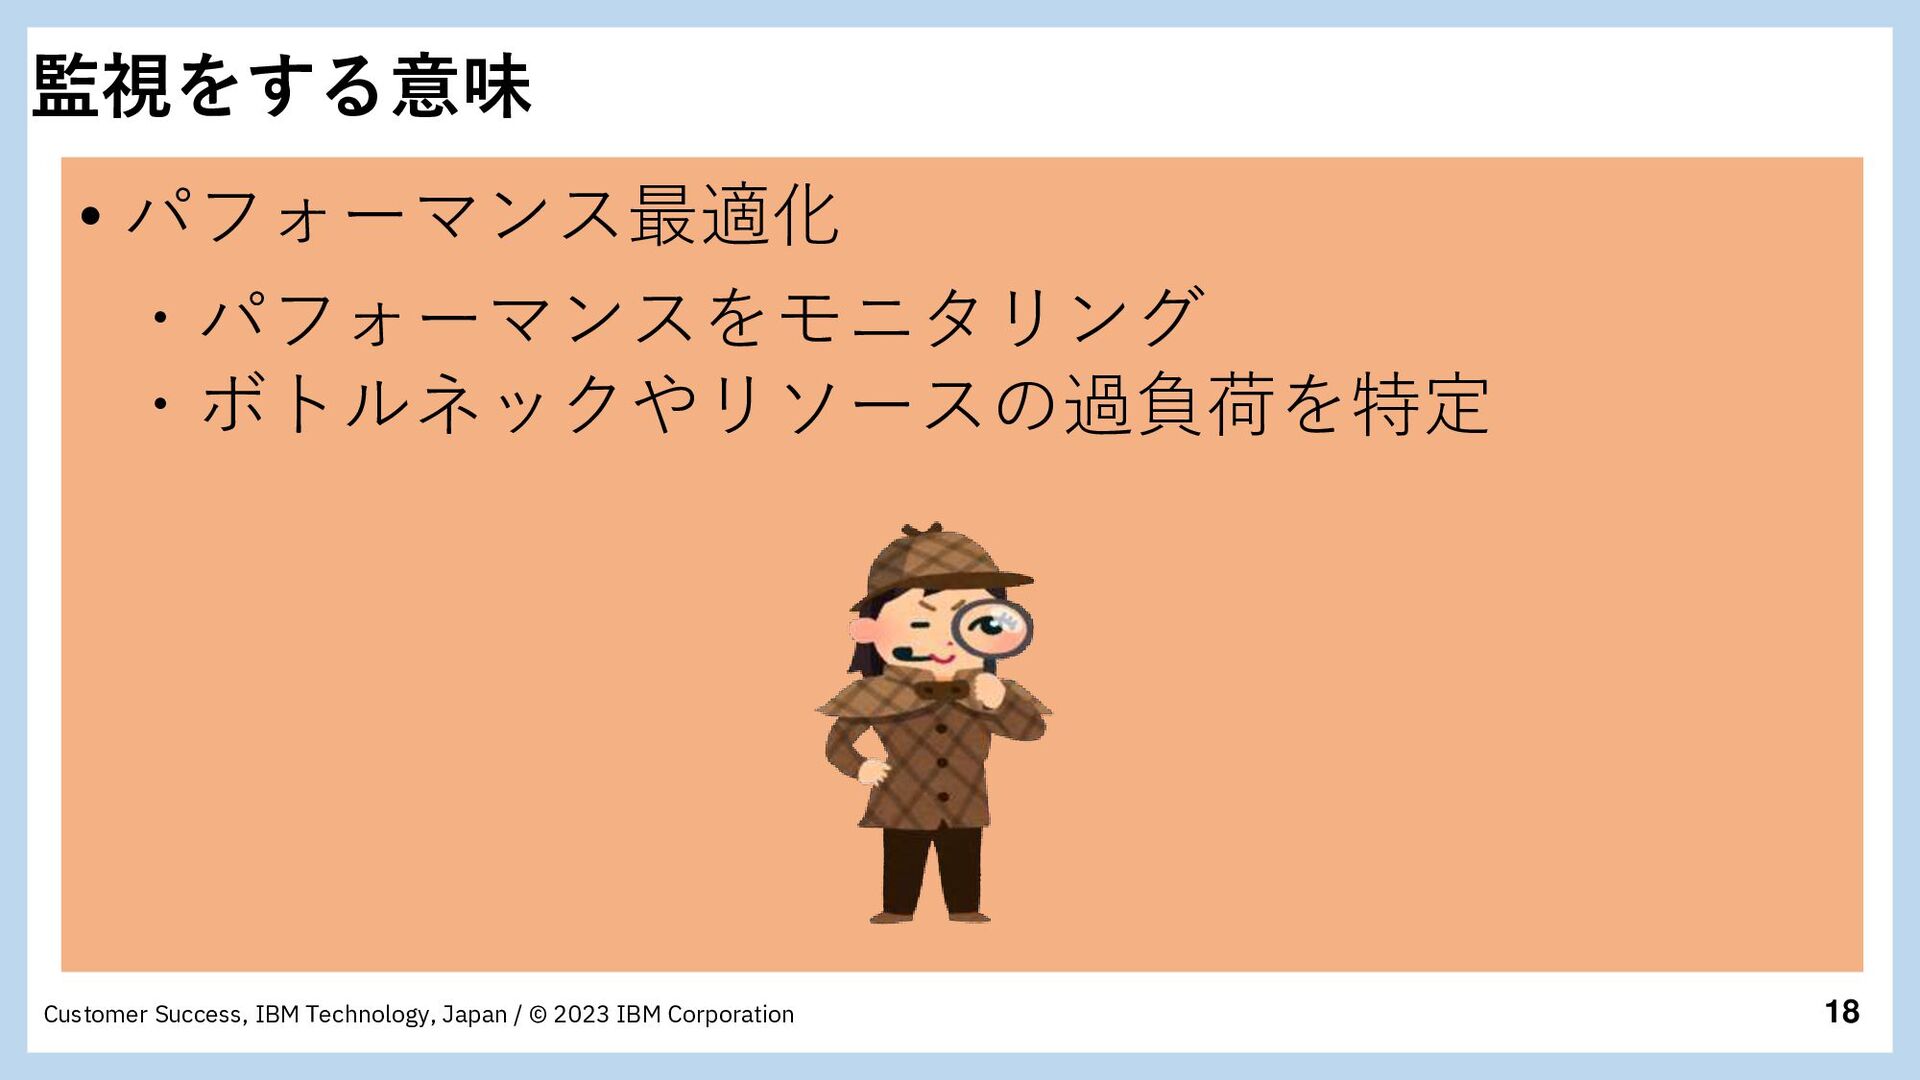
Corporation 監視をする意味 • パフォーマンス最適化 ・パフォーマンスをモニタリング ・ボトルネックやリソースの過負荷を特定
19 Customer Success, IBM Technology, Japan / © 2023 IBM
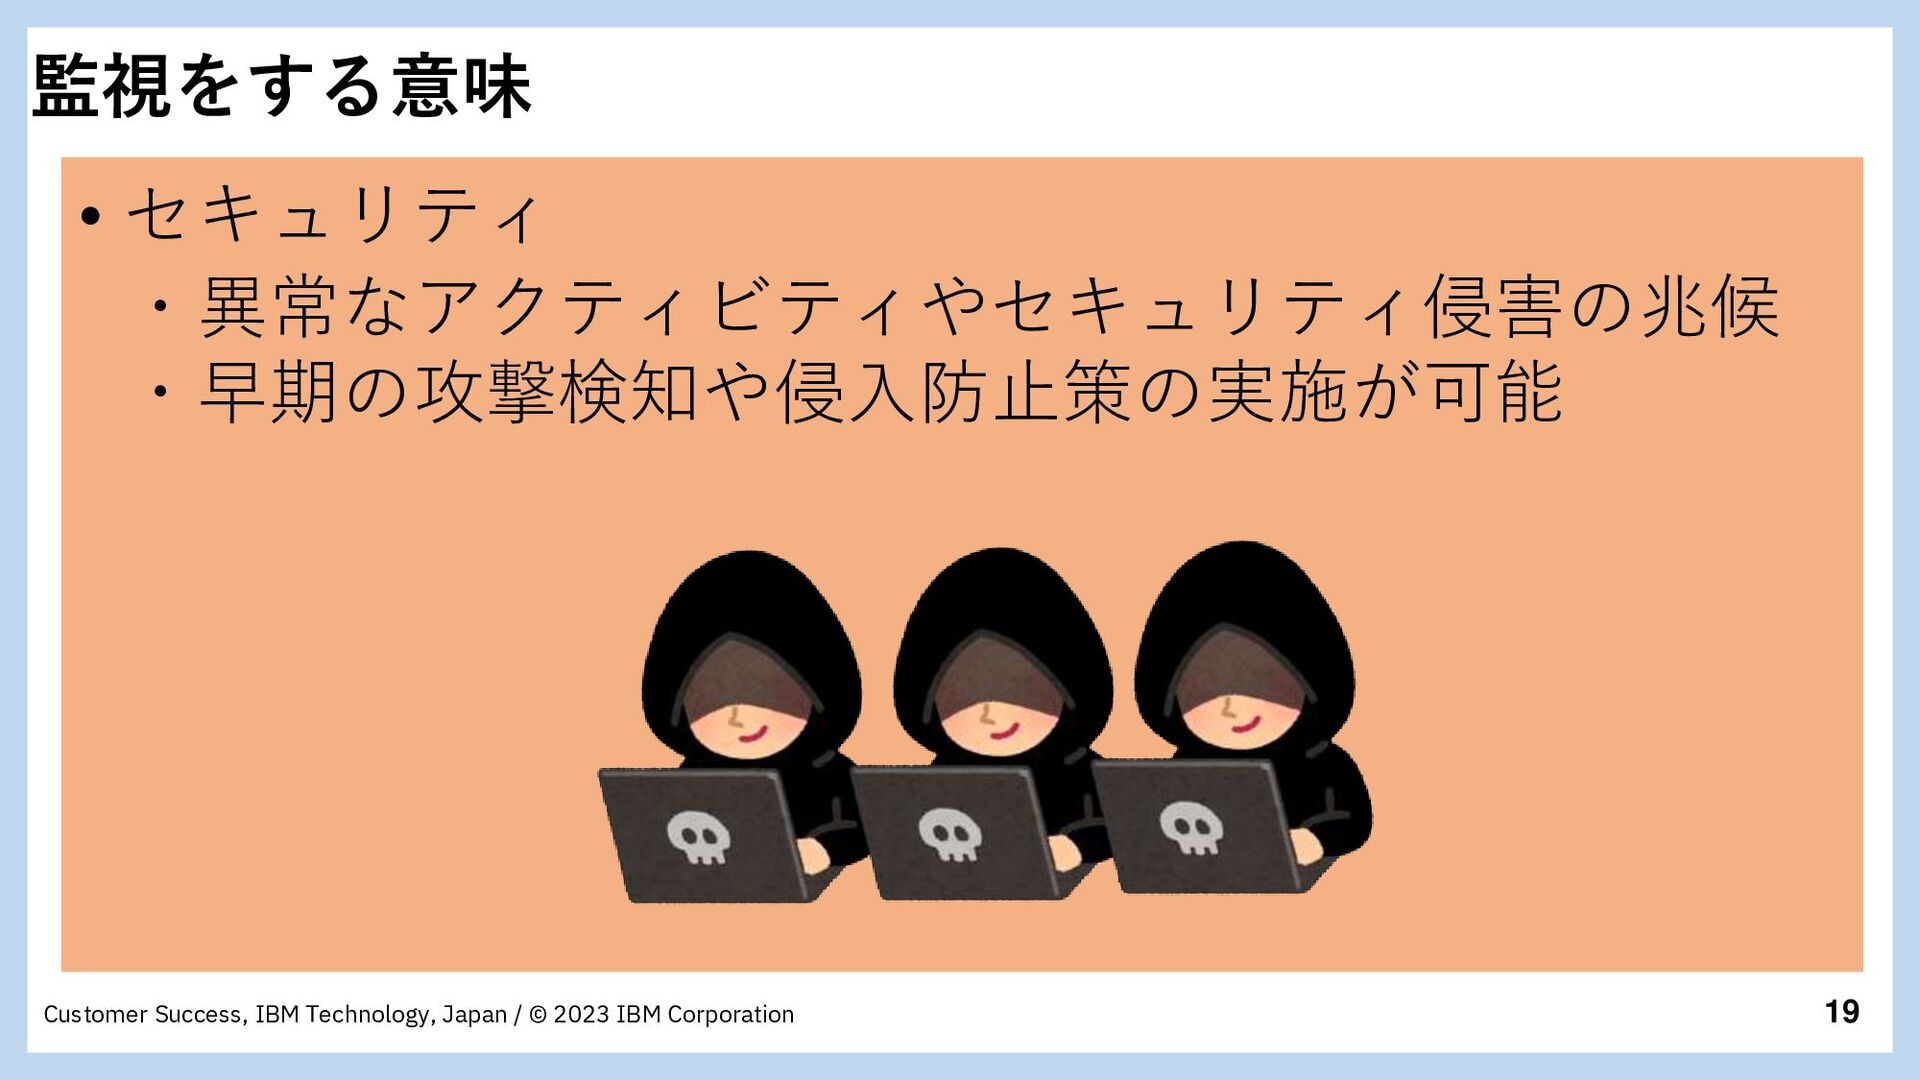
Corporation 監視をする意味 • セキュリティ ・異常なアクティビティやセキュリティ侵害の兆候 ・早期の攻撃検知や侵入防止策の実施が可能
20 Customer Success, IBM Technology, Japan / © 2023 IBM
Corporation 監視をする意味 • トラブルシューティングと障害復旧 ・監視データを活用して問題の特定や原因究明 ・システムのダウンタイムを最小限に抑え ビジネスの持続性を確保
21 Customer Success, IBM Technology, Japan / © 2023 IBM
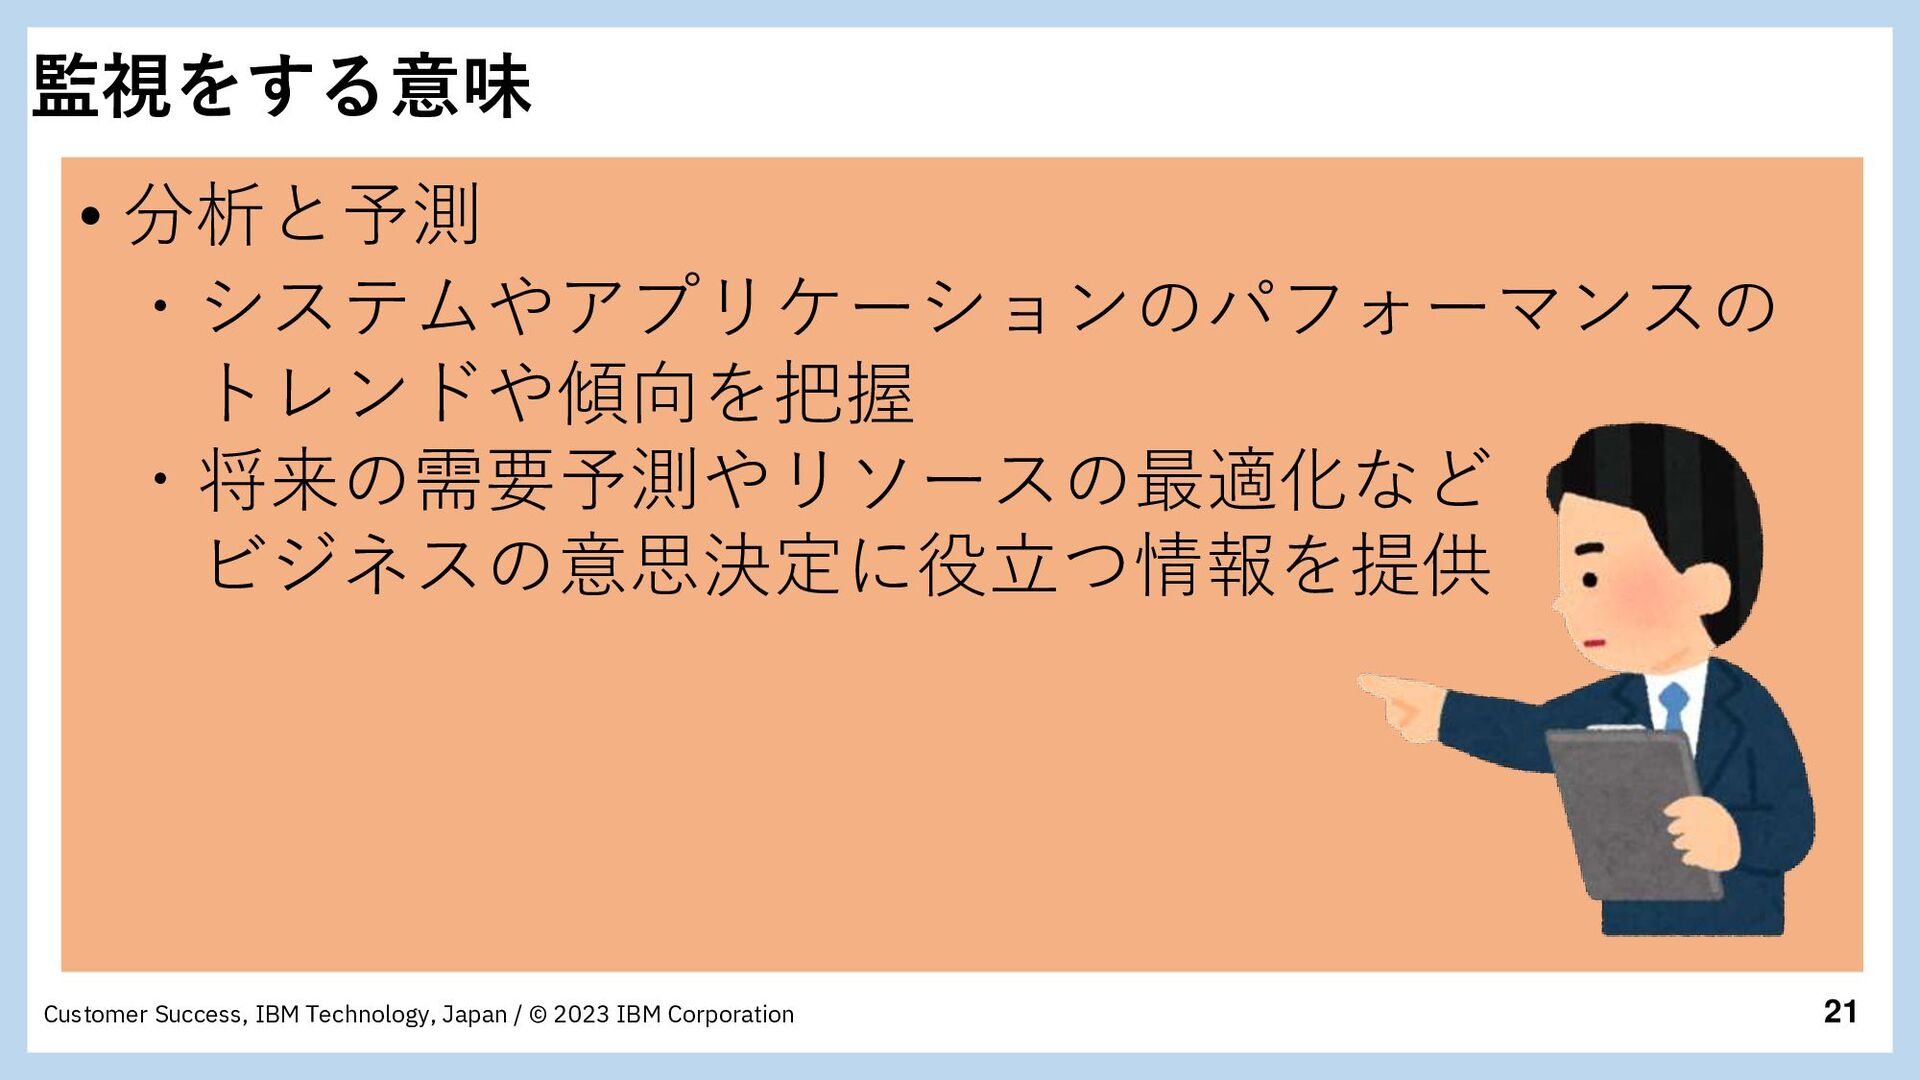
Corporation 監視をする意味 • 分析と予測 ・システムやアプリケーションのパフォーマンスの トレンドや傾向を把握 ・将来の需要予測やリソースの最適化など ビジネスの意思決定に役立つ情報を提供
22 Customer Success, IBM Technology, Japan / © 2023 IBM
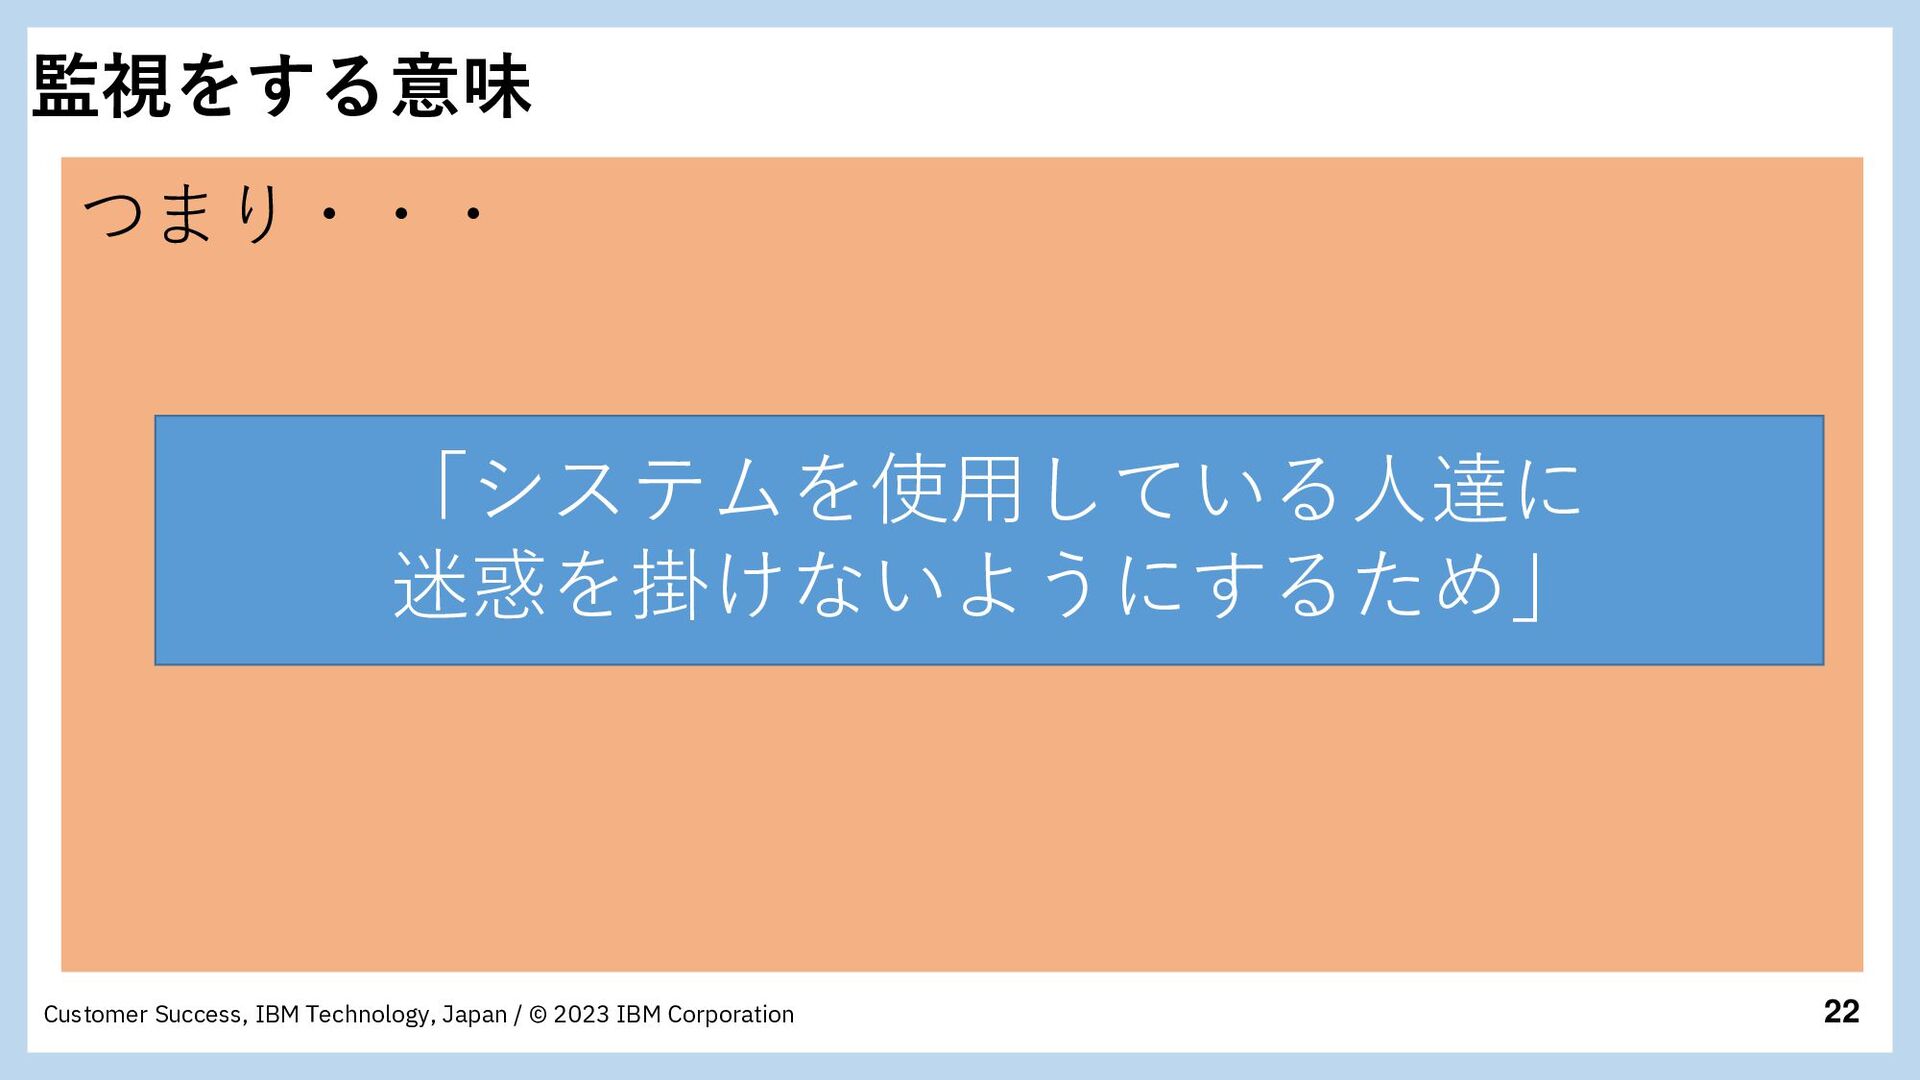
Corporation 監視をする意味 つまり・・・ 「システムを使用している人達に 迷惑を掛けないようにするため」
23 Customer Success, IBM Technology, Japan / © 2023 IBM
Corporation 本日のアジェンダ 1 .監視とは 2 .監視の種類 3 .監視をする意味 4 .監視ツールのご紹介 5 .デモ
24 Customer Success, IBM Technology, Japan / © 2023 IBM
Corporation 監視ツールのご紹介 Prometheus (プロメテウス)
25 Customer Success, IBM Technology, Japan / © 2023 IBM
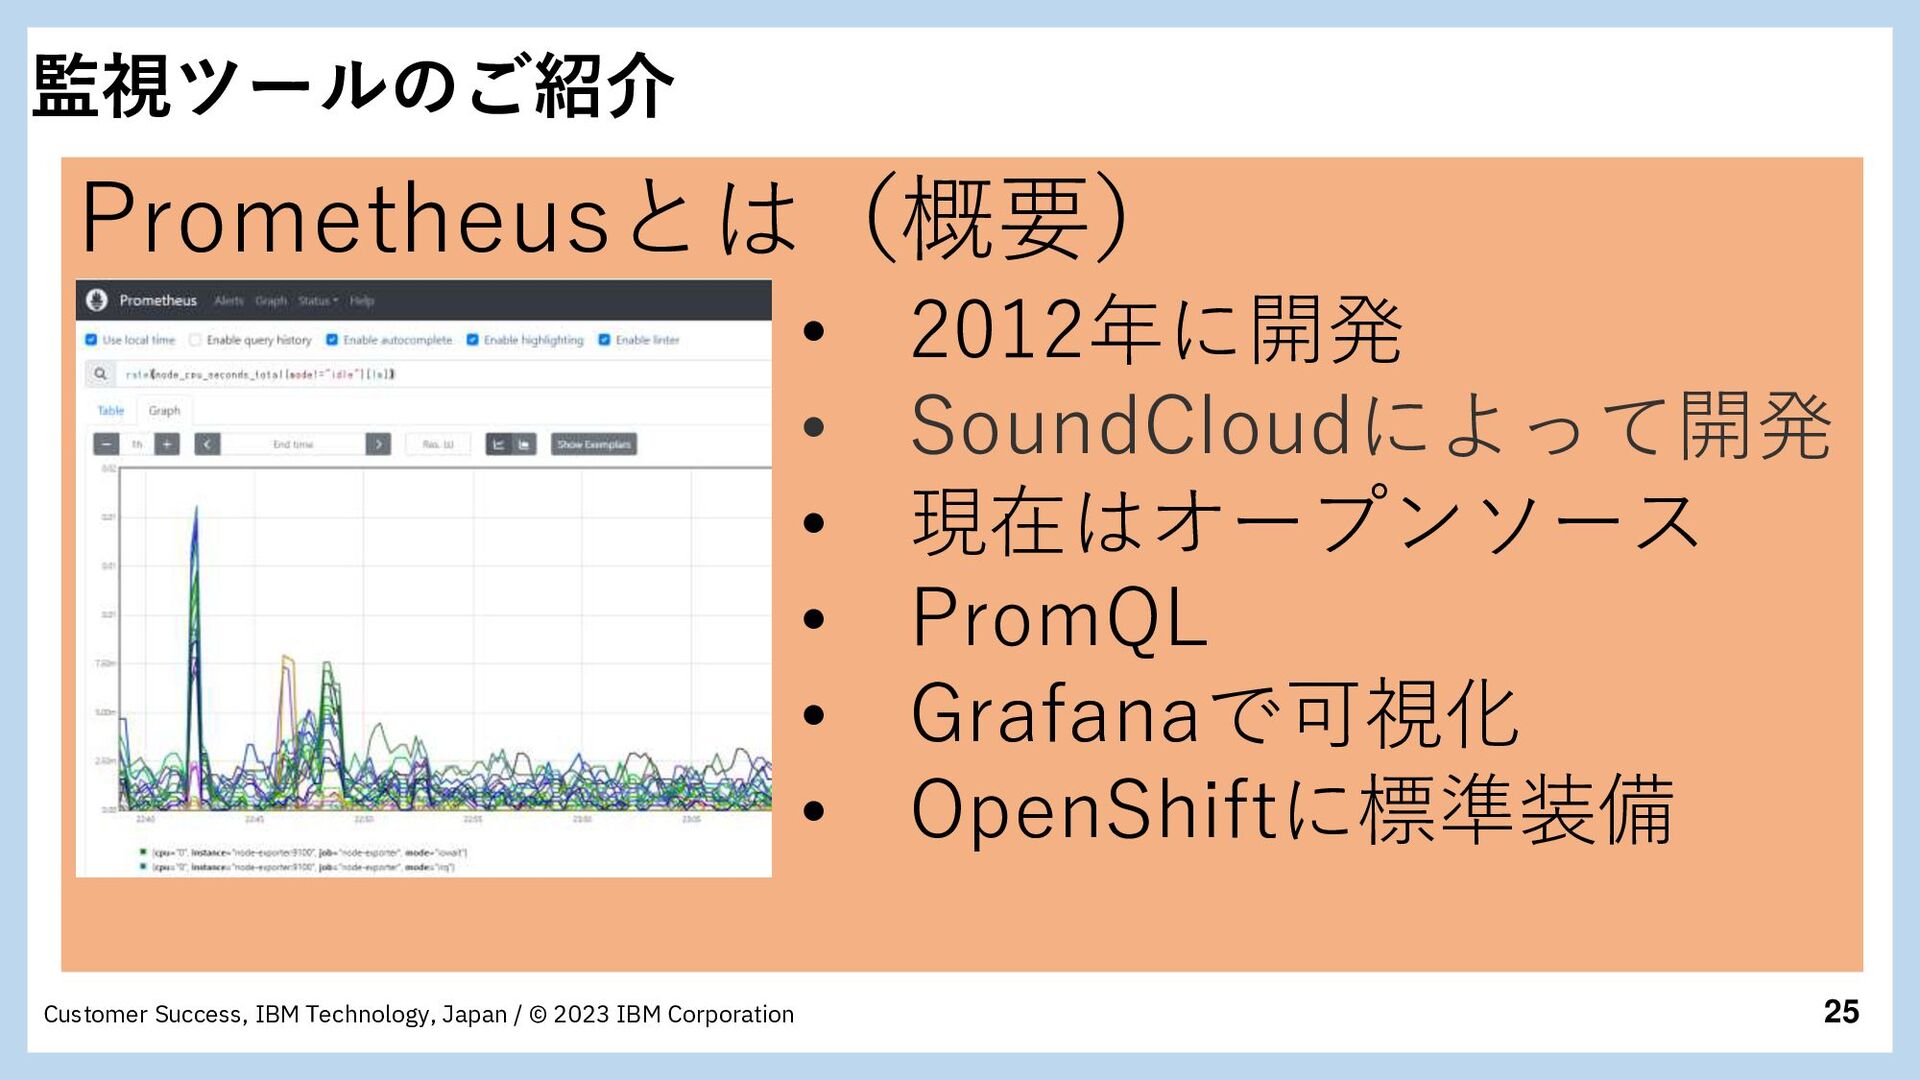
Corporation 監視ツールのご紹介 Prometheusとは(概要) • 2012年に開発 • SoundCloudによって開発 • 現在はオープンソース • PromQL • Grafanaで可視化 • OpenShiftに標準装備
26 Customer Success, IBM Technology, Japan / © 2023 IBM
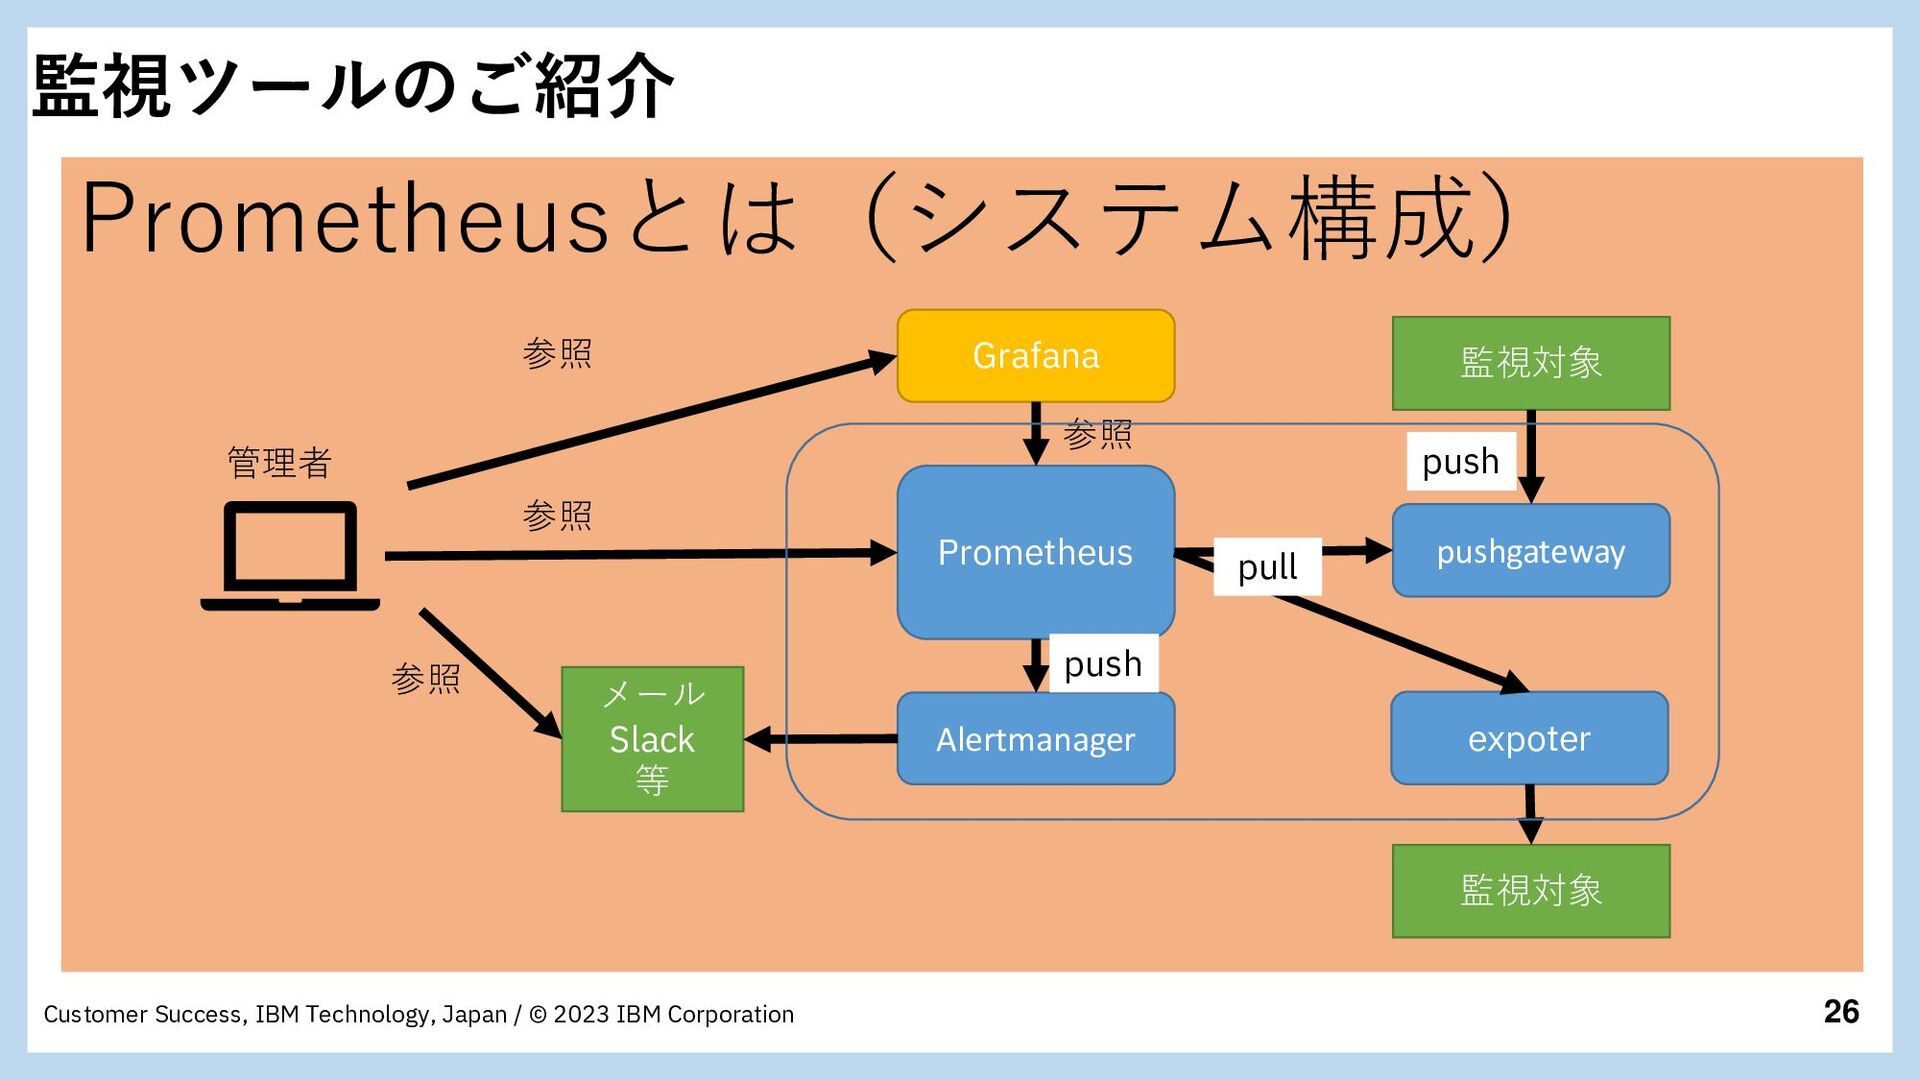
Corporation 監視ツールのご紹介 Prometheusとは(システム構成) Prometheus Alertmanager pushgateway expoter 監視対象 Grafana 監視対象 参照 参照 参照 push push pull メール Slack 等 管理者 参照
27 Customer Success, IBM Technology, Japan / © 2023 IBM
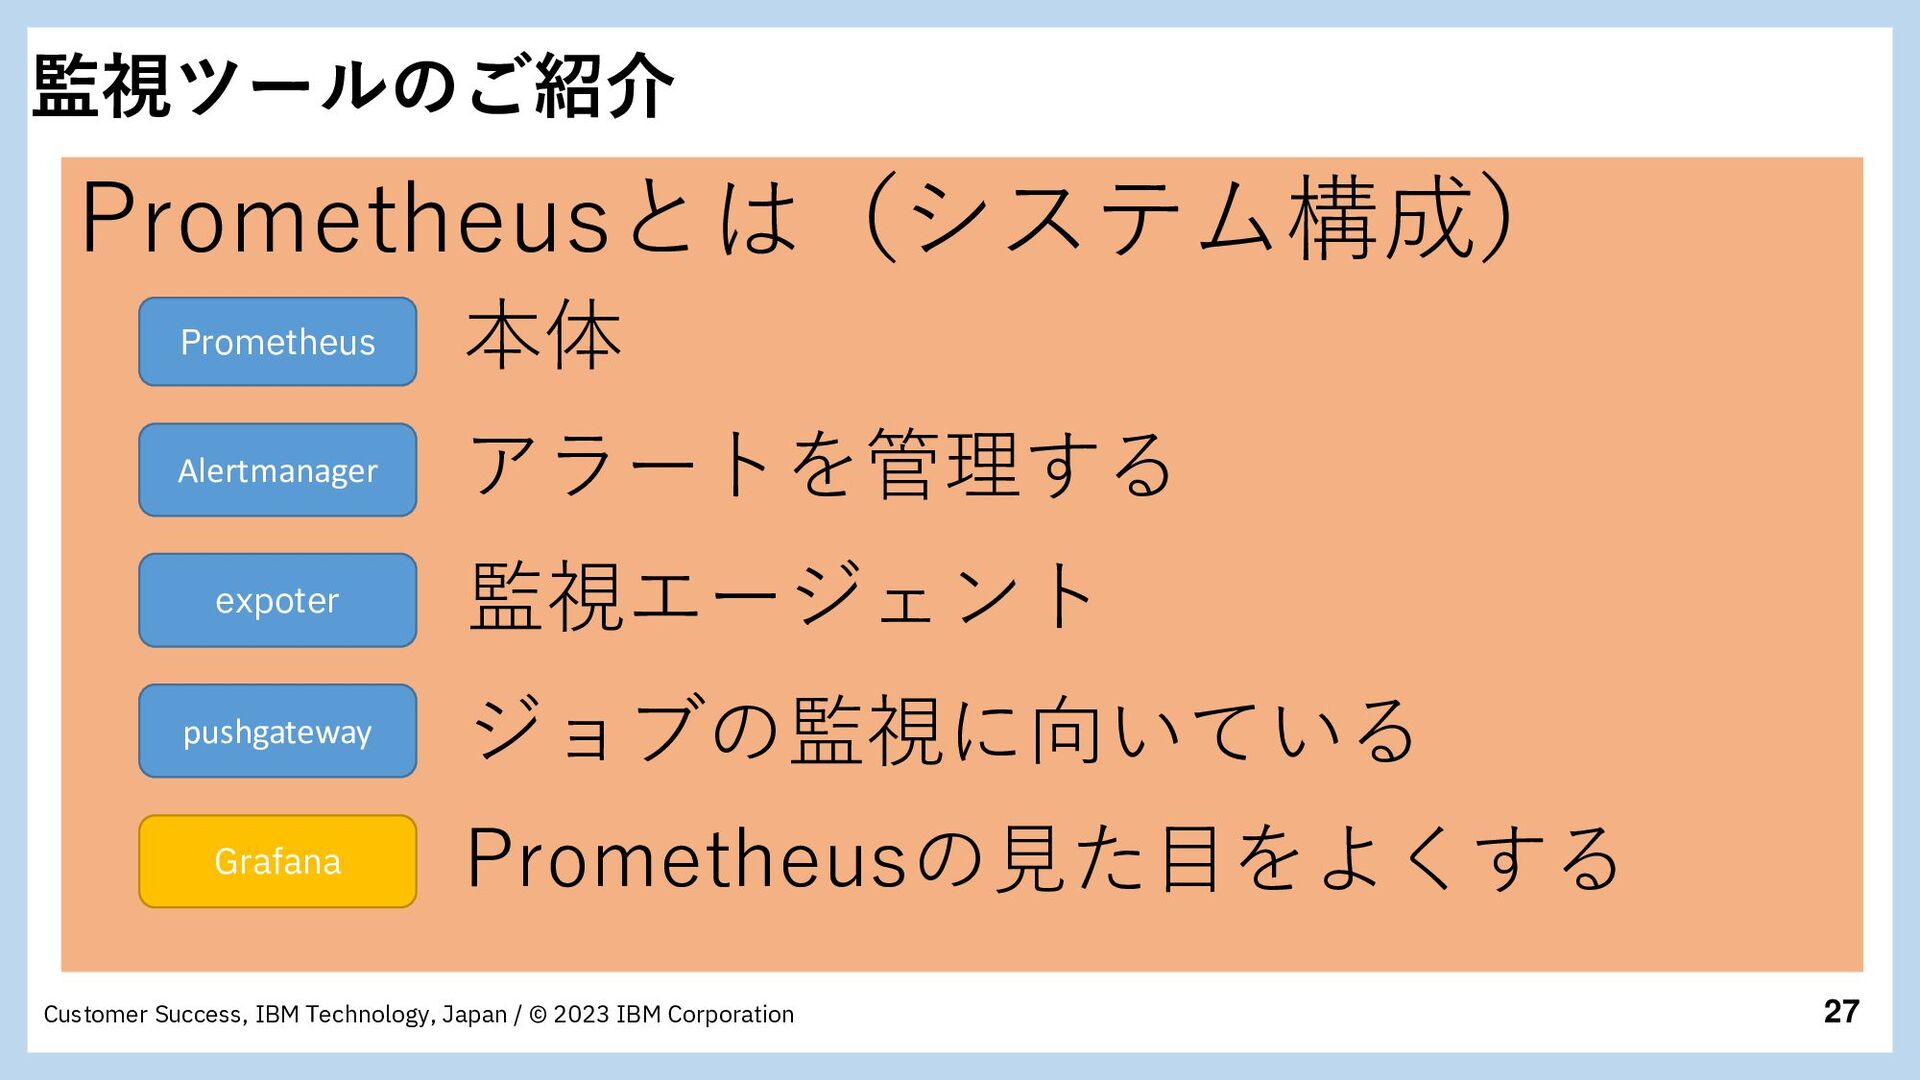
Corporation 監視ツールのご紹介 Prometheusとは(システム構成) Alertmanager pushgateway expoter Grafana Prometheus 本体 アラートを管理する 監視エージェント ジョブの監視に向いている Prometheusの見た目をよくする
28 Customer Success, IBM Technology, Japan / © 2023 IBM
Corporation 本日のアジェンダ 1 .監視とは 2 .監視の種類 3 .監視をする意味 4 .監視ツールのご紹介 5 .デモ
29 Customer Success, IBM Technology, Japan / © 2023 IBM
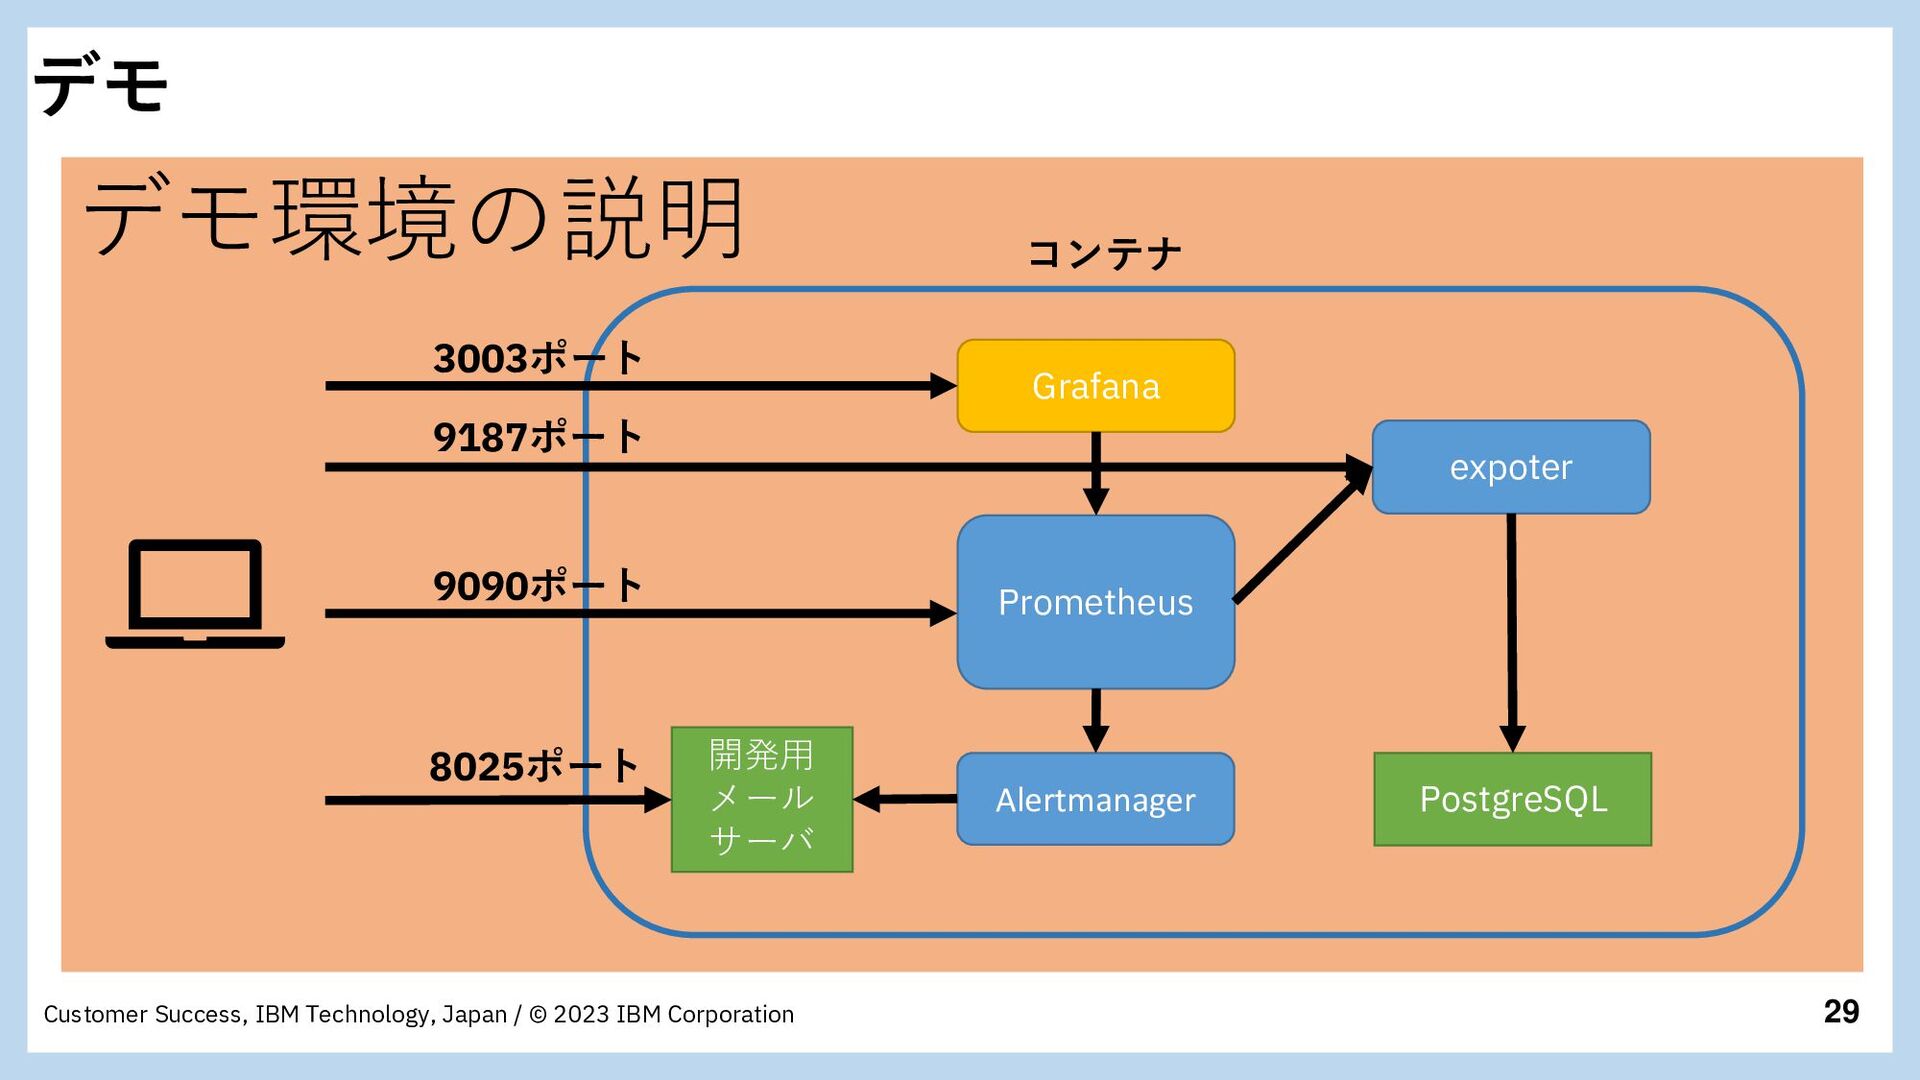
Corporation デモ デモ環境の説明 Prometheus Alertmanager expoter Grafana PostgreSQL 開発用 メール サーバ コンテナ 3003ポート 9090ポート 8025ポート 9187ポート
30 Customer Success, IBM Technology, Japan / © 2023 IBM
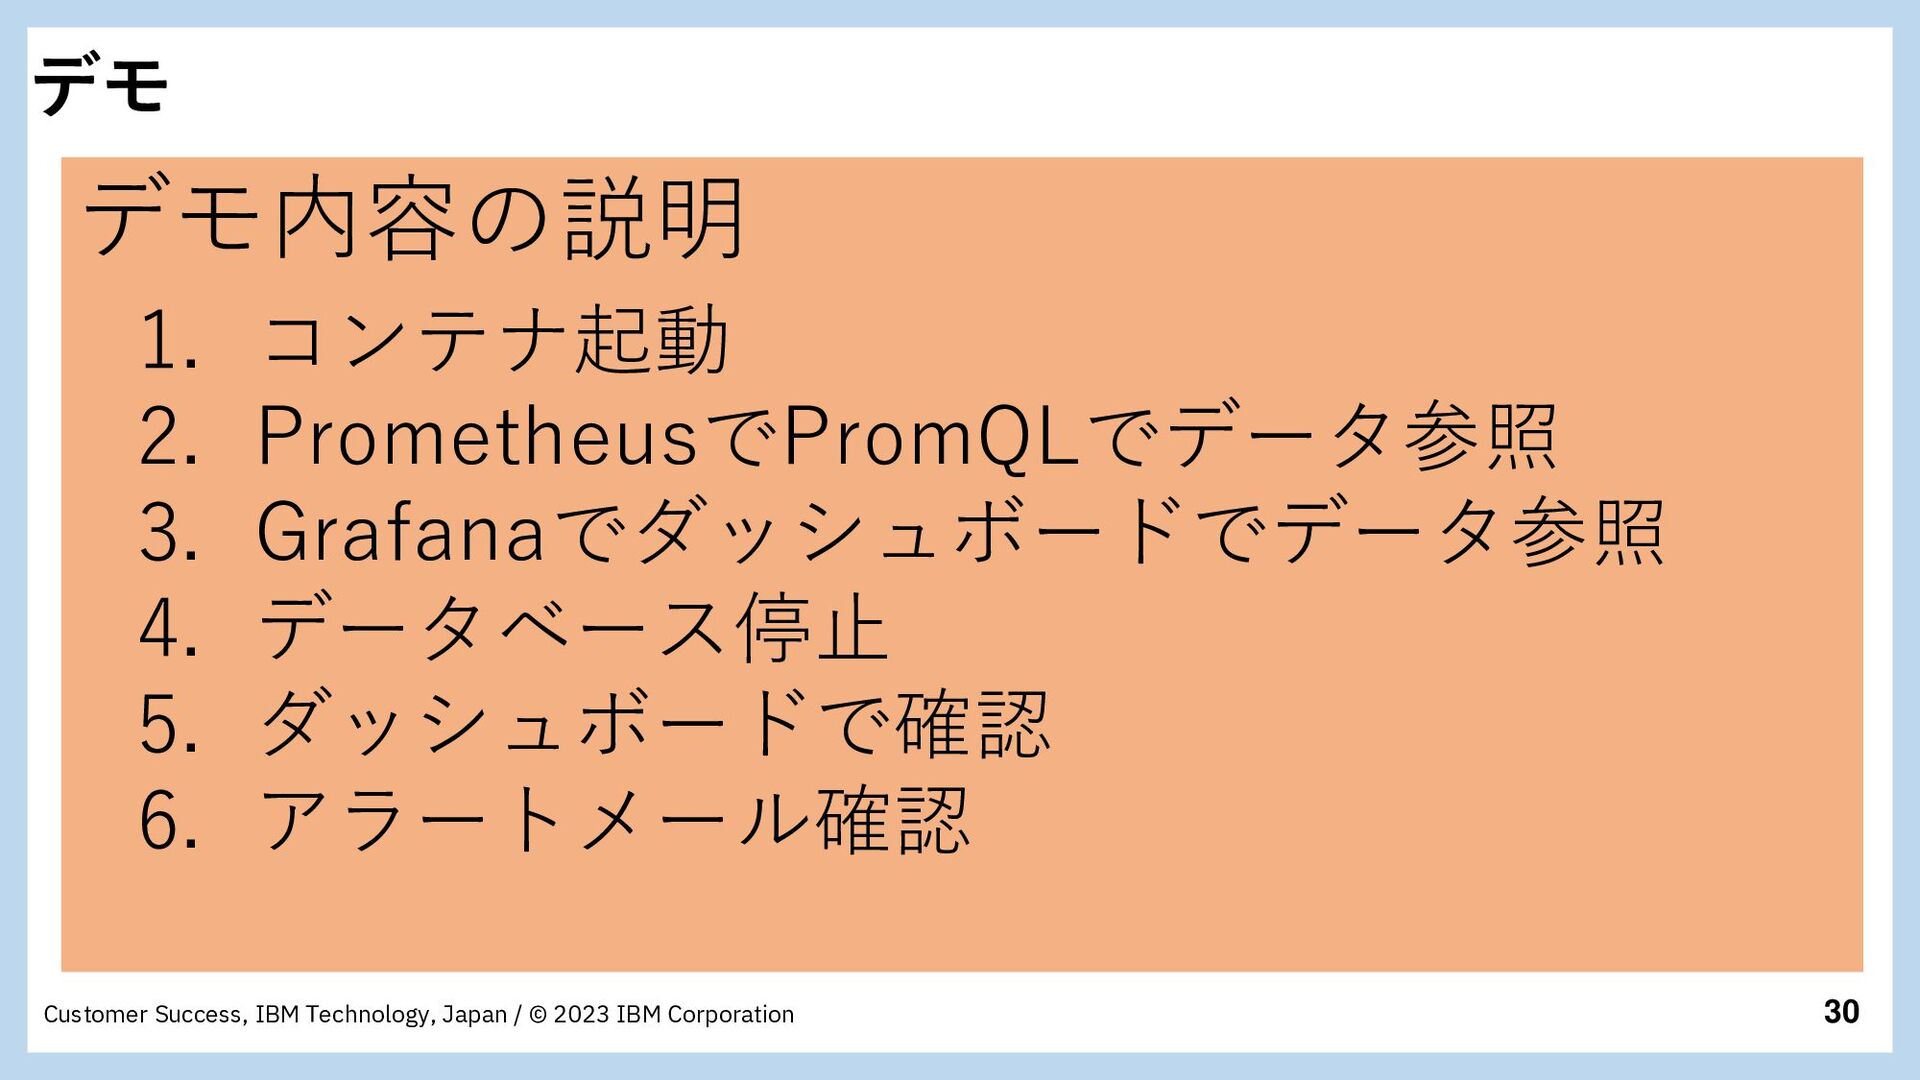
Corporation デモ デモ内容の説明 1. コンテナ起動 2. PrometheusでPromQLでデータ参照 3. Grafanaでダッシュボードでデータ参照 4. データベース停止 5. ダッシュボードで確認 6. アラートメール確認
31 Customer Success, IBM Technology, Japan / © 2023 IBM
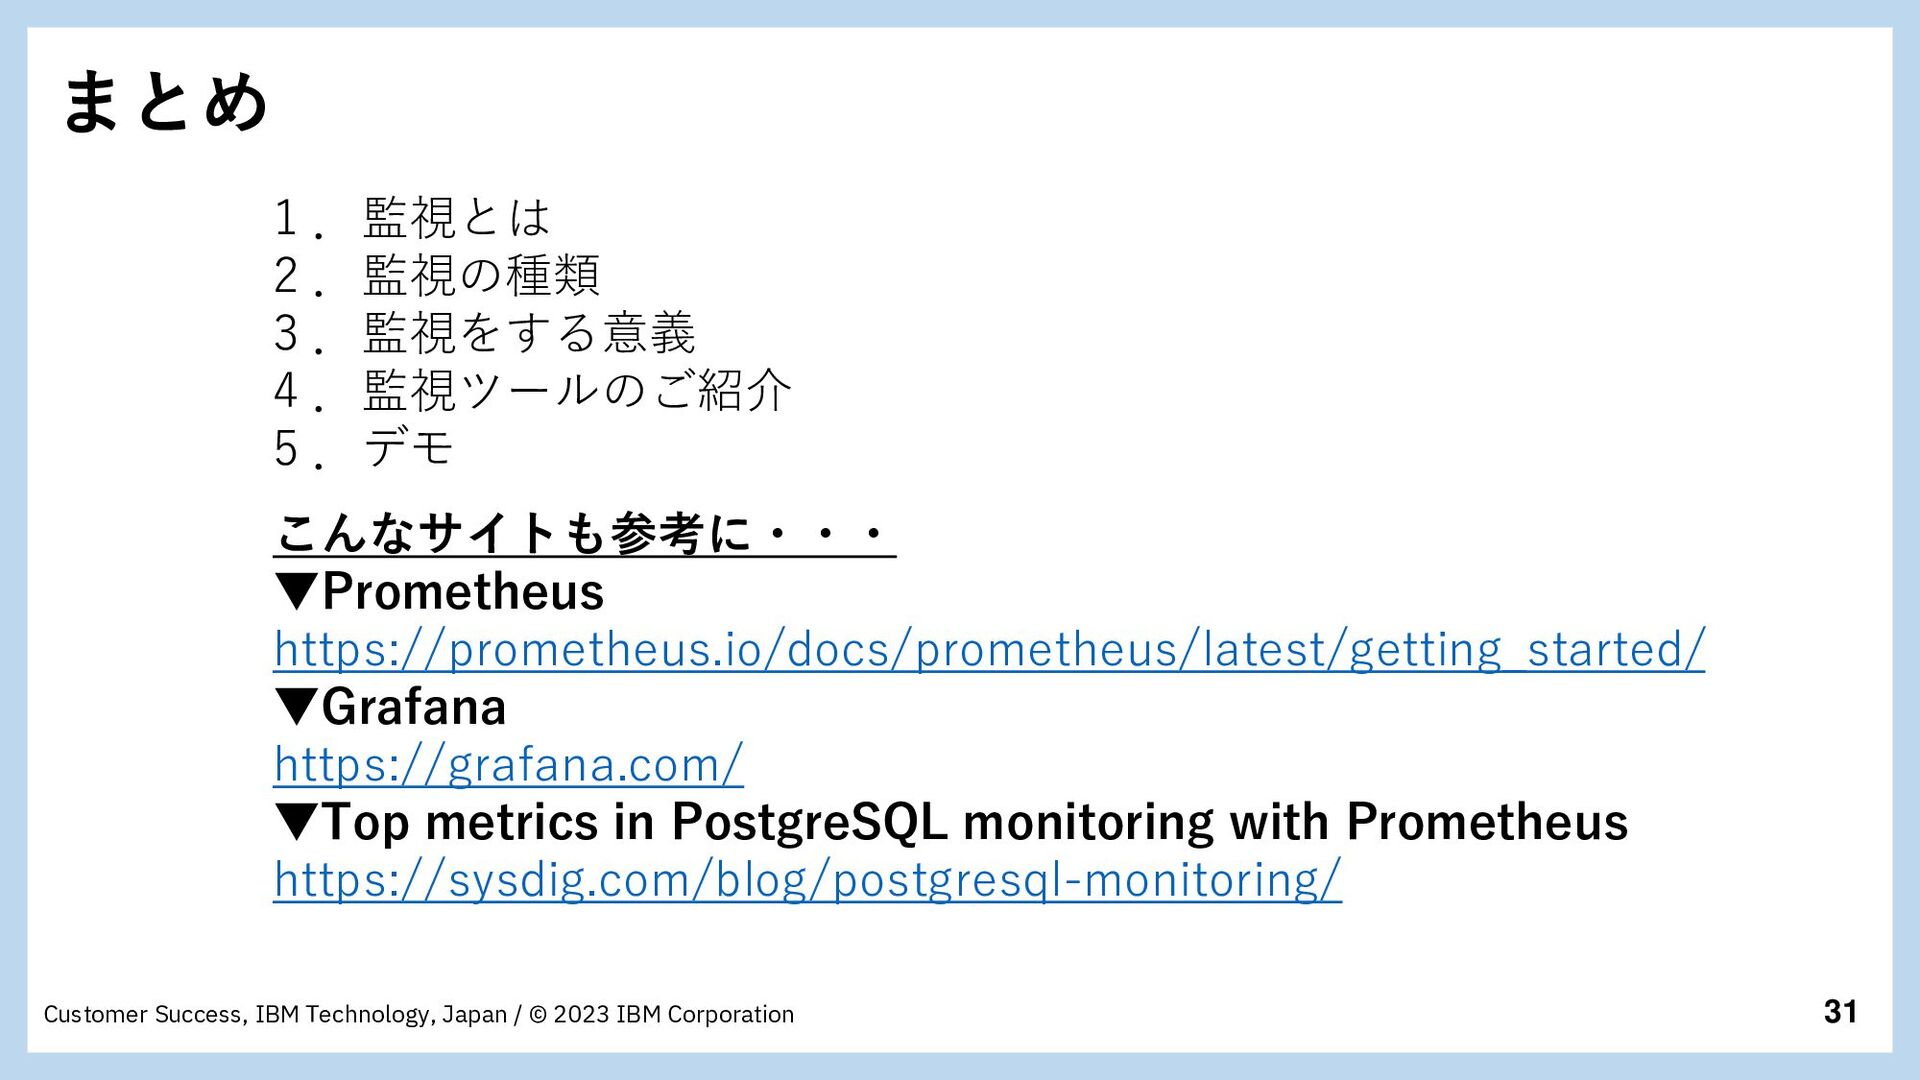
Corporation まとめ 1 .監視とは 2 .監視の種類 3 .監視をする意義 4 .監視ツールのご紹介 5 .デモ こんなサイトも参考に・・・ ▼Prometheus https://prometheus.io/docs/prometheus/latest/getting_started/ ▼Grafana https://grafana.com/ ▼Top metrics in PostgreSQL monitoring with Prometheus https://sysdig.com/blog/postgresql-monitoring/
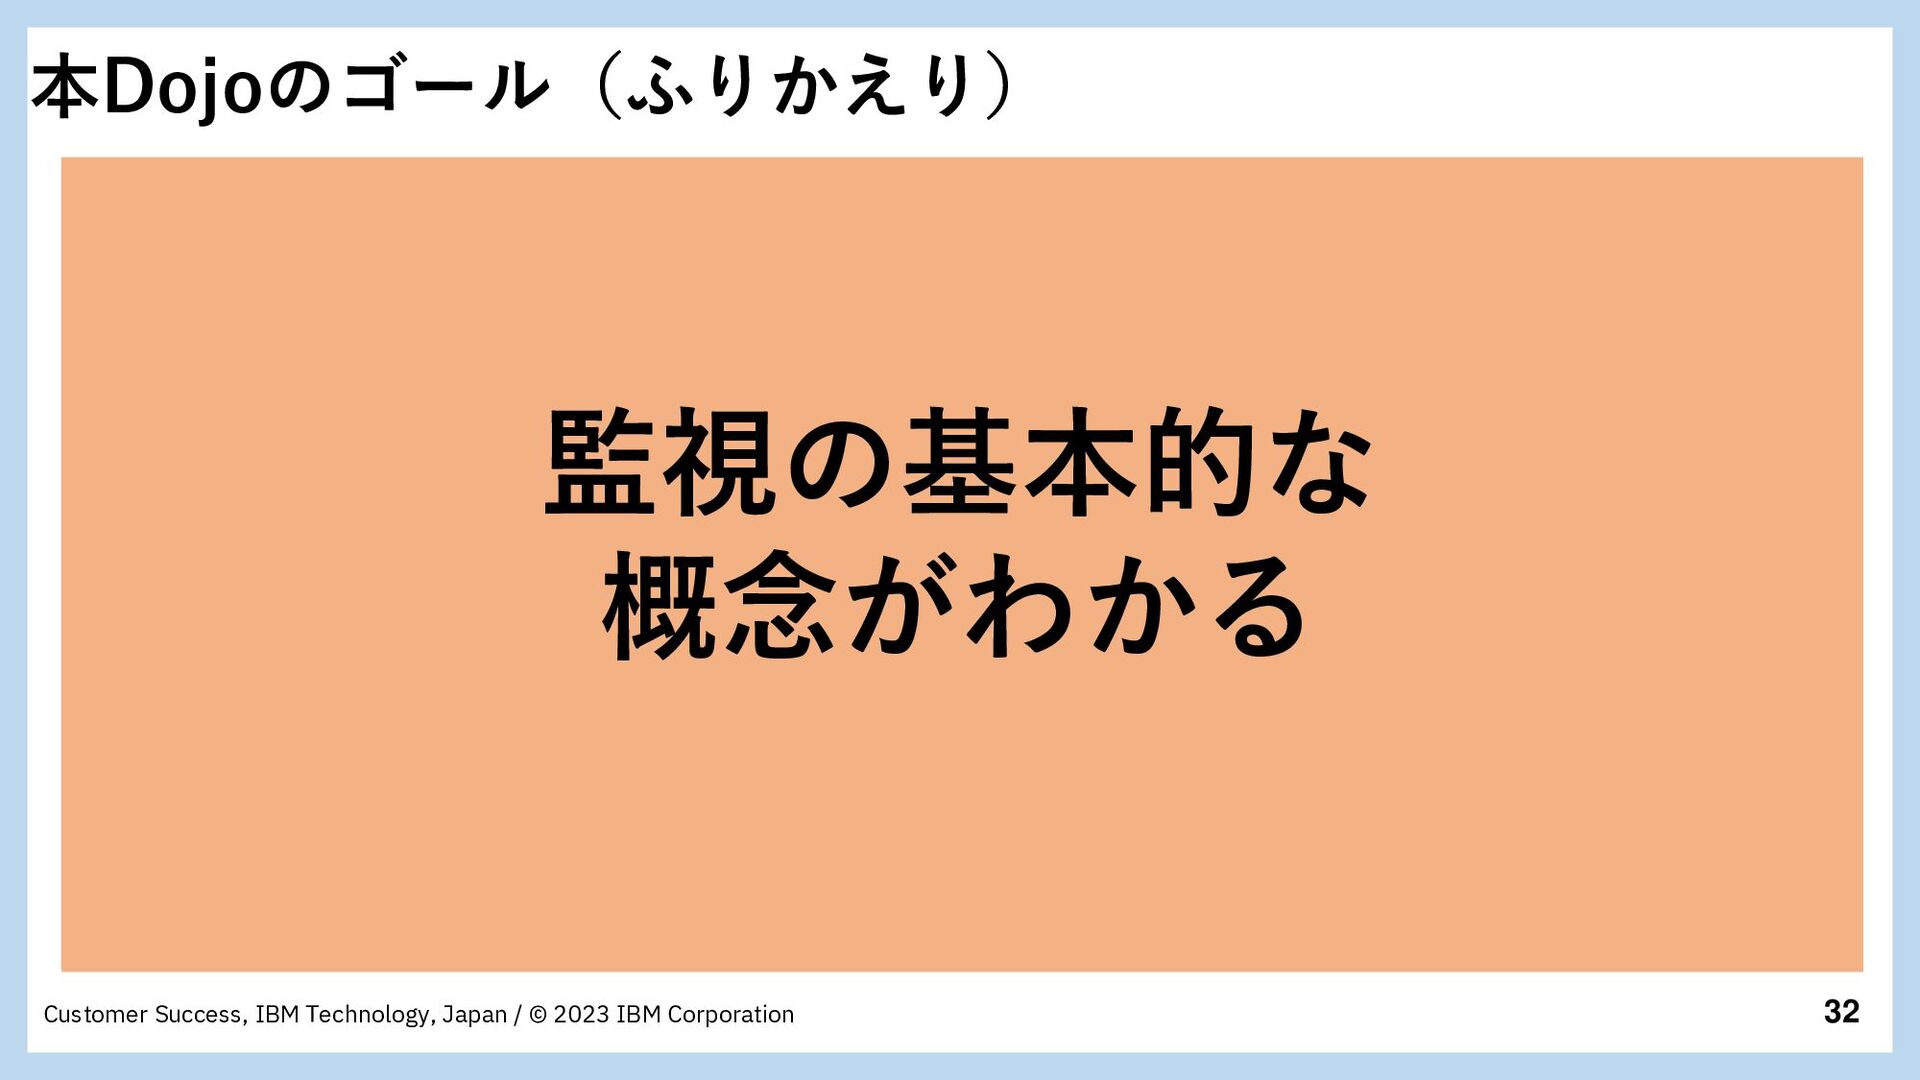
32 Customer Success, IBM Technology, Japan / © 2023 IBM
Corporation 監視の基本的な 概念がわかる 本Dojoのゴール(ふりかえり)
33 Customer Success, IBM Technology, Japan / © 2023 IBM
Corporation イベントのご案内
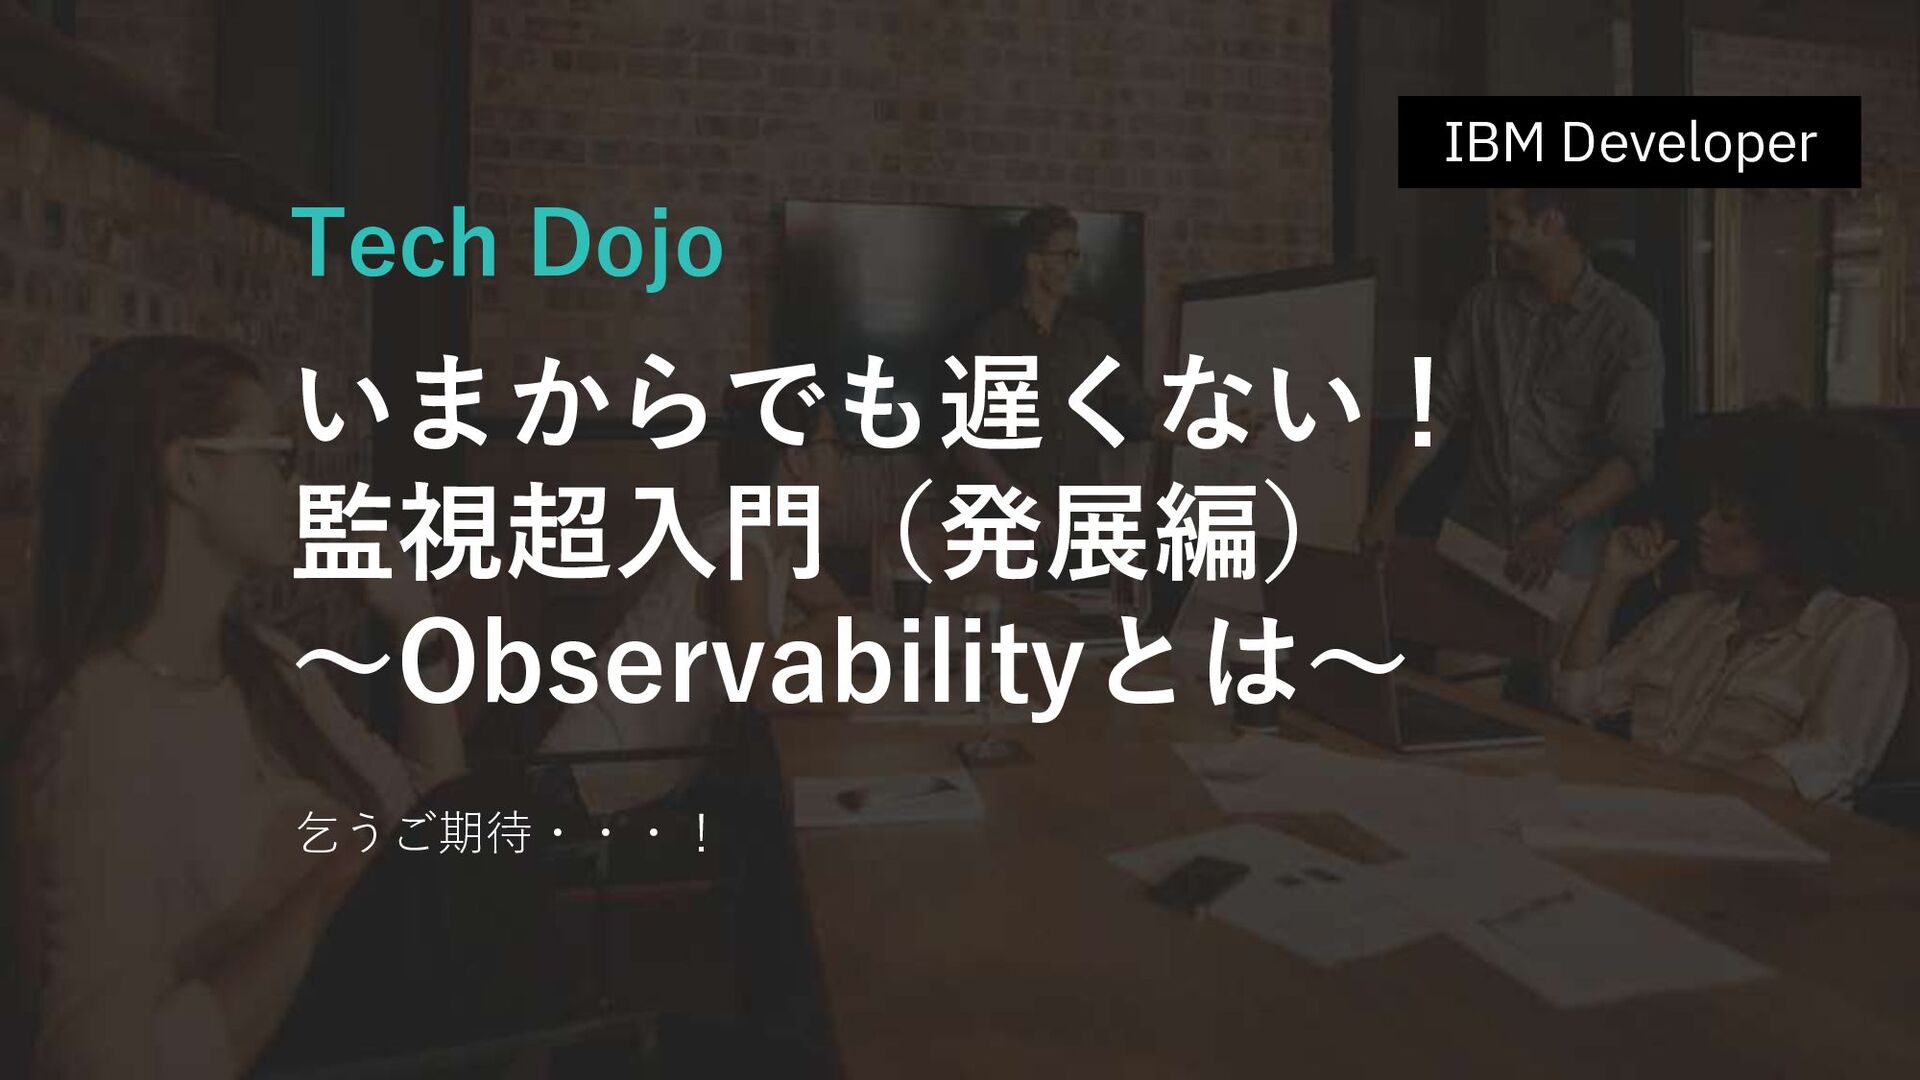
34 Customer Success, IBM Technology, Japan / © 2023 IBM
Corporation イベントのご案内1 Tech Dojo いまからでも遅くない! 監視超入門(発展編) ~Observabilityとは~ 乞うご期待・・・! IBM Developer
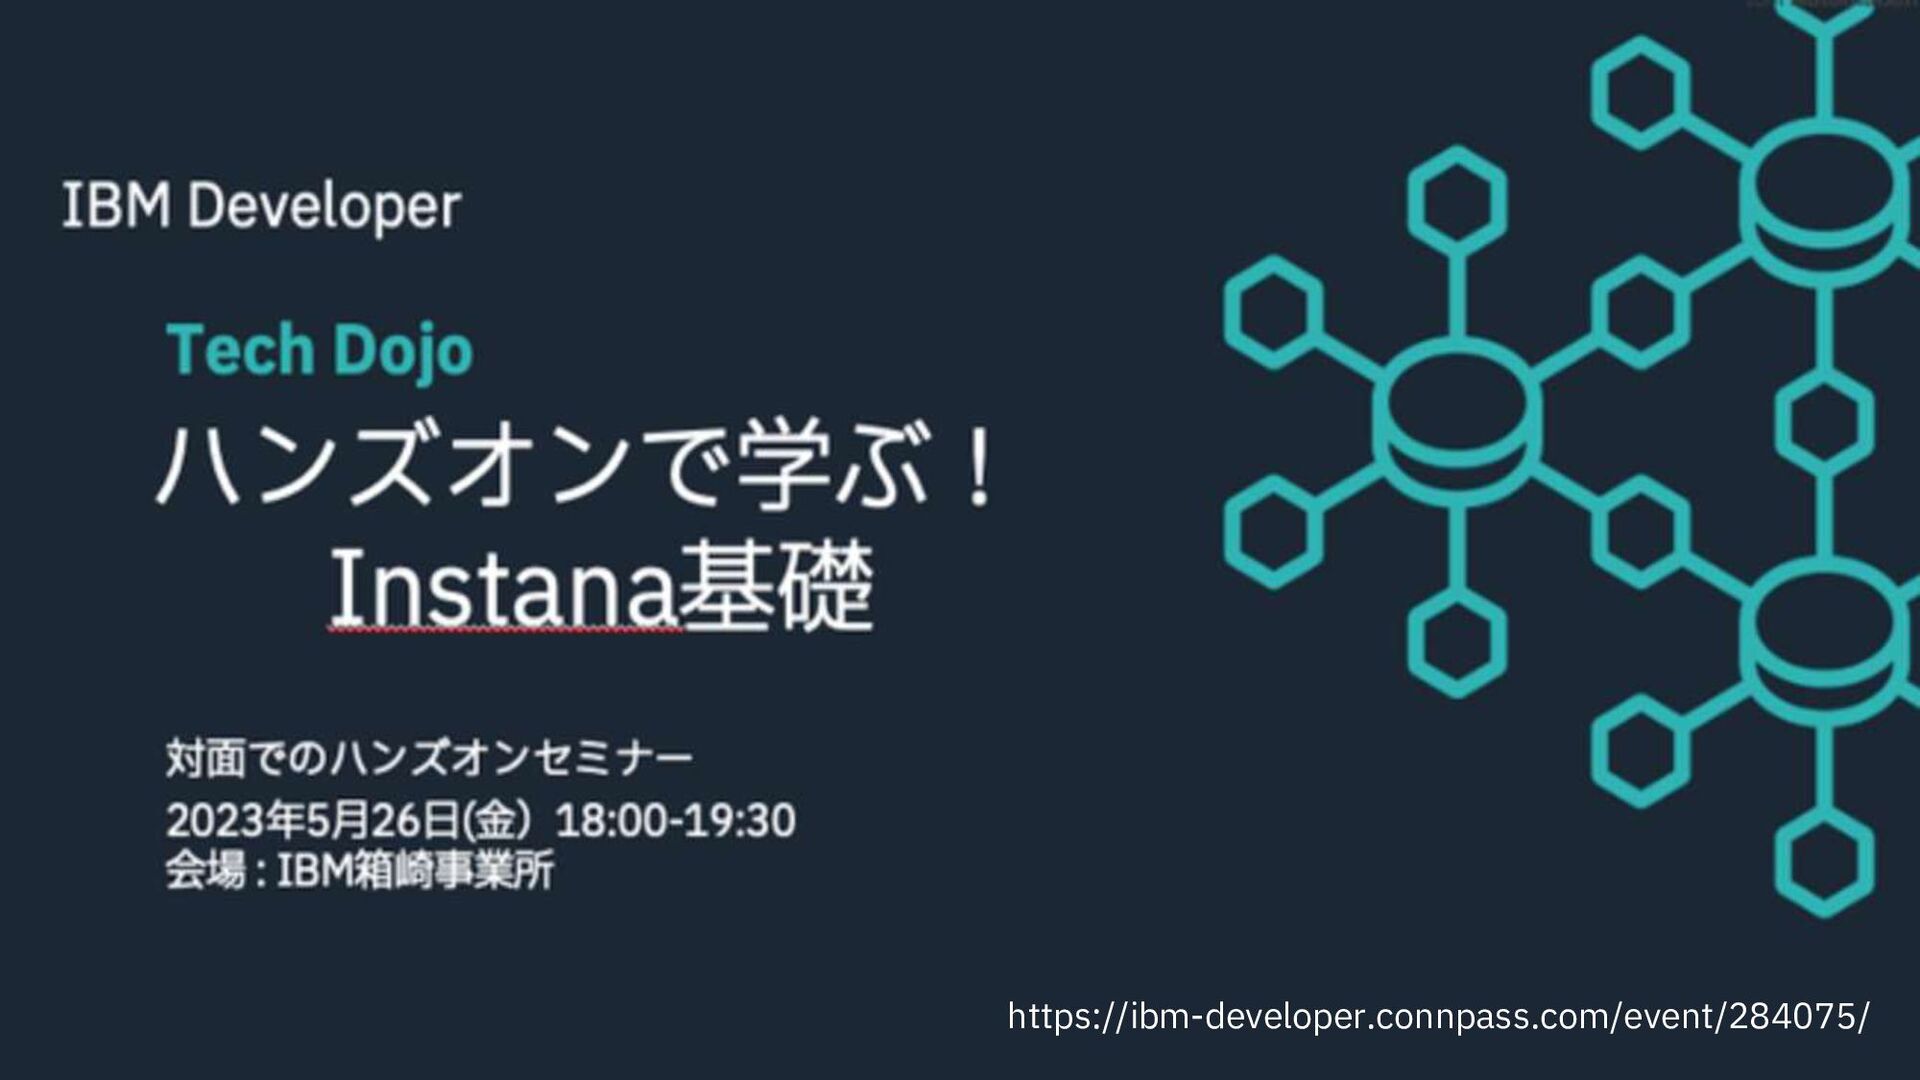
35 Customer Success, IBM Technology, Japan / © 2023 IBM
Corporation https://ibm-developer.connpass.com/event/284075/
36 Customer Success, IBM Technology, Japan / © 2023 IBM
Corporation いろいろTry&Errorしながら 試してみてください。 ありがとうございました
37 Customer Success, IBM Technology, Japan / © 2023 IBM
Corporation
38 Customer Success, IBM Technology, Japan / © 2023 IBM
Corporation QA タイム