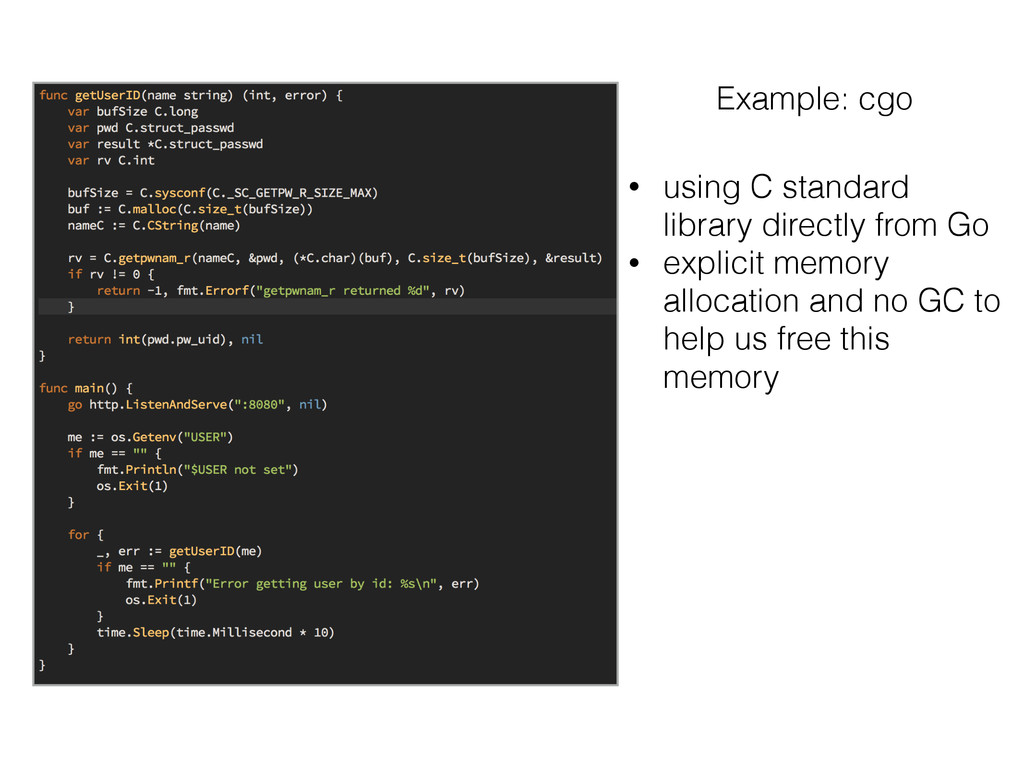
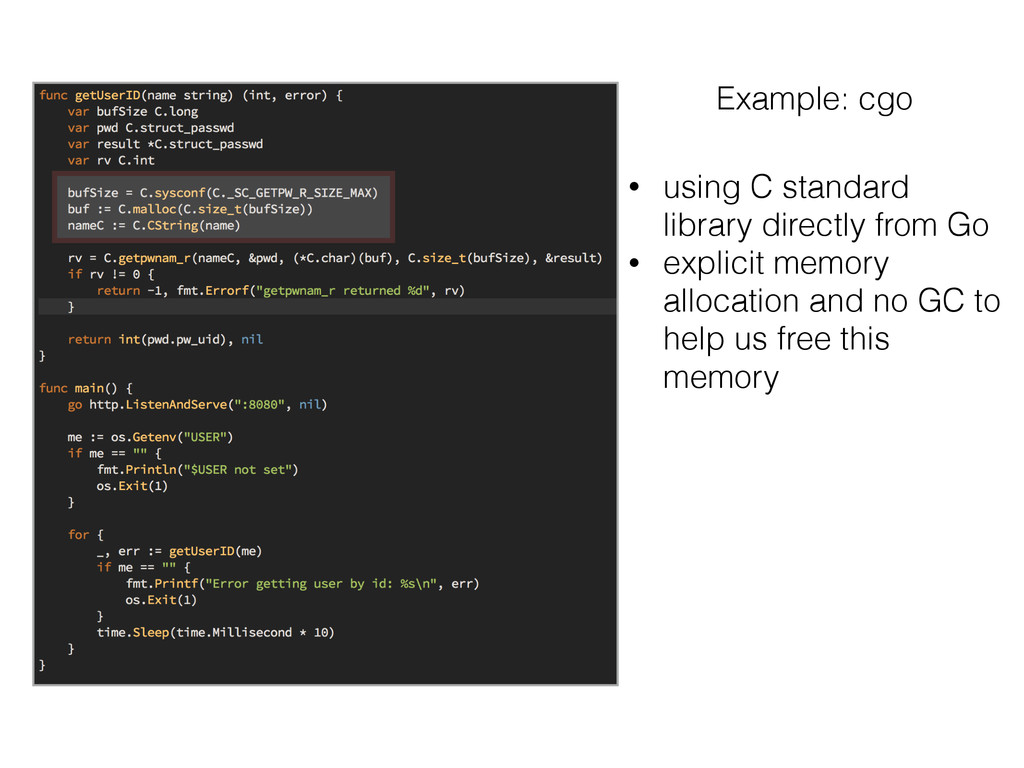
for resource management (defers) • Still prone to memory leaks (just like Java, Ruby, or pretty much any language out there) • Anything that’s still reachable by Go program won’t be GC’ed • Defers can be mis-used, acquired resources might not be released properly • Possible to use C with cgo, need to be careful when allocating memory from C-land
but some things are not obvious and/or hard to track. • Measuring and understanding memory consumption is important. • pprof: sampling profiler, comes with standard library, easy to use, helps a lot. • When leaks are detected, it’s usually a process running in some real environment, need to be careful not to break it, limited control over execution.
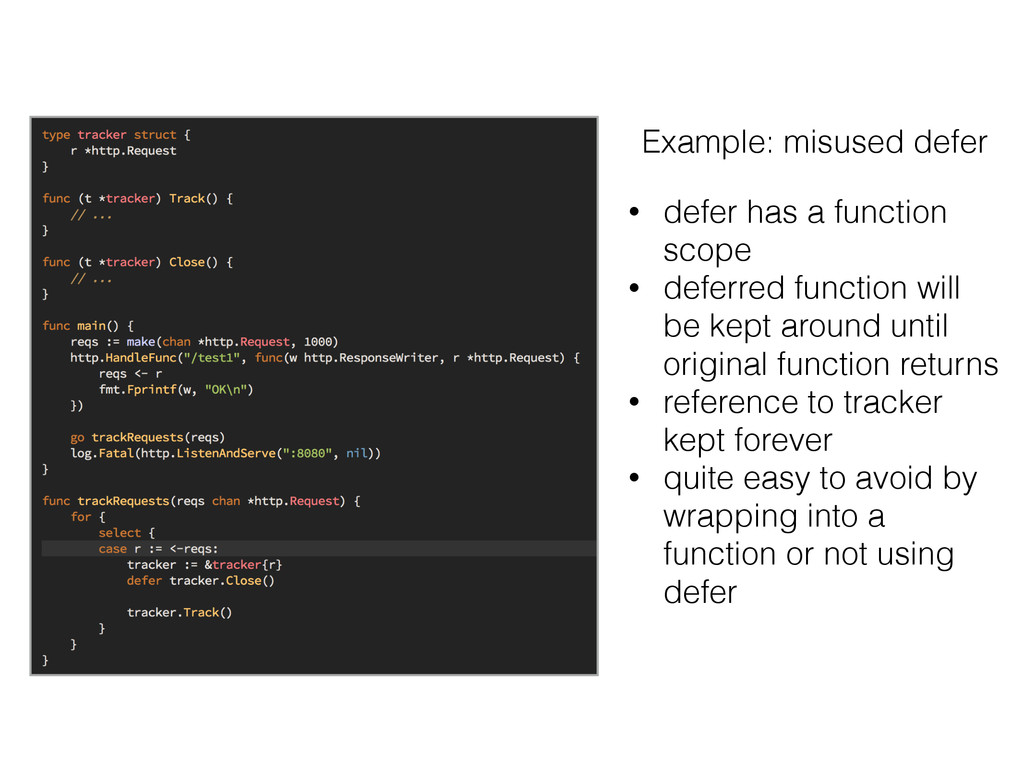
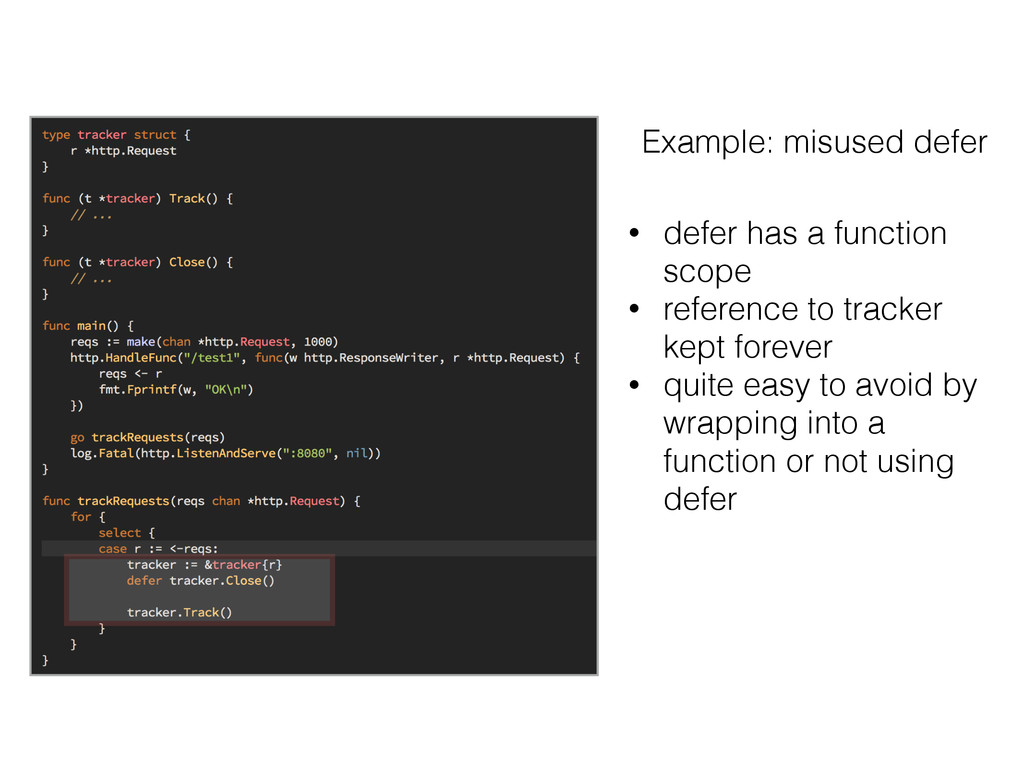
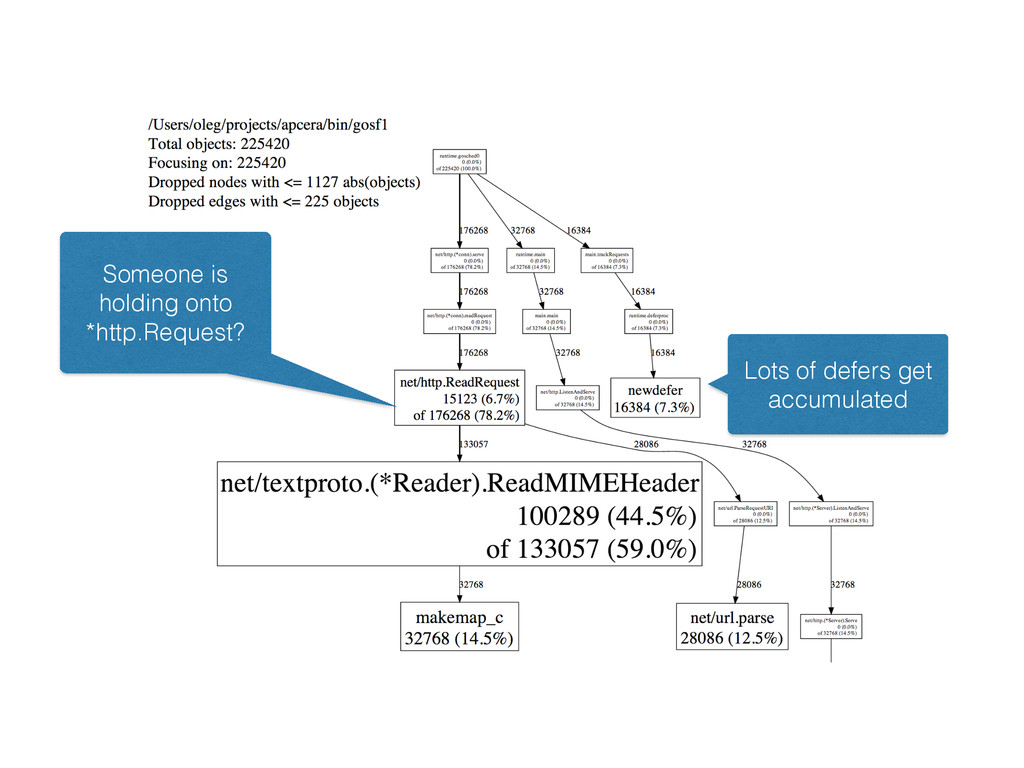
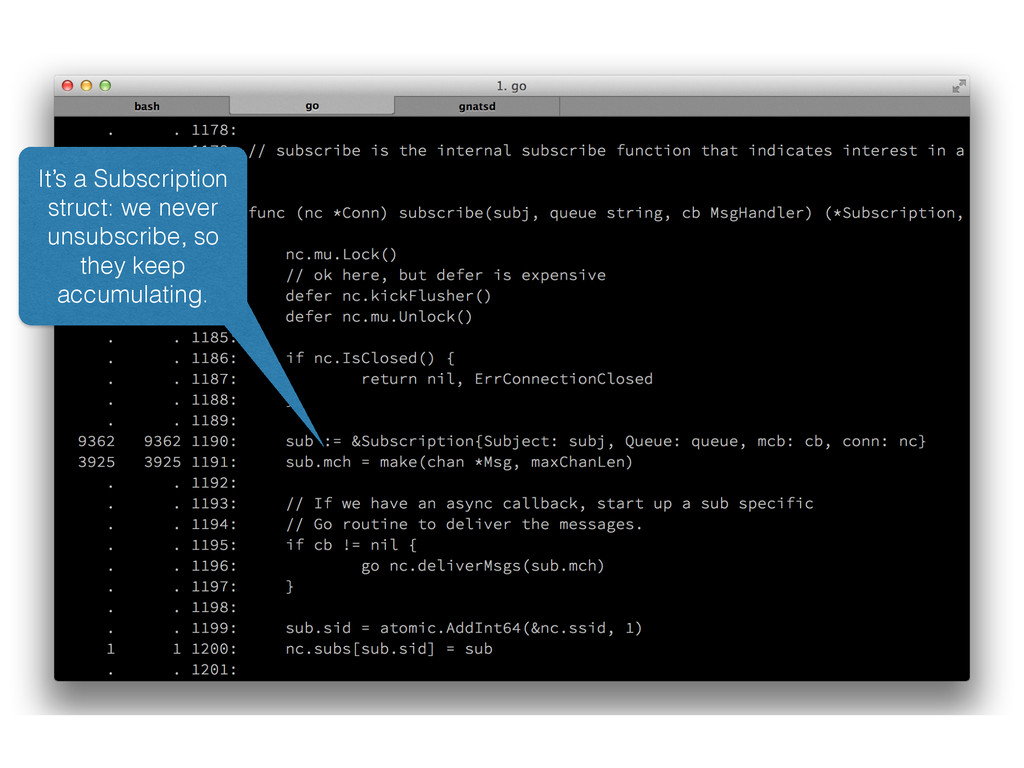
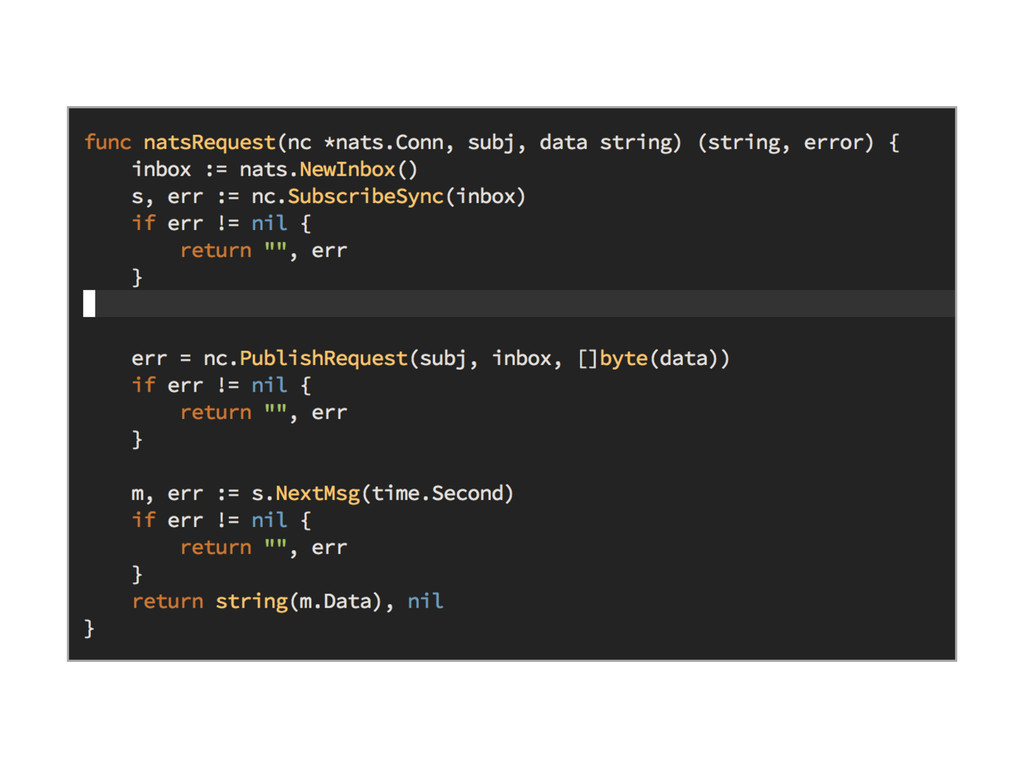
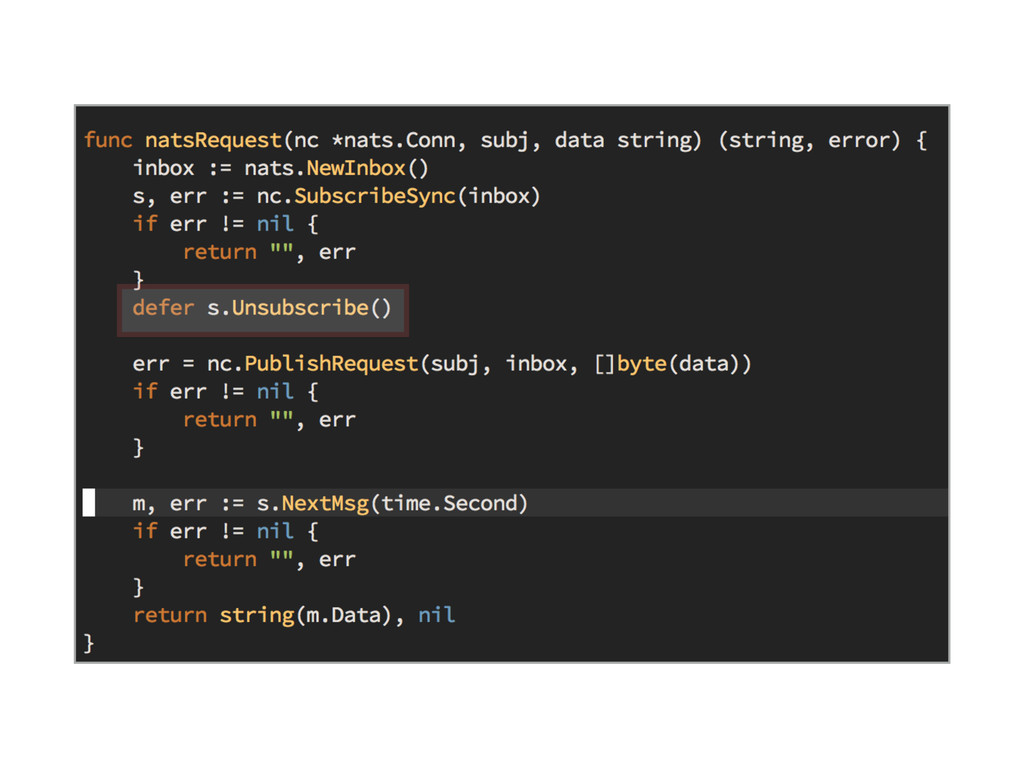
deferred function will be kept around until original function returns • reference to tracker kept forever • quite easy to avoid by wrapping into a function or not using defer
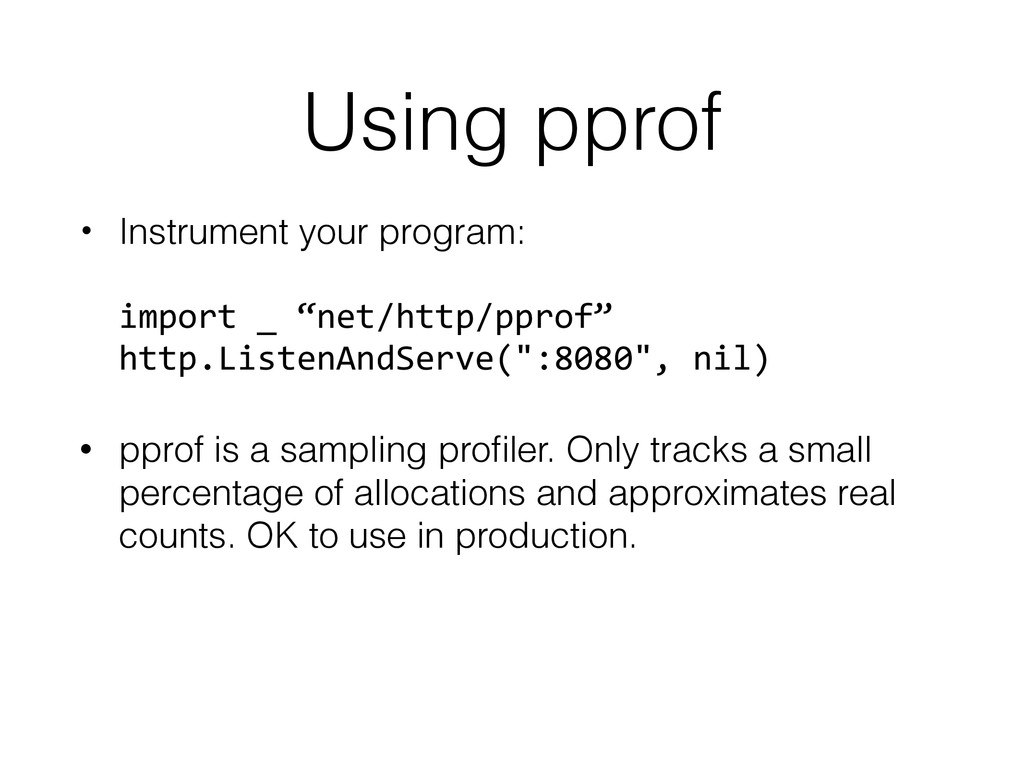
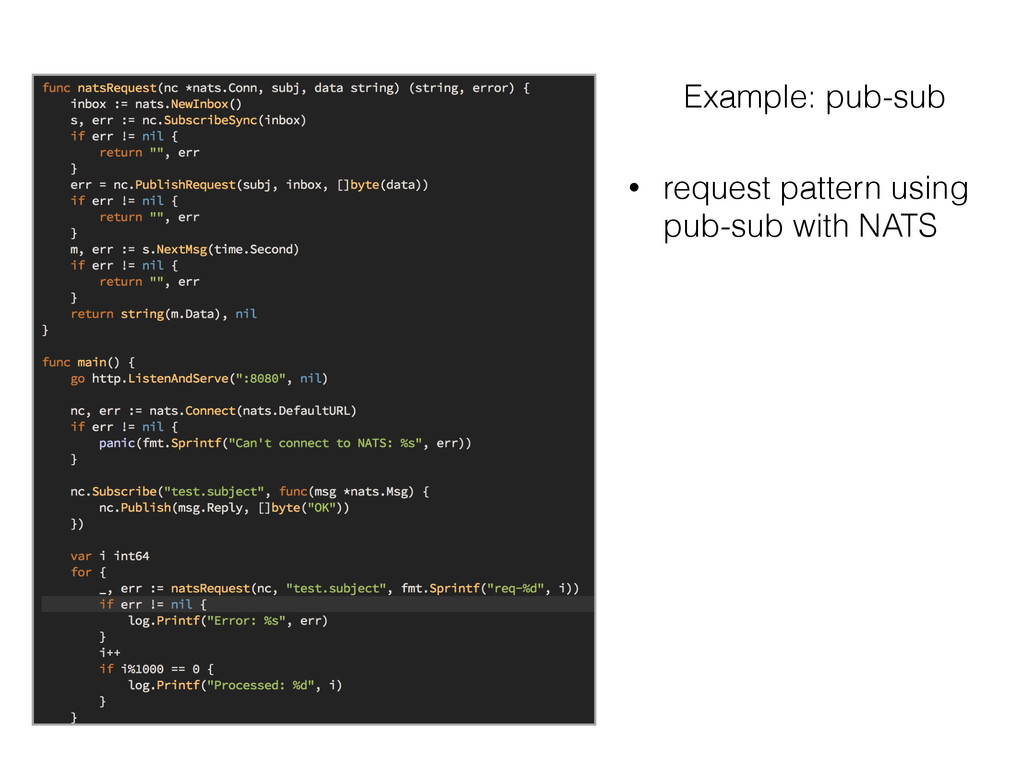
http.ListenAndServe(":8080", nil) • pprof is a sampling profiler. Only tracks a small percentage of allocations and approximates real counts. OK to use in production.
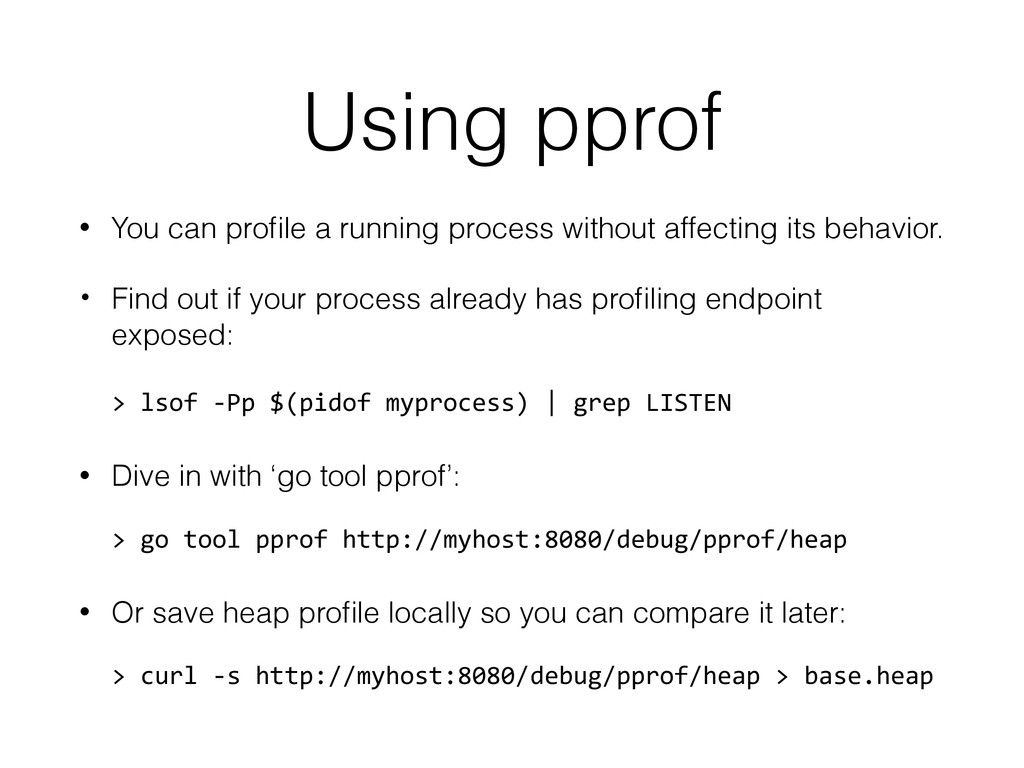
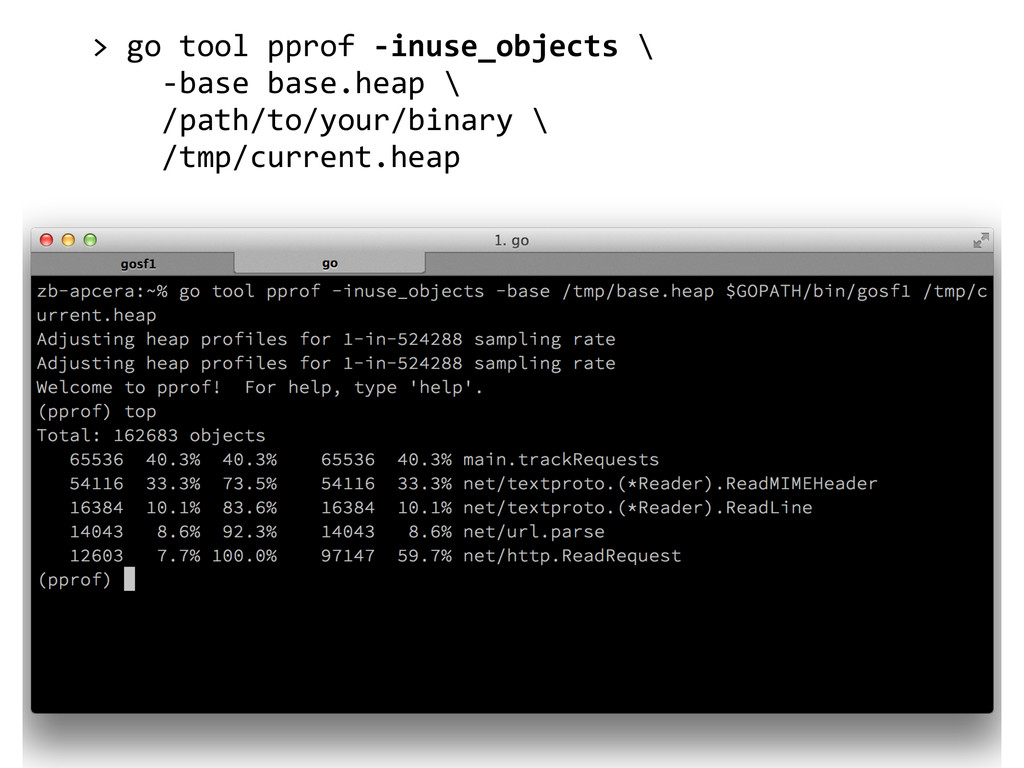
affecting its behavior. • Find out if your process already has profiling endpoint exposed: > lsof -‐Pp $(pidof myprocess) | grep LISTEN • Dive in with ‘go tool pprof’: > go tool pprof http://myhost:8080/debug/pprof/heap • Or save heap profile locally so you can compare it later: > curl -‐s http://myhost:8080/debug/pprof/heap > base.heap
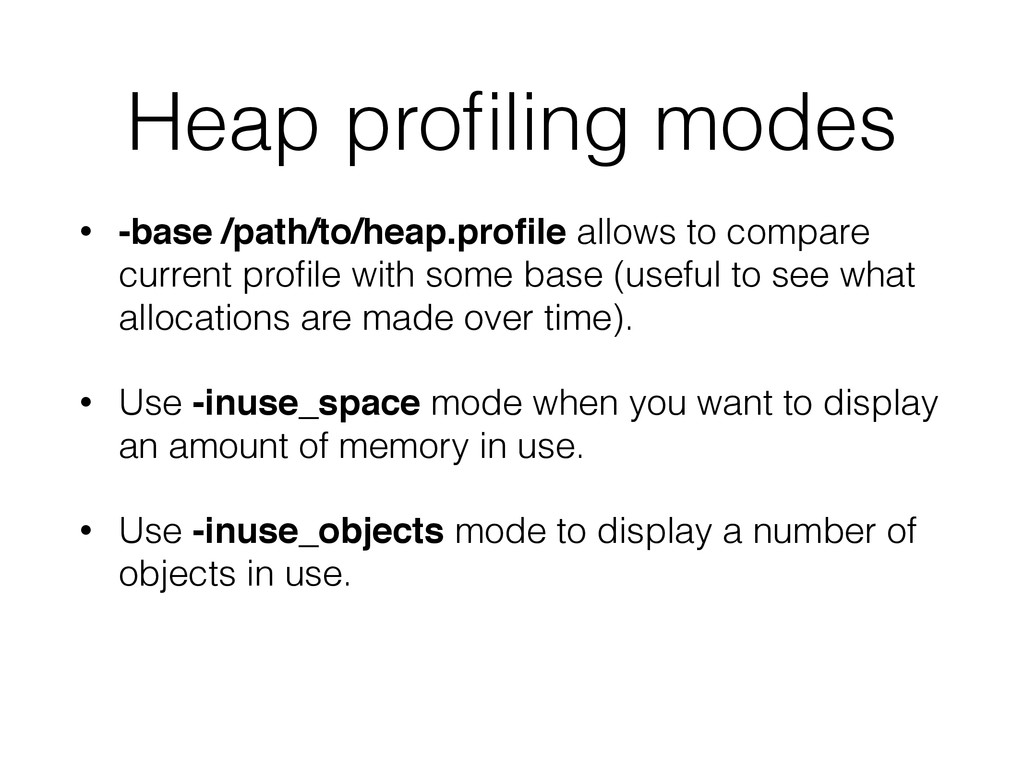
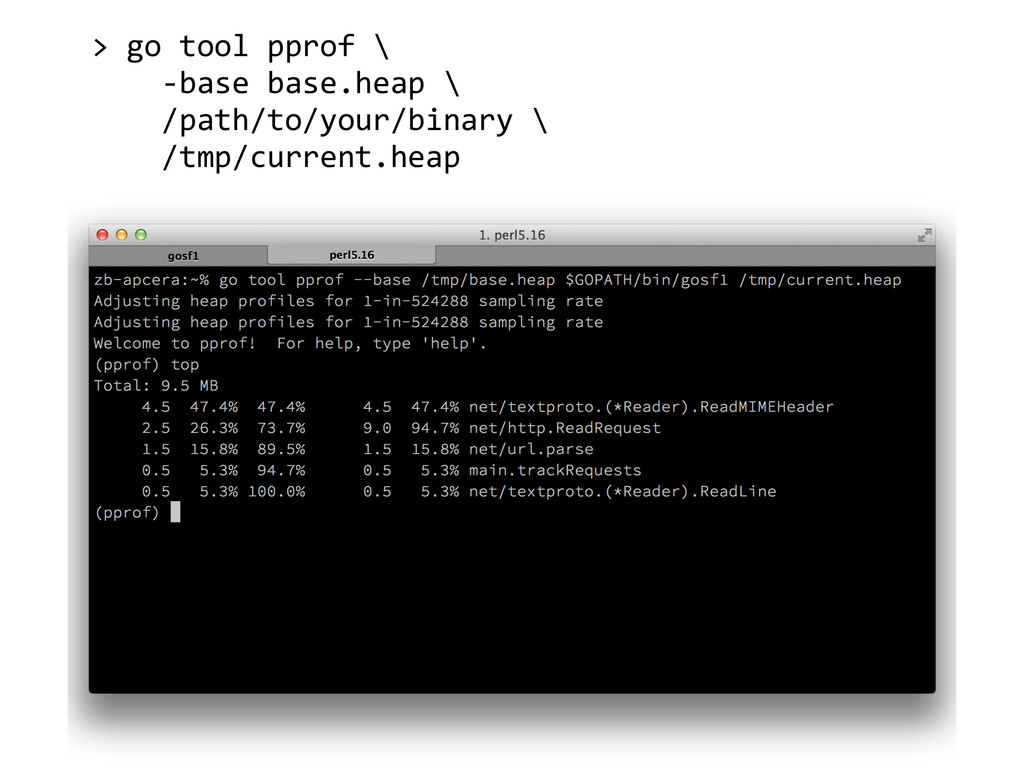
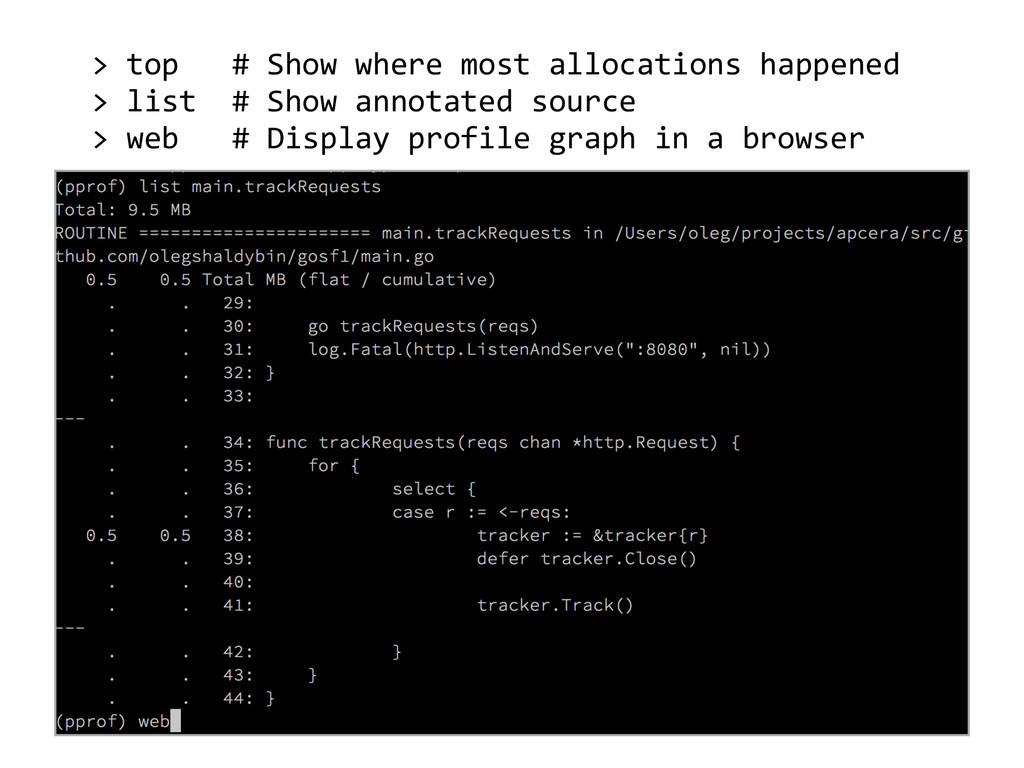
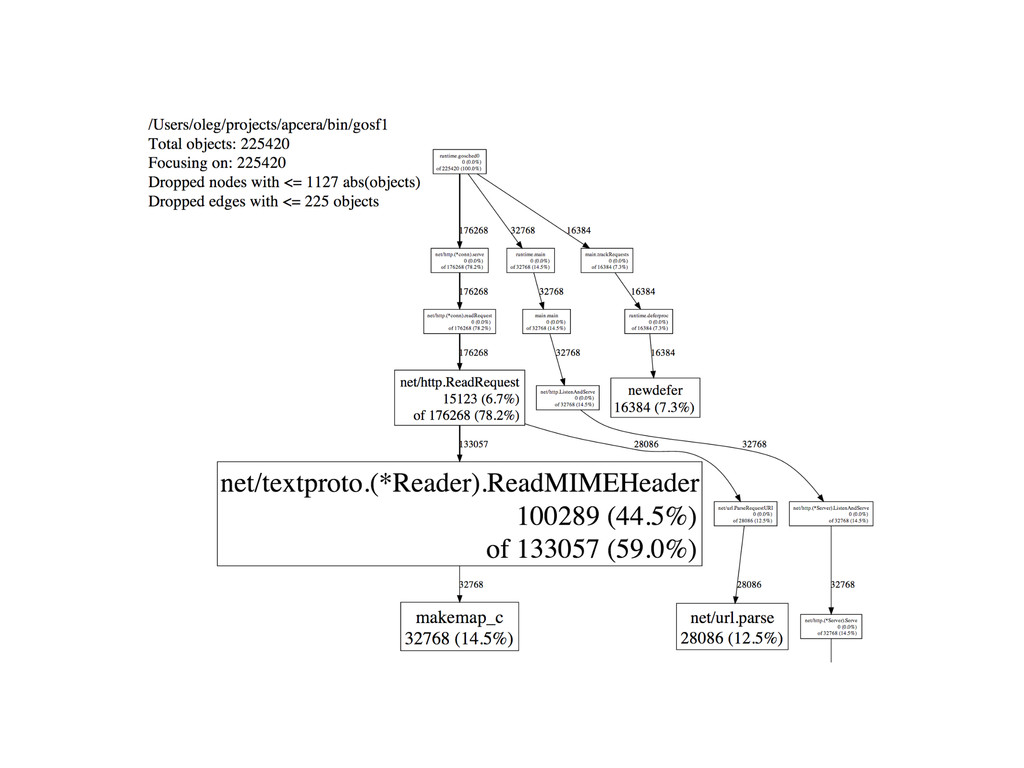
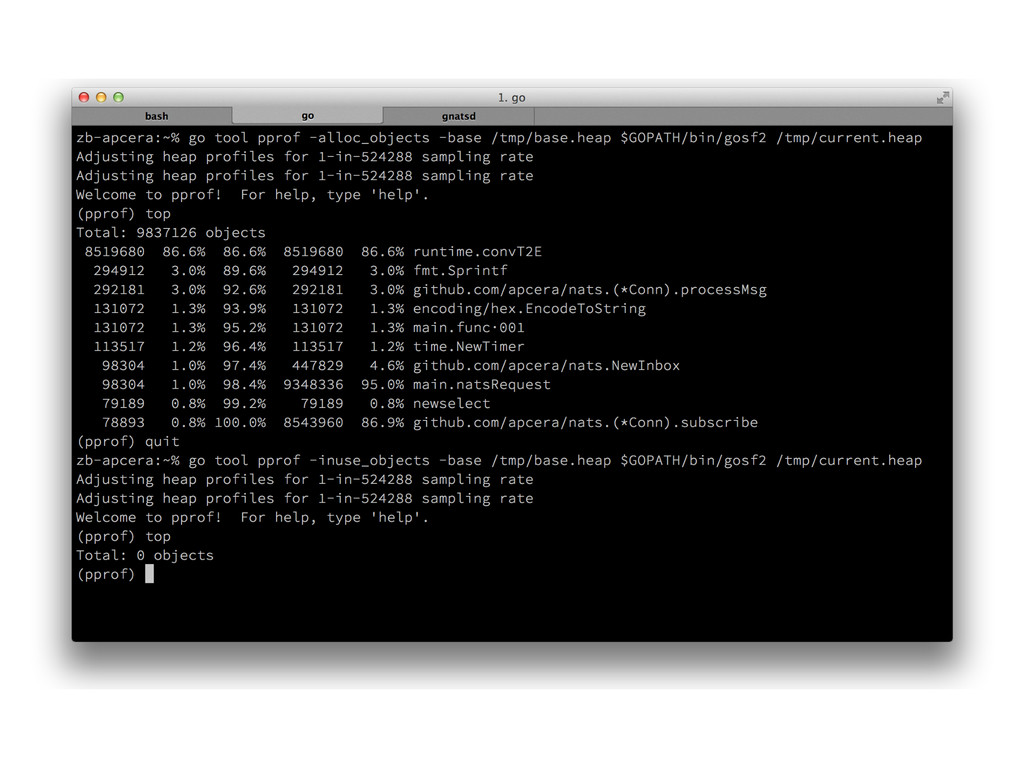
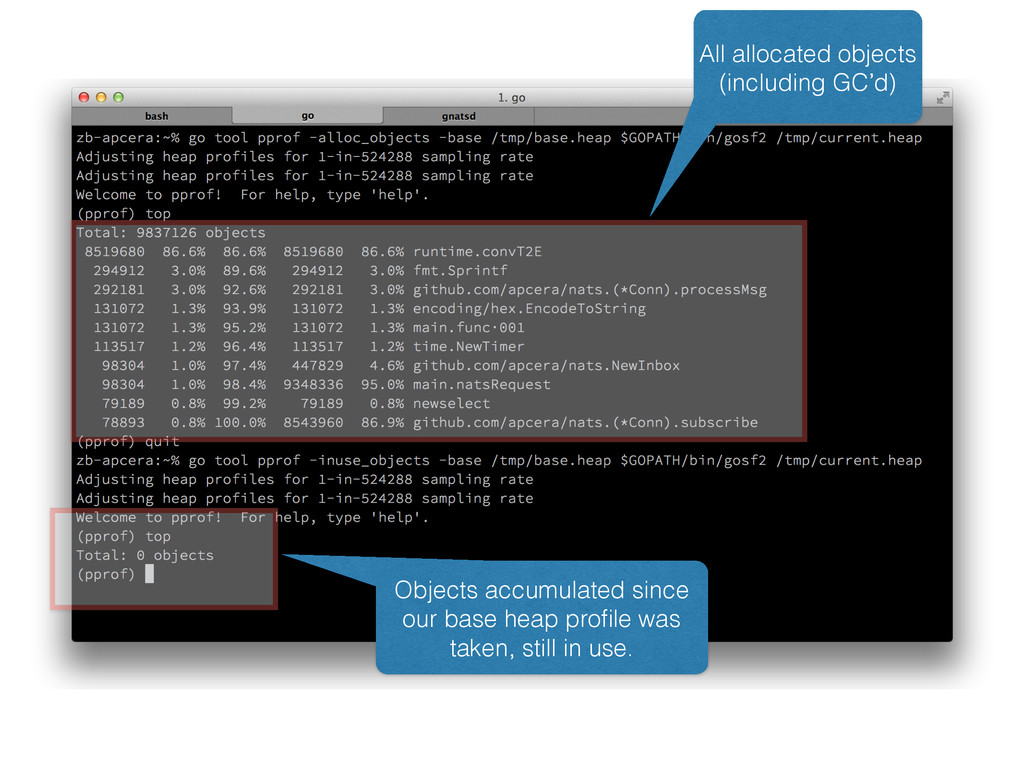
profile with some base (useful to see what allocations are made over time). • Use -inuse_space mode when you want to display an amount of memory in use. • Use -inuse_objects mode to display a number of objects in use.
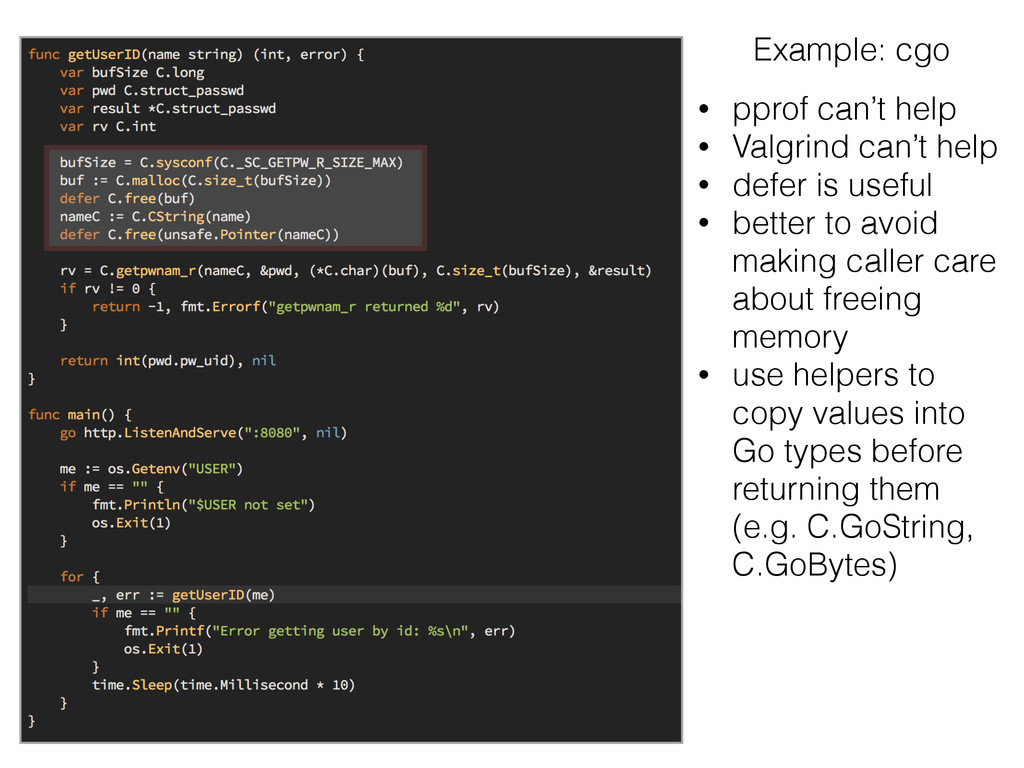
• defer is useful • better to avoid making caller care about freeing memory • use helpers to copy values into Go types before returning them (e.g. C.GoString, C.GoBytes)
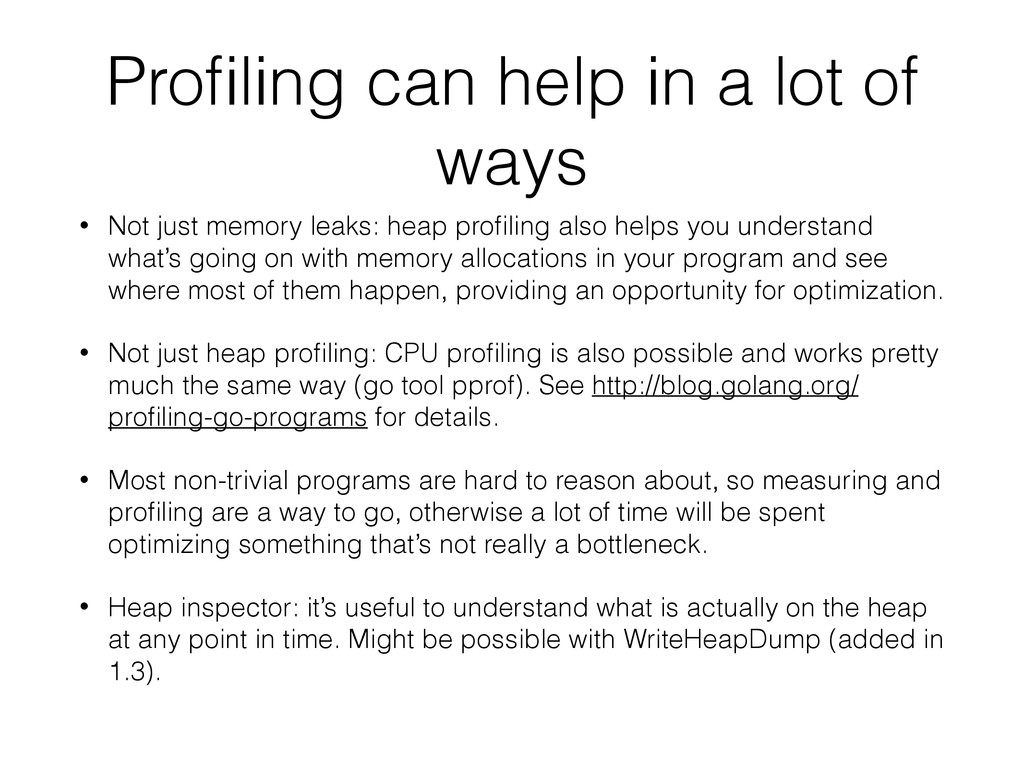
just memory leaks: heap profiling also helps you understand what’s going on with memory allocations in your program and see where most of them happen, providing an opportunity for optimization. • Not just heap profiling: CPU profiling is also possible and works pretty much the same way (go tool pprof). See http://blog.golang.org/ profiling-go-programs for details. • Most non-trivial programs are hard to reason about, so measuring and profiling are a way to go, otherwise a lot of time will be spent optimizing something that’s not really a bottleneck. • Heap inspector: it’s useful to understand what is actually on the heap at any point in time. Might be possible with WriteHeapDump (added in 1.3).
order to avoid hard-to-debug situations in concurrent programs. • A simple set of rules defining “happens-before” and “happens-after” relationship between reads and writes in different goroutines. • Usually not a source of memory leaks: it is possible however that code you’re counting on to run at certain point won’t run because it can’t observe an effect in a different goroutine required to trigger a certain code path. • http://golang.org/ref/mem