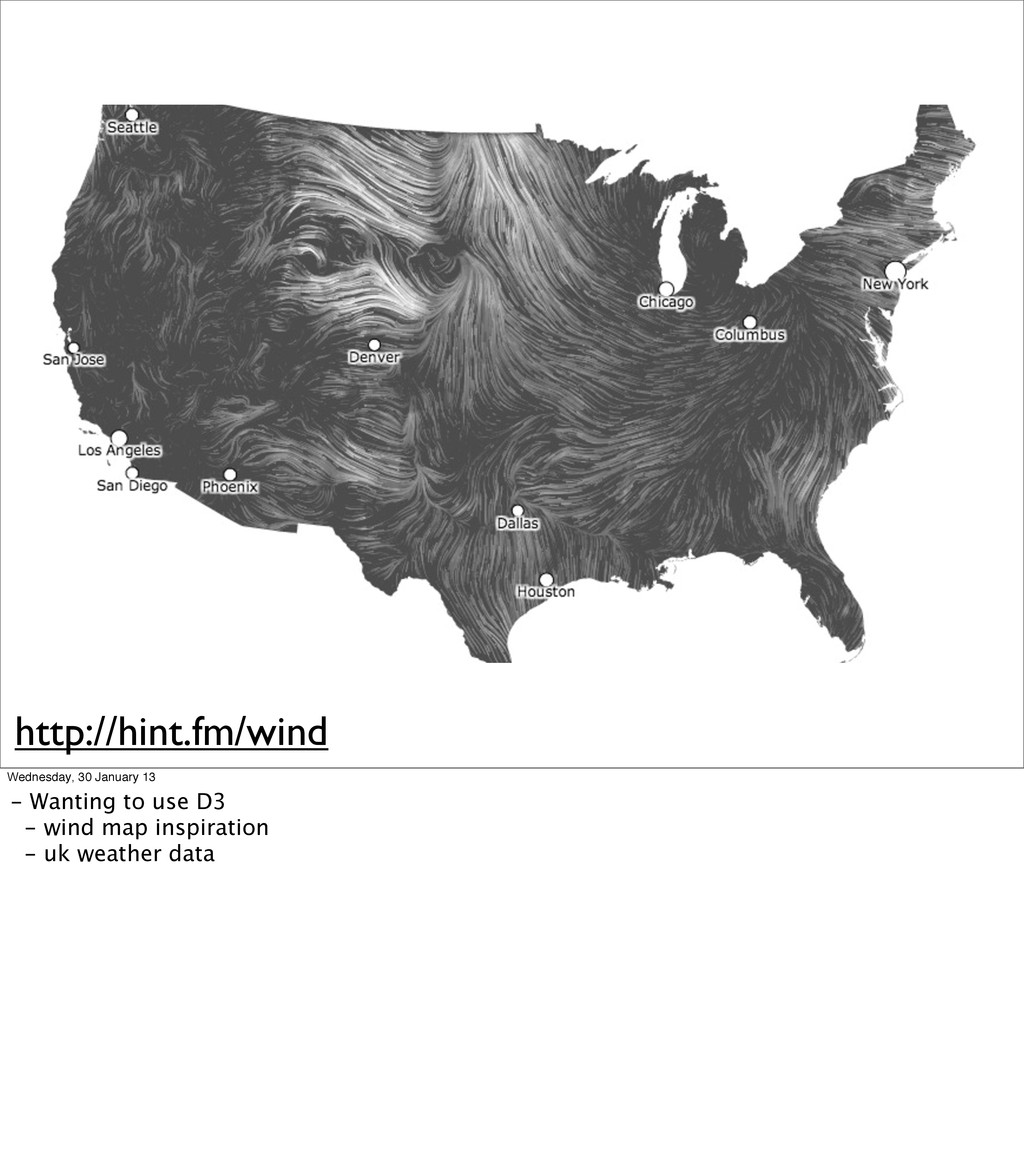
- not invented here syndrome - too long writing boilerplate code to get things working - less time focusing on the visualisation - how to express this data in a simple, interesting way - D3 first contact - examples on gh wiki - cool but hard to customize? - makoto introduction - useful utility functions http://www.flickr.com/photos/nationaalarchief/4193508328/in/photostream/
files - where to get them (Ordnance Survey) - formats (always wrong) - conversion tools - Mike Bostock article - draws map of UK - borrowed the same shape files for uk temp - links at the end
30 January 13 - Projections - displaying points from the globe (spherical) on 2d - made trivially easy by d3 - projection types - albers, mecrator, etc
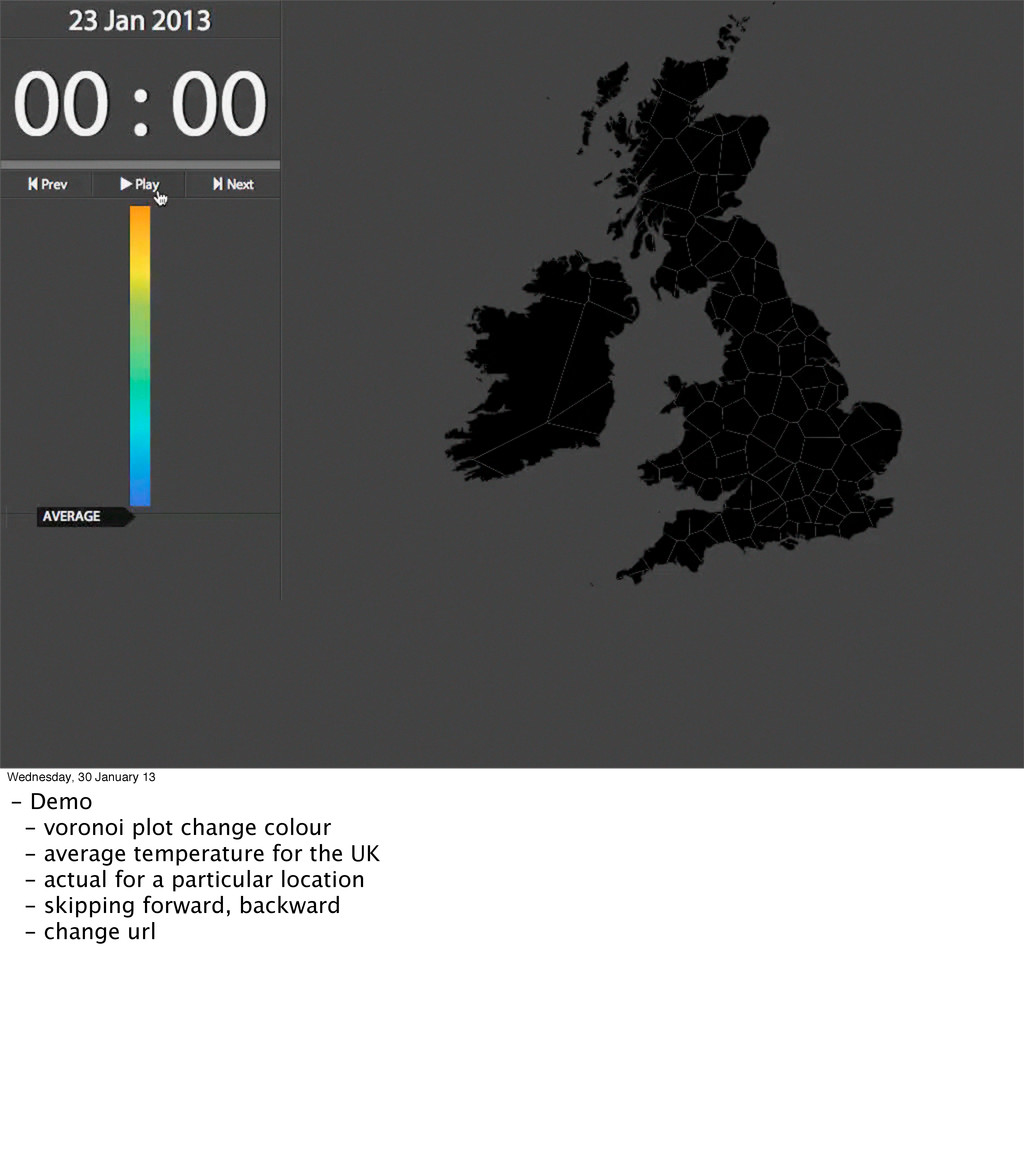
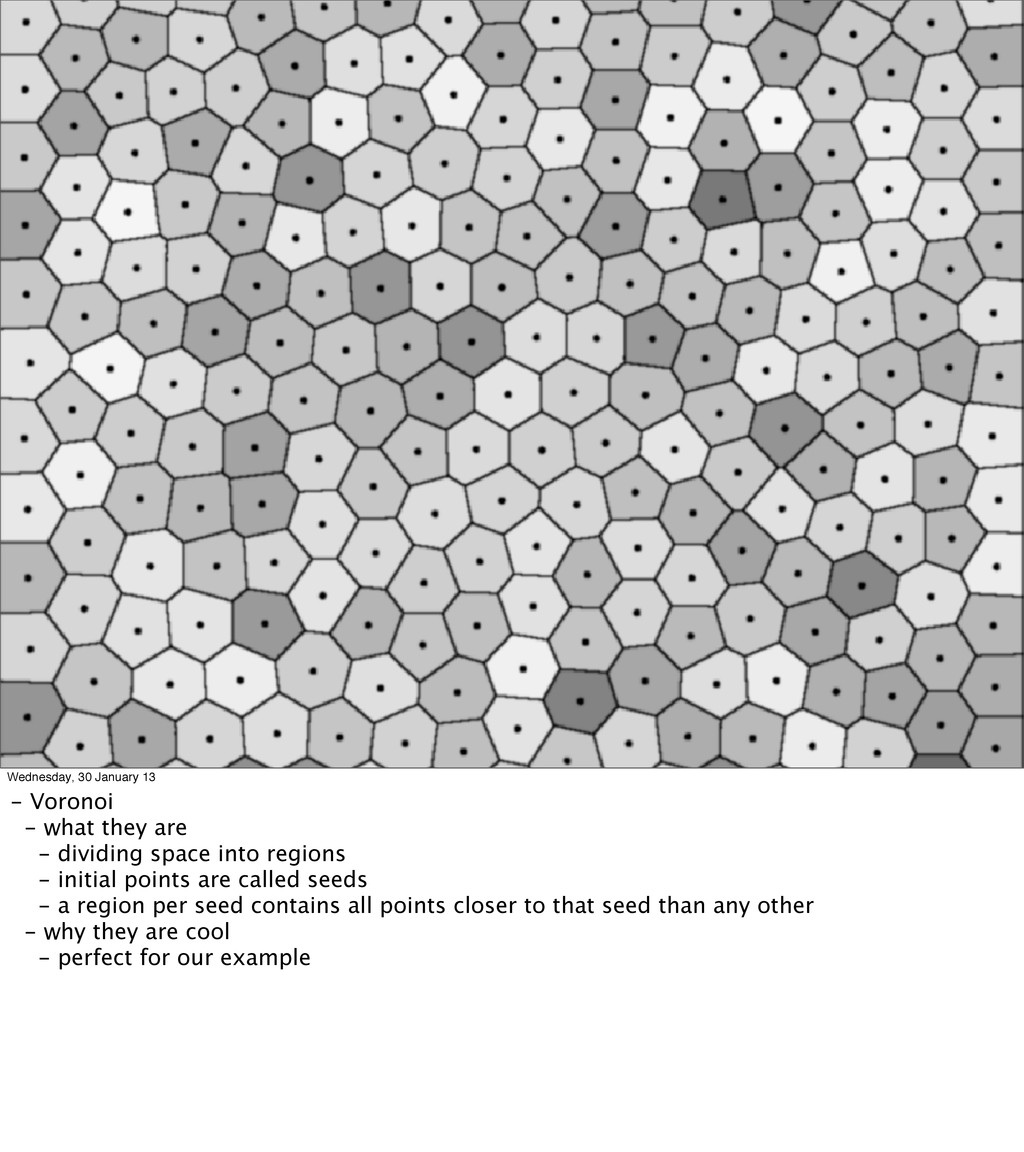
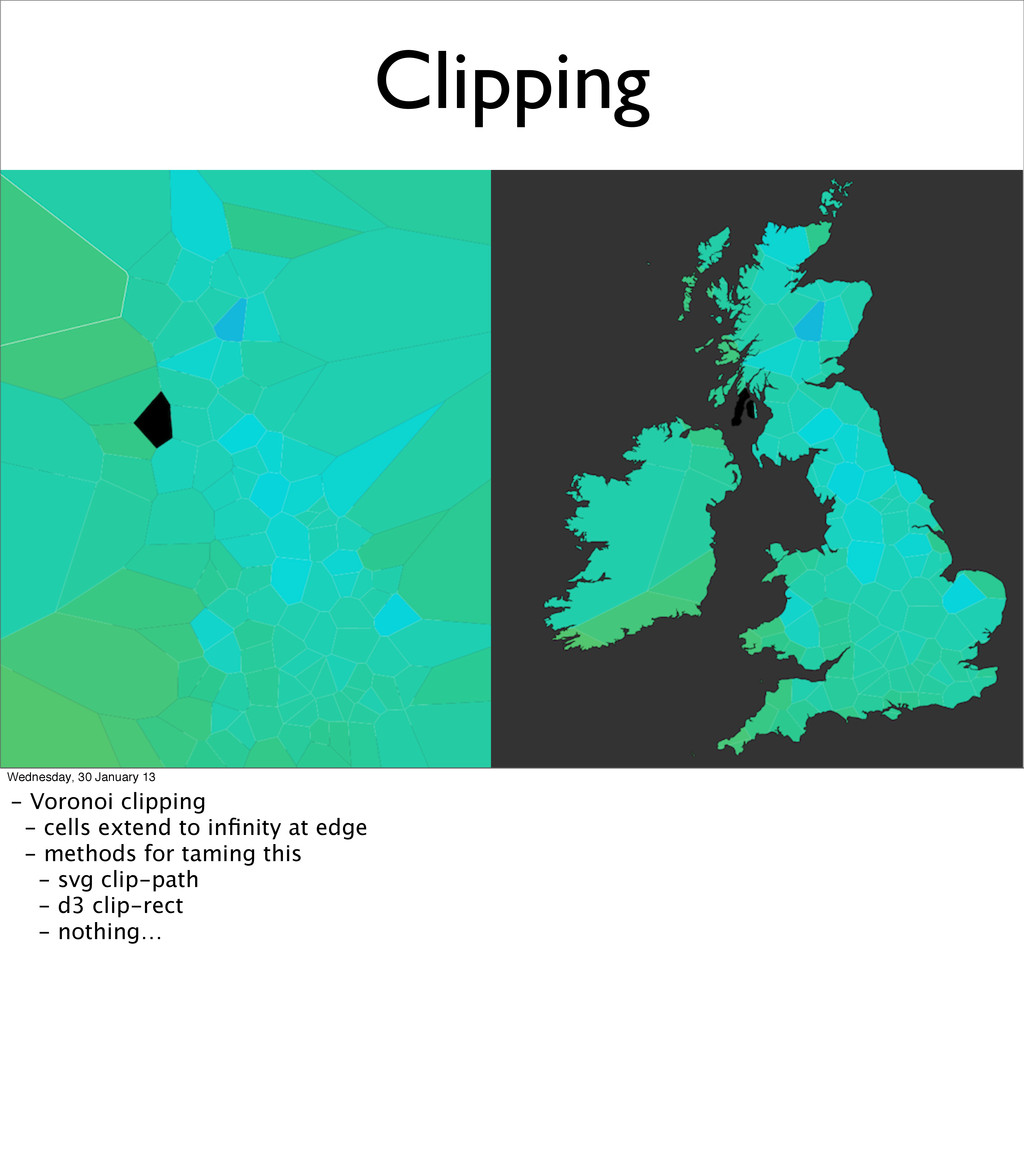
- dividing space into regions - initial points are called seeds - a region per seed contains all points closer to that seed than any other - why they are cool - perfect for our example
'#2b63d4', '#26d6d9', '#38c78e', '#94bd42', '#f2dd00', '#ff8700']) Wednesday, 30 January 13 - Colour Scales - explain the inputs and outputs - similar to CSS gradient colour stops - interpolating colours is hard by hand - Position Scales - same concept as colour scales - usage in the site
![Projection d3.geo.albers() .center([0, 55.4]) .rotate([4.4, 0]) .parallels([50, 60]) .scale(6000) Wednesday,](https://files.speakerdeck.com/presentations/cf2e01204d3e0130c23c22000a9199d6/slide_9.jpg)
![Colour scale d3.scale.linear() .domain([-15, -3, 3, 15, 20, 30]) .range([](https://files.speakerdeck.com/presentations/cf2e01204d3e0130c23c22000a9199d6/slide_15.jpg)