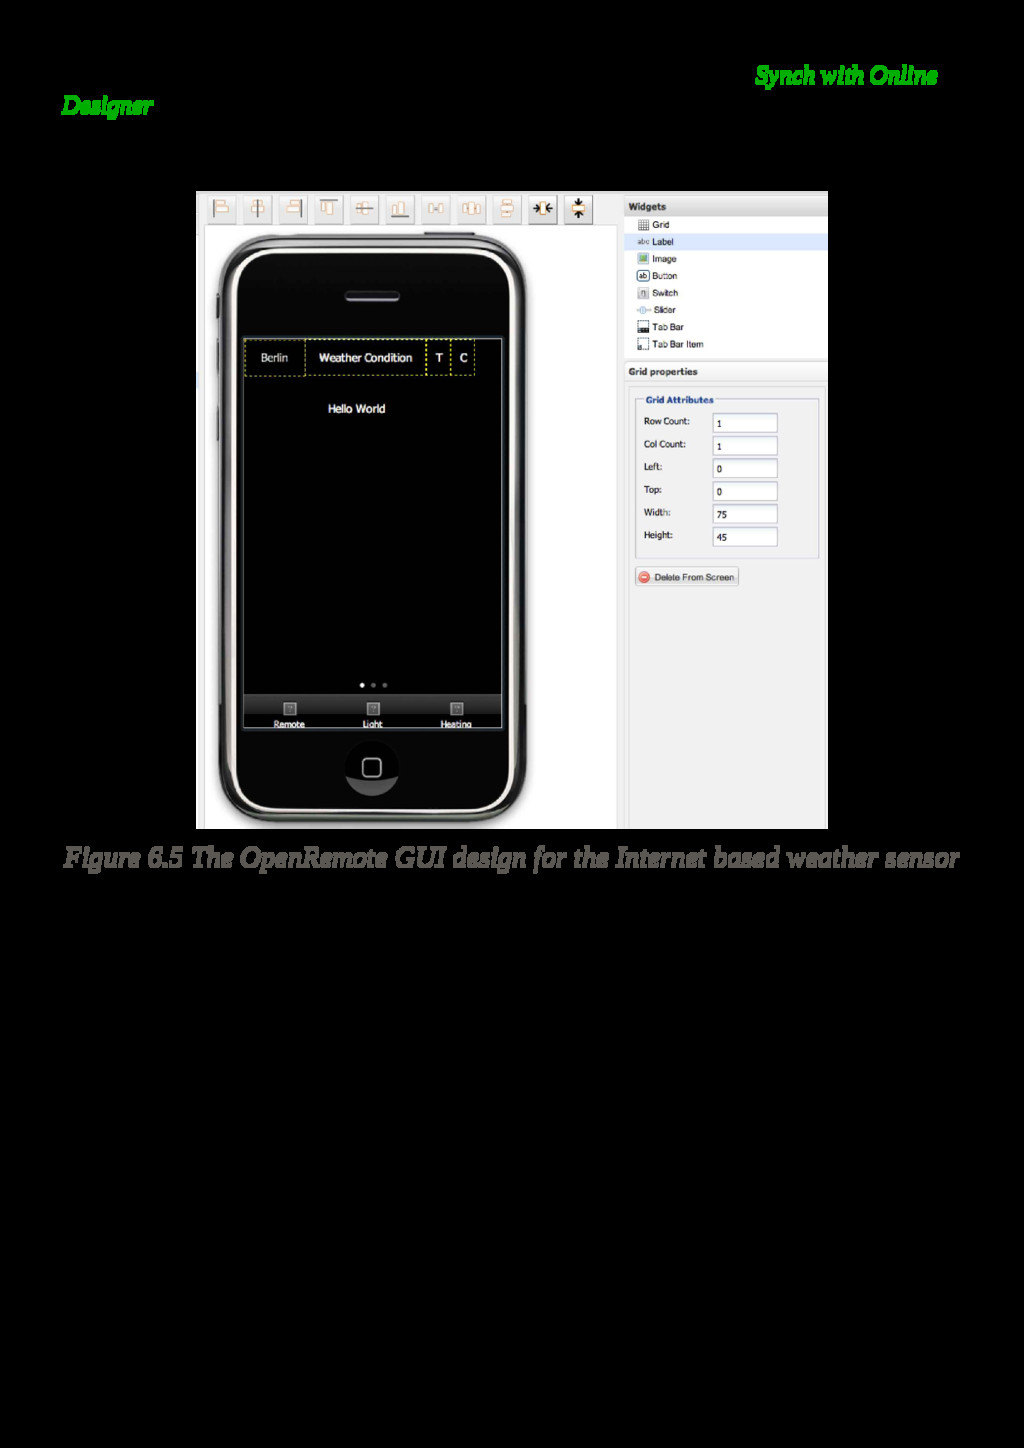
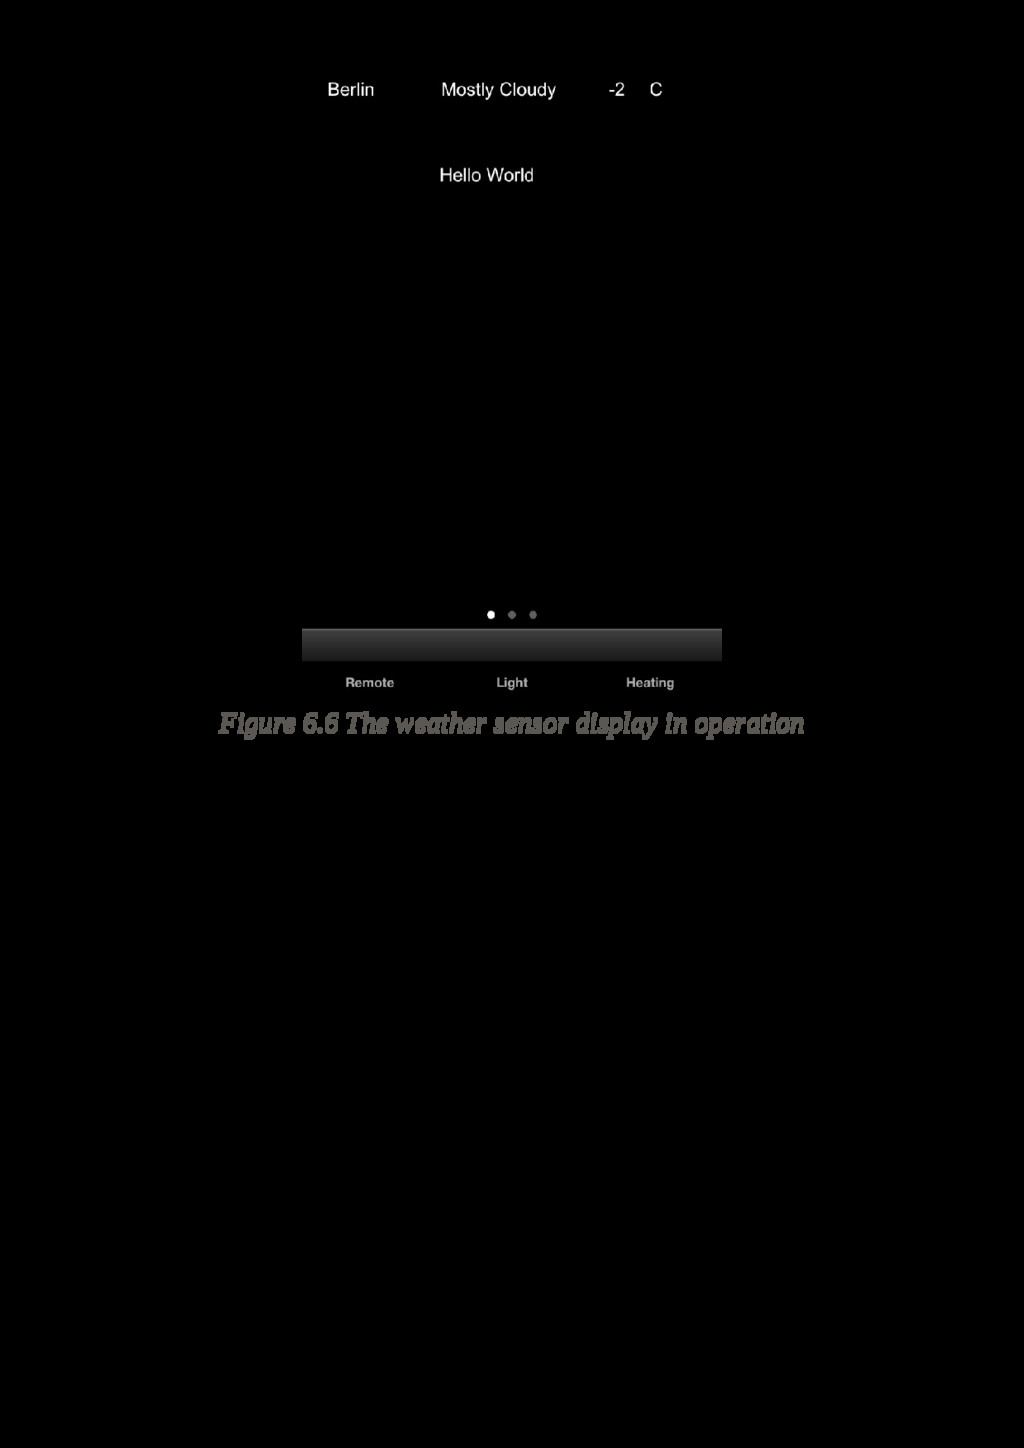
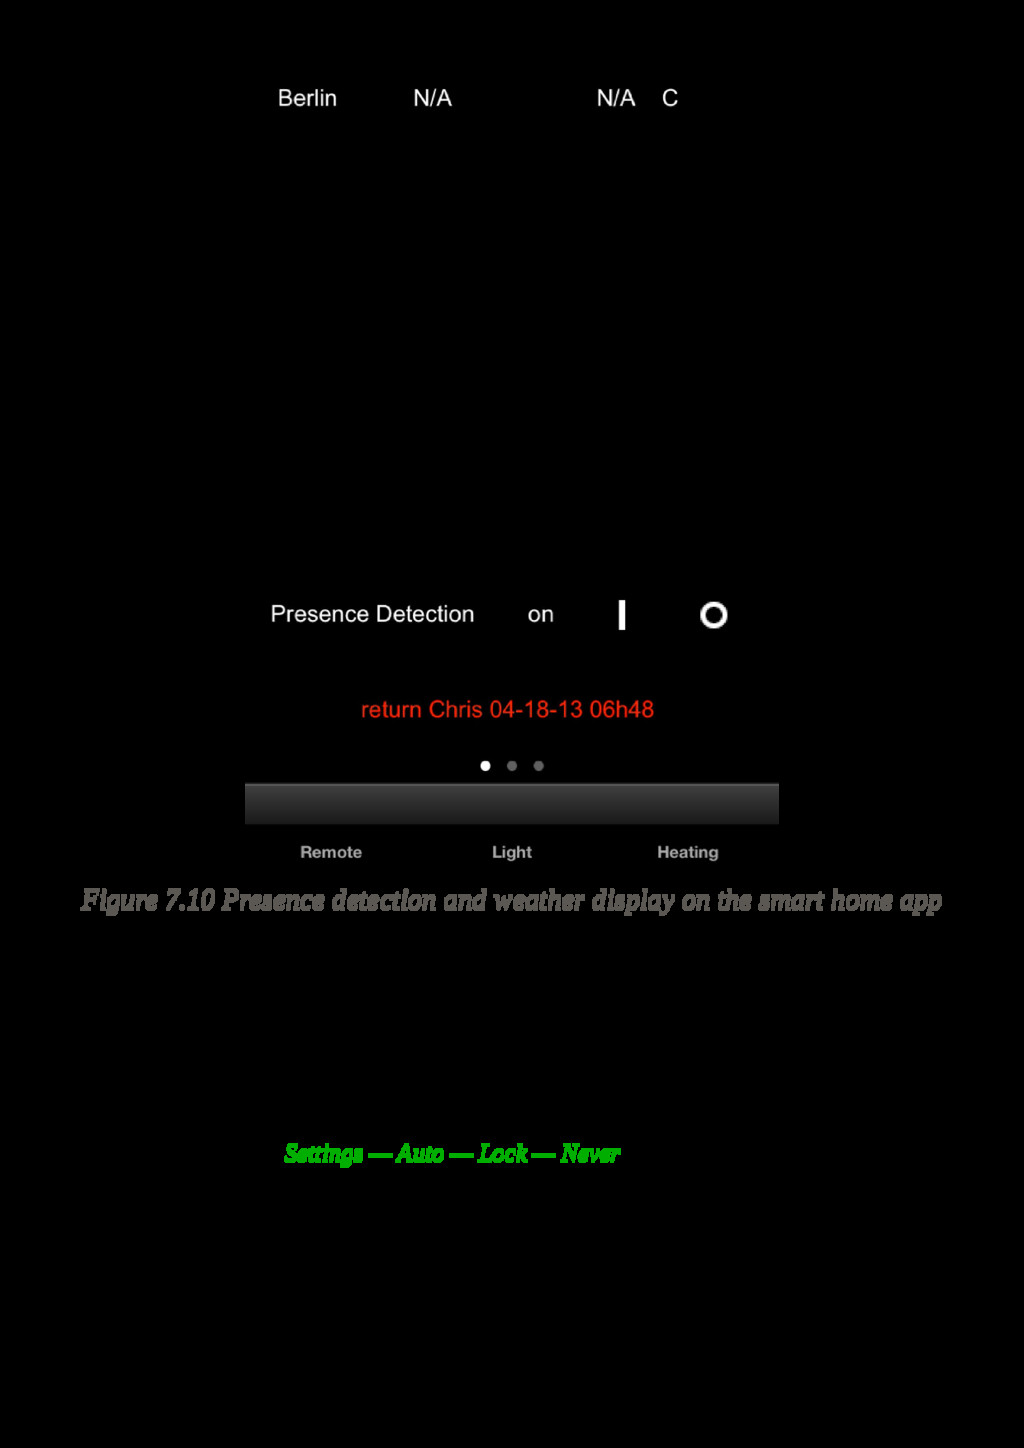
want to display the sensor output with our smart home app. Before we do that, we need to plan the layout for our GUI. Our plan is to have three screens called Remote, Lighting and Heating. In the UI designer window, we drag a Tab Bar item from the widget menu on the right to the bottom of our design and add three Tab Bar Item elements to it, which we call Remote, Heating, and Lighting. Then we add two new screens, in addition to the existing Remote screen, which we call Lighting and Heating. We will make use of these two screens later. (Fig. 6.3, Fig . 6.4) Fig. 6.3 Adding a Tab Bar Item to theOpenRemote GUI design Fig 6.4 Adding a New Screen to the Openremote GUI design For that, we add a grid on our remote screen for the display of our weather sensor. On our Remote screen we add a Grid element by dragging it from the menu into the design setting the parameters to: Row Count: 1, Col Count: 1, Left:0, Top:0, Width:75, Weight:45 This positions a grid with one cell of the size of 75x45 to the upper left corner of our design. We add three additional cells to the right: Row Count: 1, Col Count: 1, Left:75, Top:0, Width:150, Weight:45 Row Count: 1, Col Count: 1, Left:225, Top:0, Width:30, Weight:45 Row Count: 1, Col Count: 1, Left:255, Top:0, Width:30, Weight:45 We now drag an abc label symbol into to the upper left cell and enter the location name for our weather report in the Label Properties field to the right, which is in our case Berlin. We do the same for the second cell, entering Weather Condition in the text field, but here we also add the sensor Weather Condition, which can be selected from the sensor drop down menu in Label properties. In the next field, we enter T for temperature and select the sensor Temperature Berlin. And the final cell just contains the unit for our temperature display, in our case C for Celsius (Figure 6.5). Now we save our design by clicking on the disc symbol.
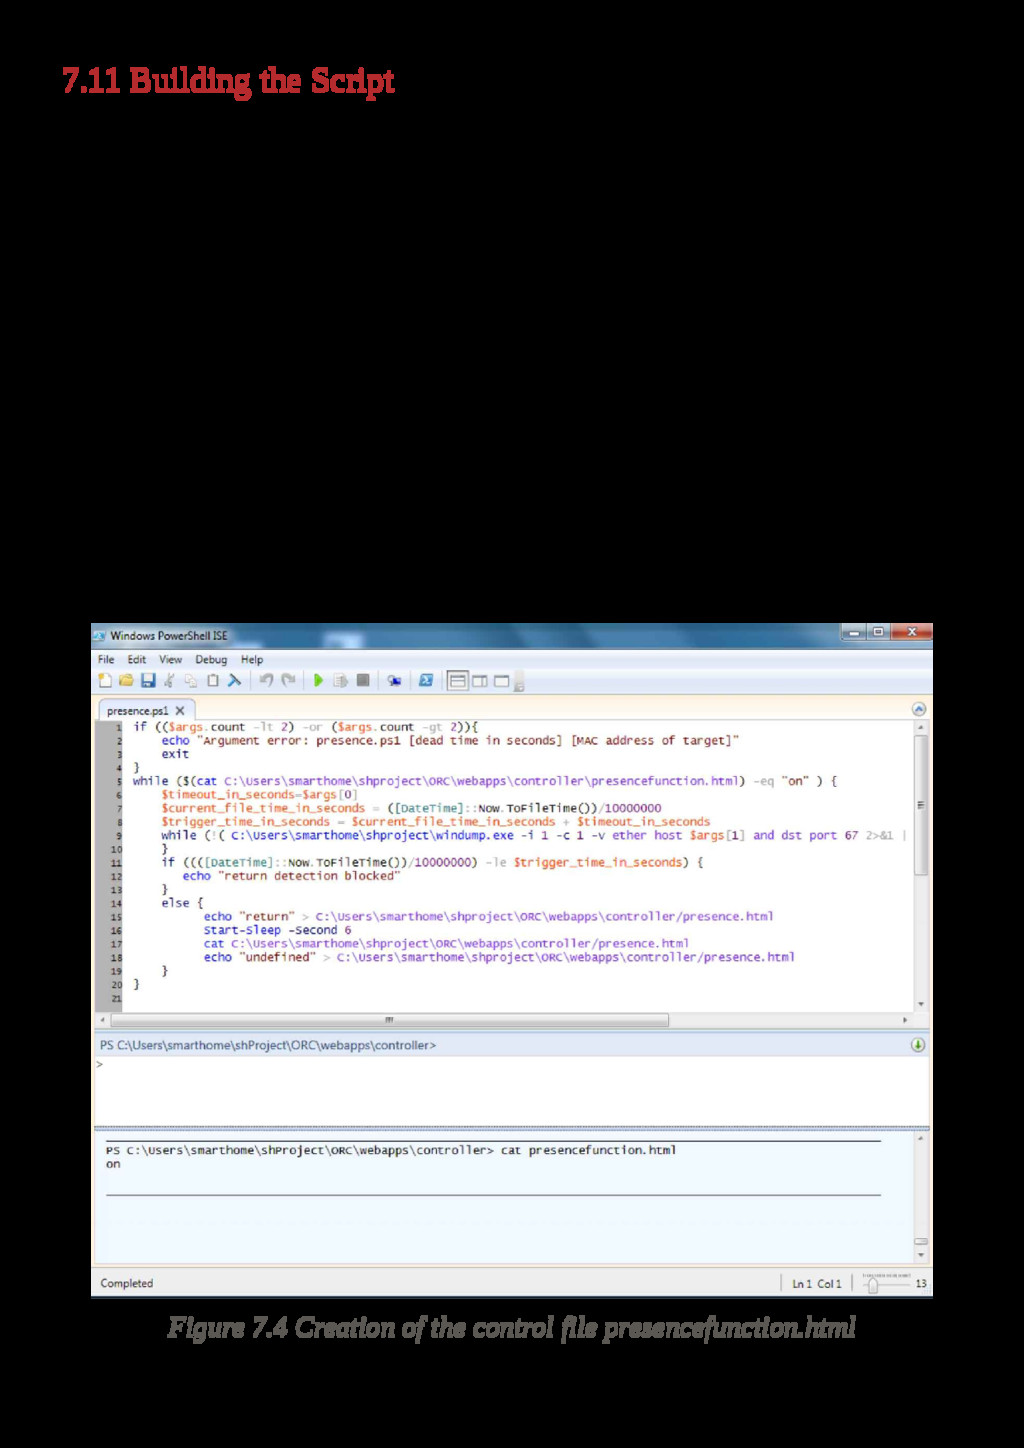
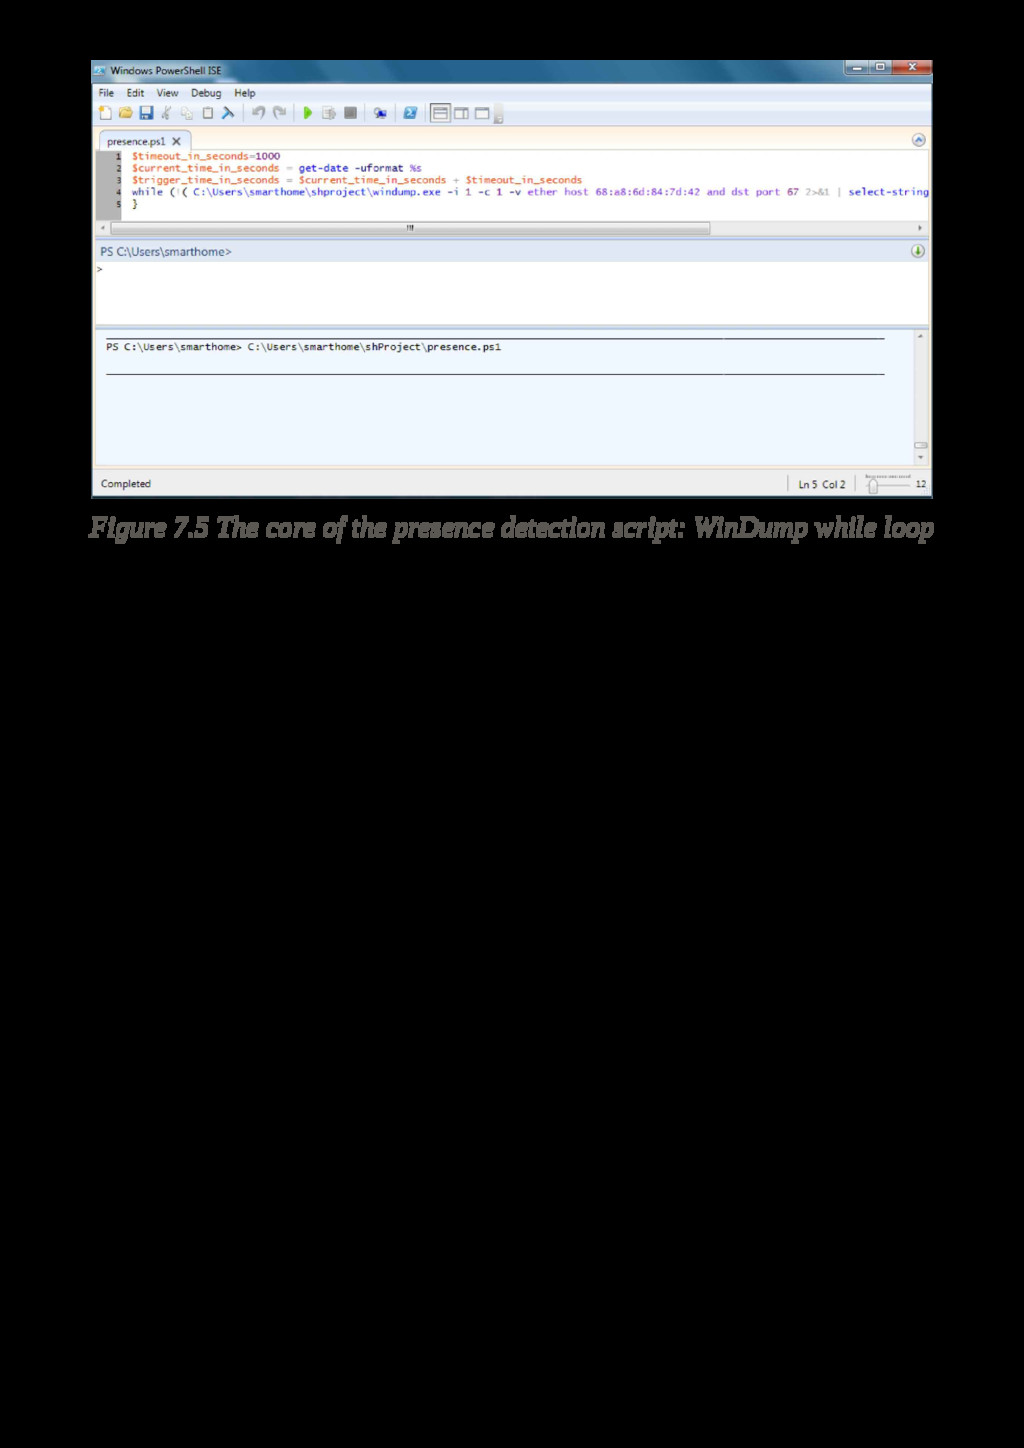
![$timeout_in_seconds=$args[0] $current_file_time_in_seconds = ([DateTime]::Now.ToFileTime())/10000000 $trigger_time_in_seconds = $current_file_time_in_seconds + $timeout_in_seconds while](https://files.speakerdeck.com/presentations/2c48e8a975f840ac85e8c30fa98e5e1e/slide_142.jpg)
![echo “return $args[1]” > C:\Users\smarthome\shProject\ORC\webapps\controller\presence.html .\preslog.ps1 presencelog.html “return Chris” cat](https://files.speakerdeck.com/presentations/2c48e8a975f840ac85e8c30fa98e5e1e/slide_147.jpg)
![echo “$0: Argument error: itunesStart.sh [playlist]” exit 2 fi exec](https://files.speakerdeck.com/presentations/2c48e8a975f840ac85e8c30fa98e5e1e/slide_156.jpg)
![SwitchAudioSource Please specify audio device. Usage: SwitchAudioSource [-a] [-c] [-t](https://files.speakerdeck.com/presentations/2c48e8a975f840ac85e8c30fa98e5e1e/slide_174.jpg)