The era of Big Data as arrived but, on many levels, most organizations are woefully unprepared. Far too many enterprises erroneously believe and act like nothing has really changed. As such, they continue to depend exclusively on reporting stalwarts like Microsoft Excel, static dashboards, basic query applications, and even traditional business intelligence tools. And they are missing out on tremendous opportunities.
Amidst all of the hype and confusion surrounding Big Data, though, a new type of enterprise is emerging: The Visual Organization. A relative handful of organizations has realized that today's ever-increasing data streams, volumes, and velocity require new applications. In turn, these new tools promote a different mind-set--one based upon data discovery and exploration, not conventional enterprise "reporting."
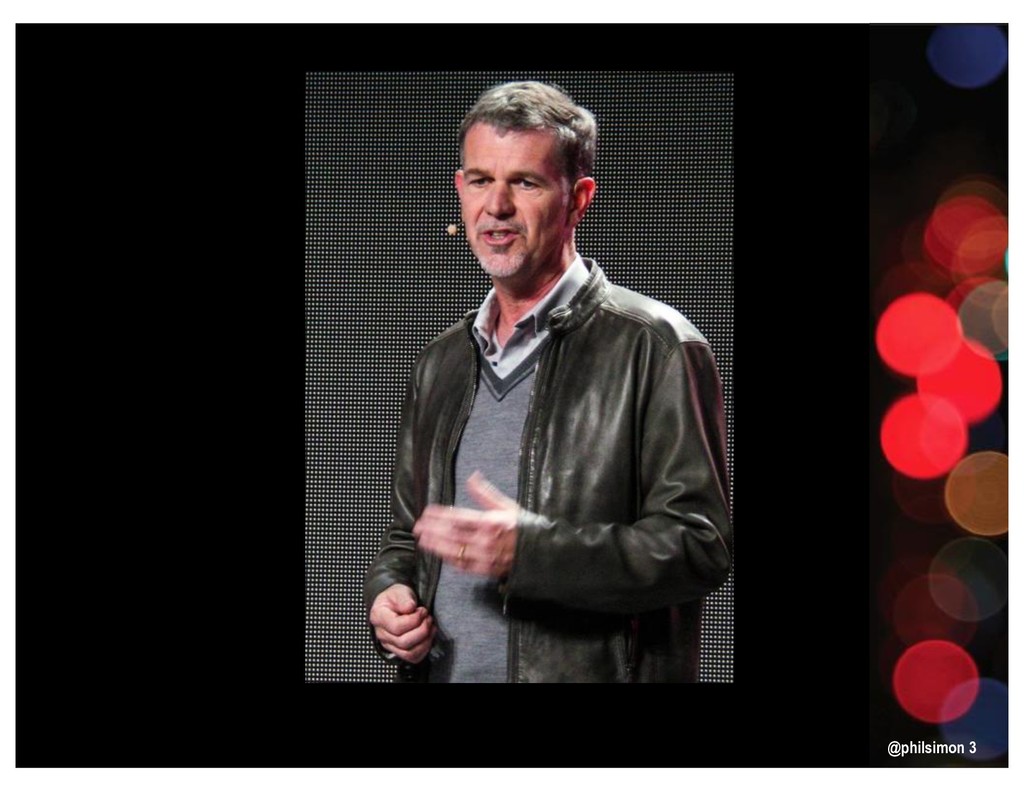
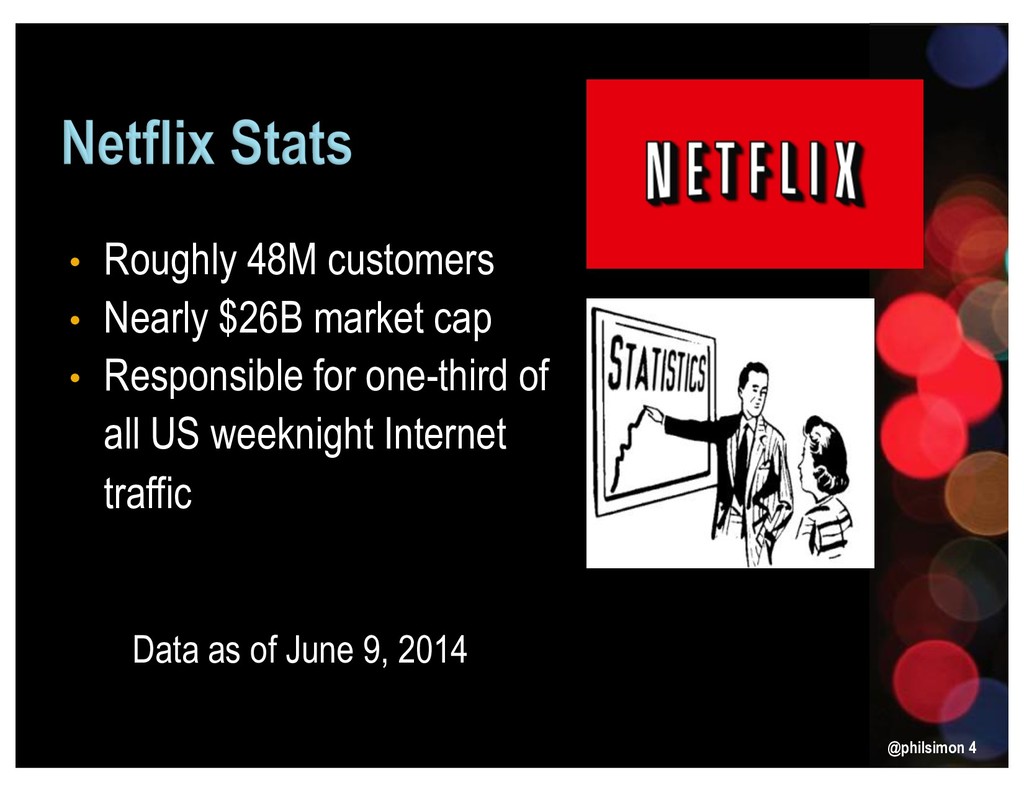
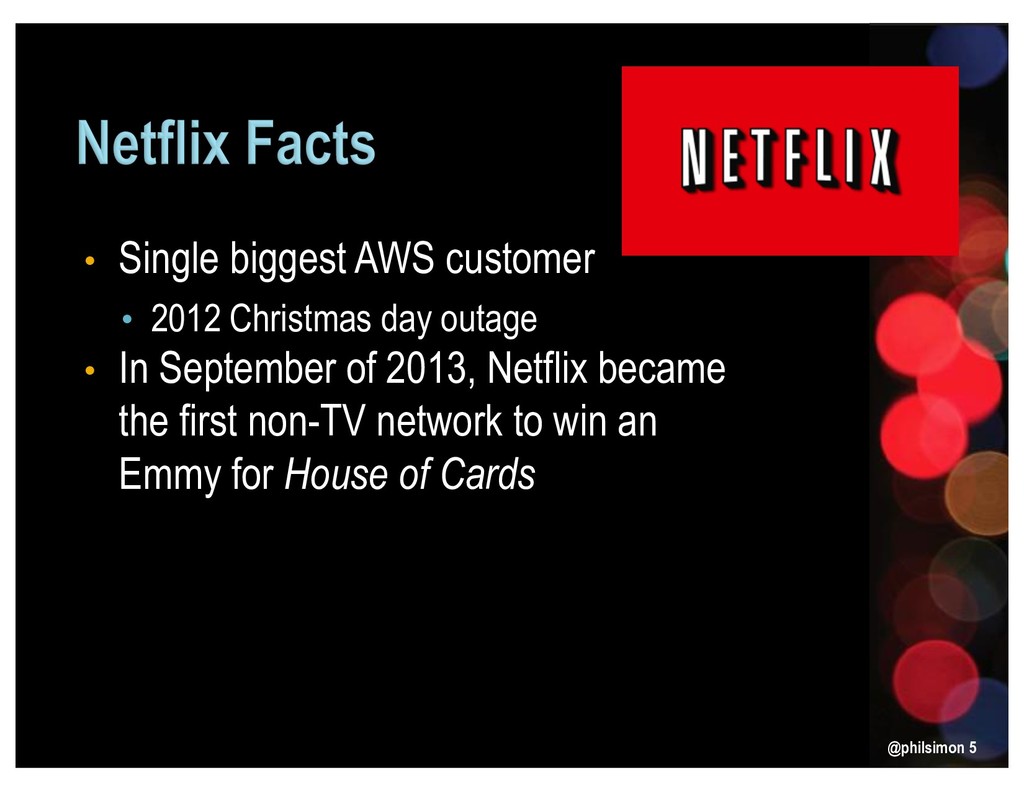
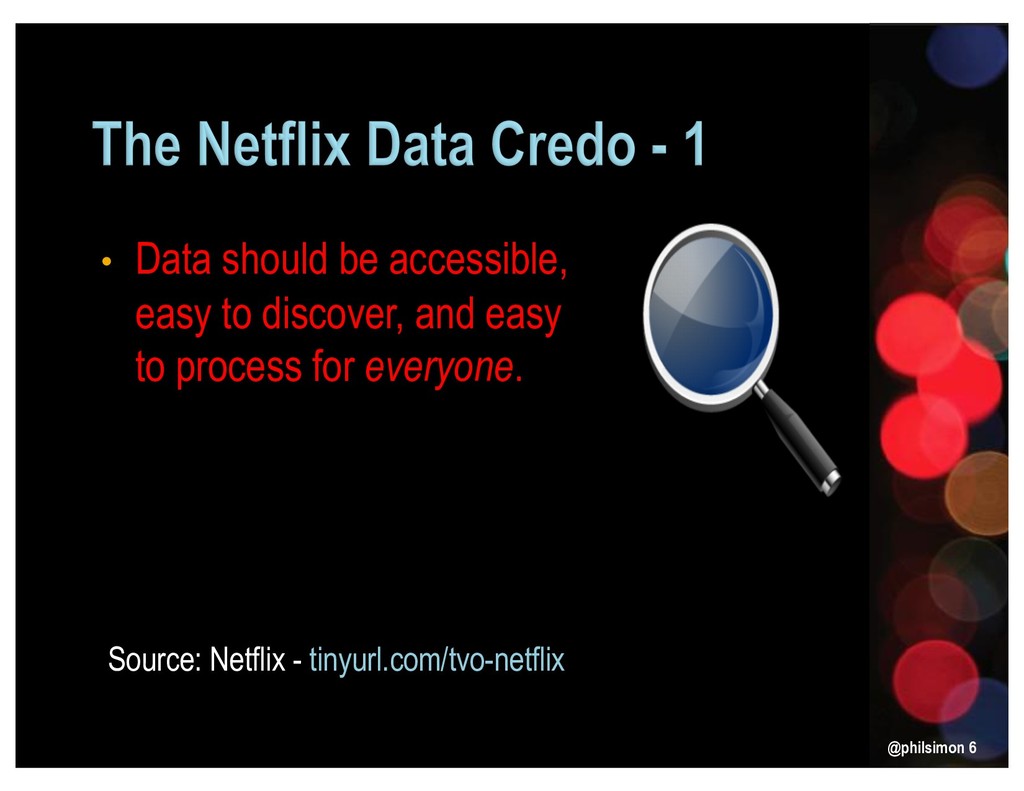
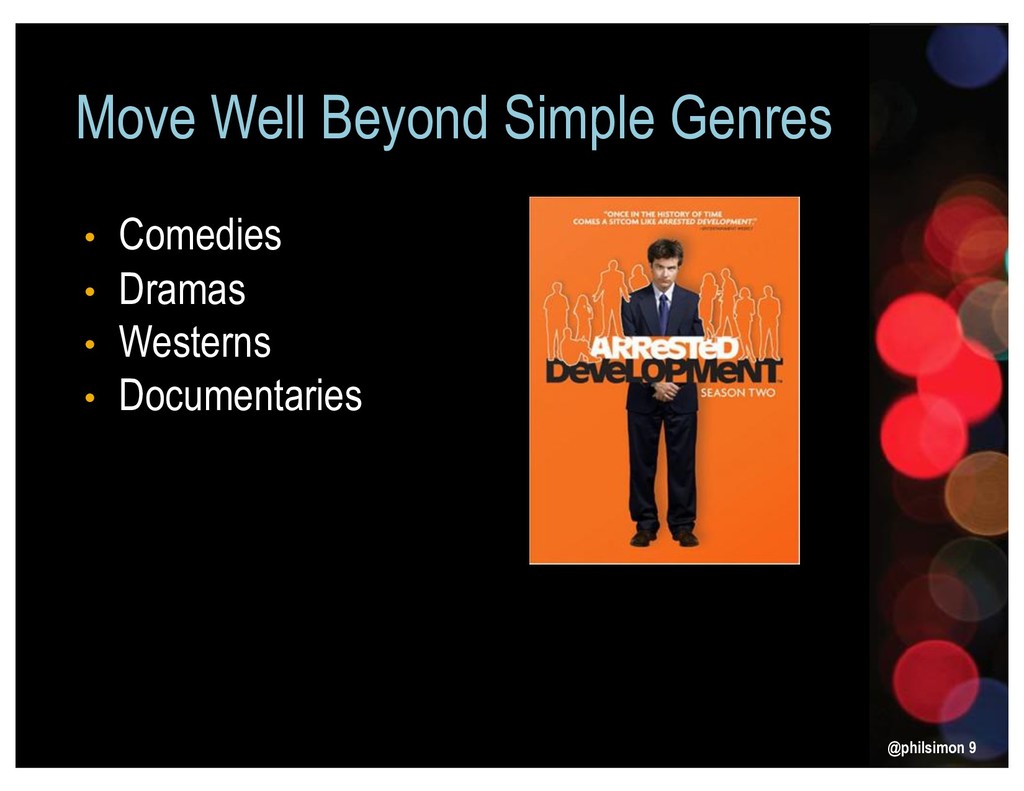
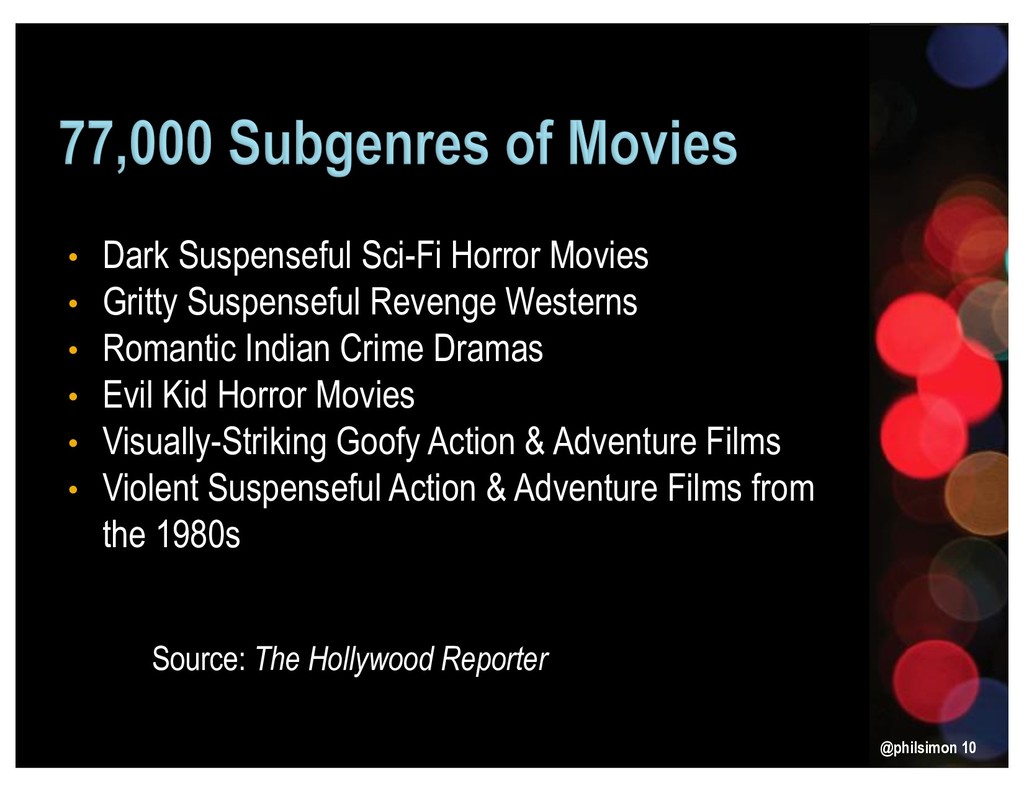
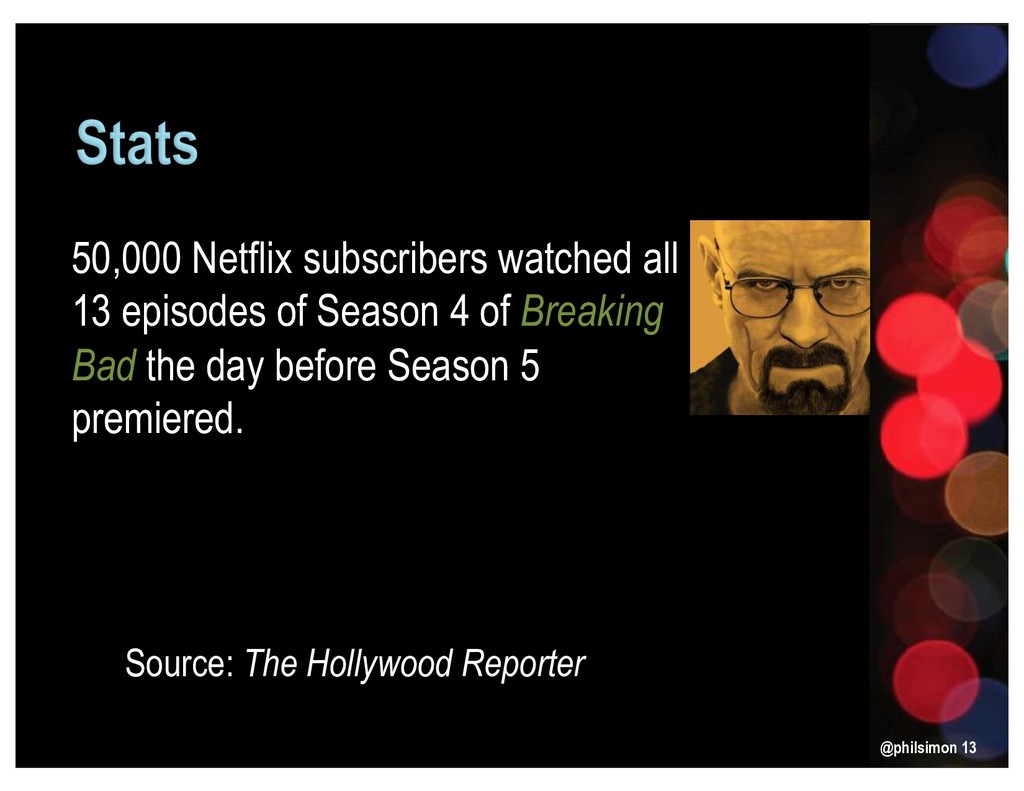
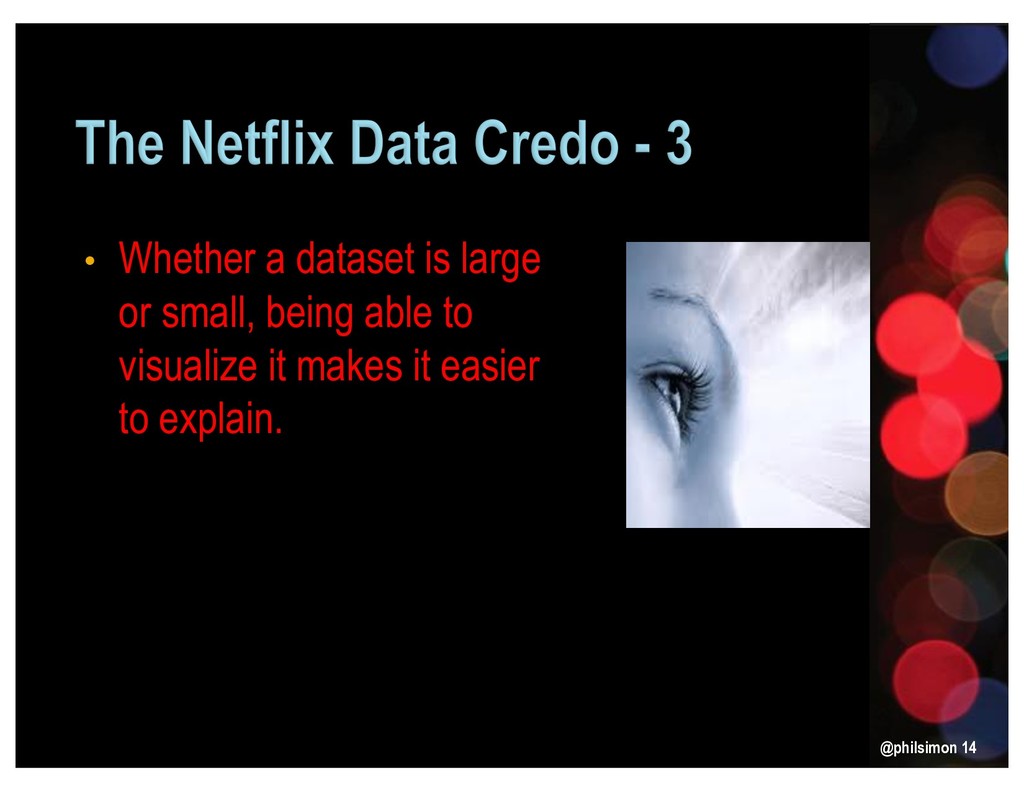
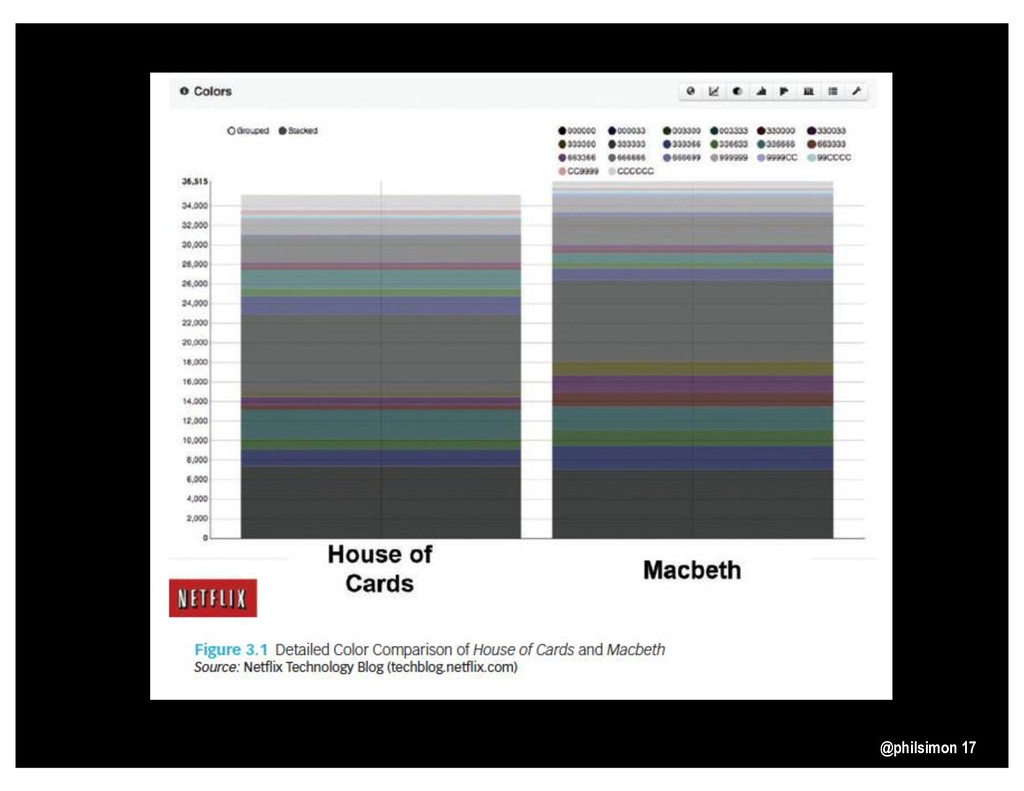
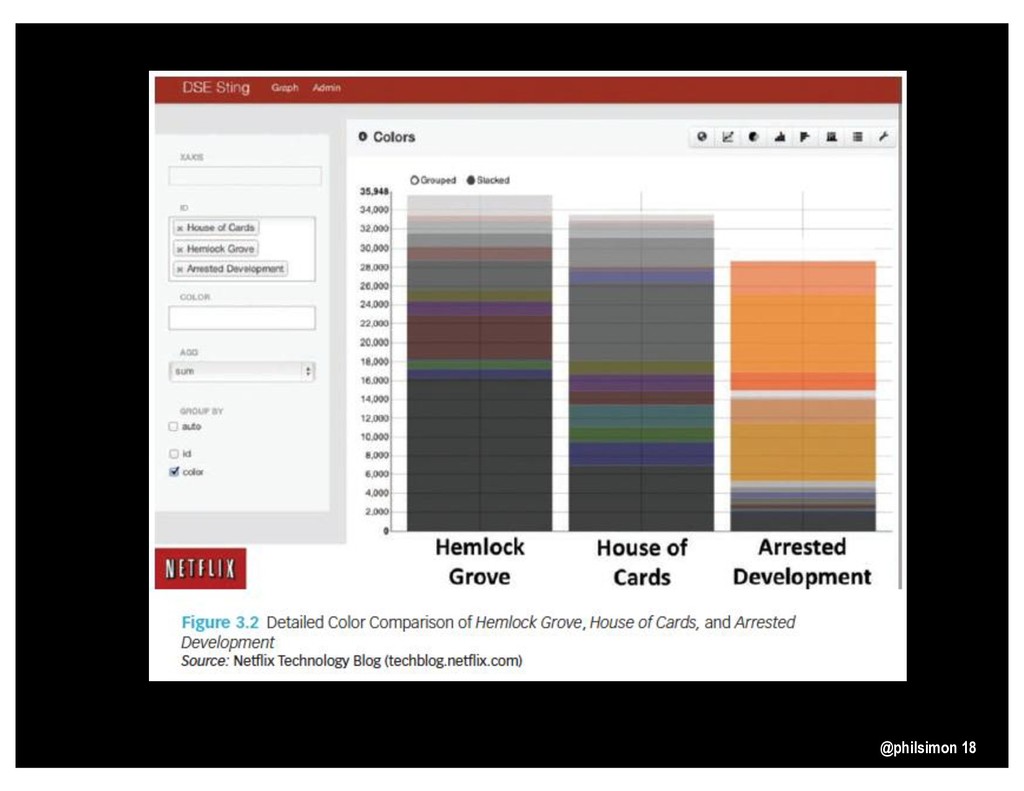
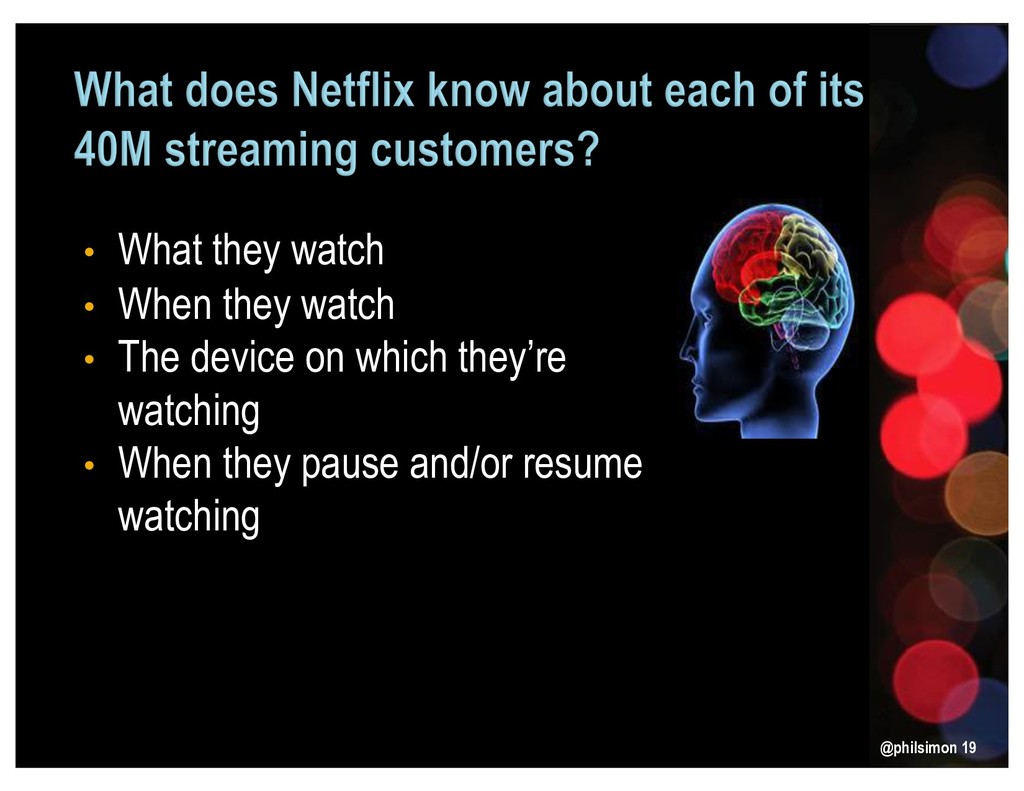
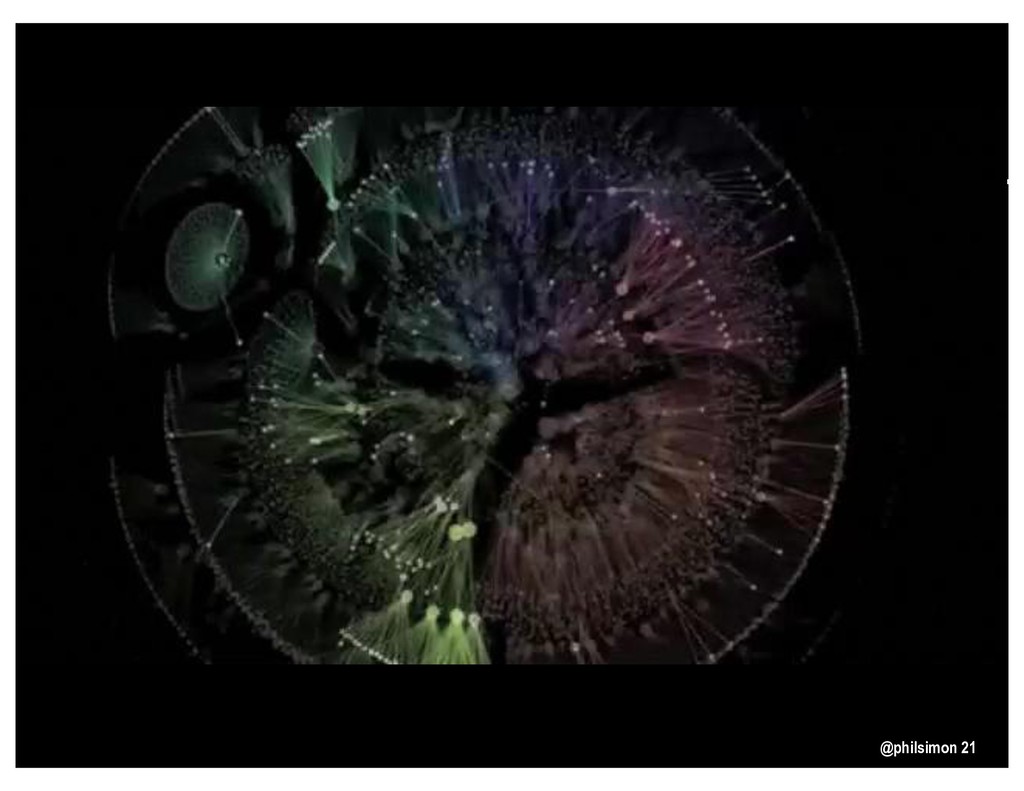
For instance, Netflix builds cutting-edge dataviz tools to better understand its 40 million customers. And it's hardly alone in its innovative use of new data visualization technologies. Employees at Autodesk use a remarkable and interactive tool that visualizes current and historical employee movement. From this, they can identify potential management issues and see what a corporate reorg really looks like. Through cutting-edge dataviz, startup Wedgies instantly serves up real-time poll results while monitoring poll traction and site issues. The University of Texas is bringing a visual type of transparency to academia. It makes unprecedented amounts and sources of institutional data available on its website. Anyone with the desire and an Internet connection can slice and dice UT data in myriad ways. And then there's eBay. Powerful data-discovery tools allow employees to effectively "see" what ebay.com would look like as a brick-and-mortar store.
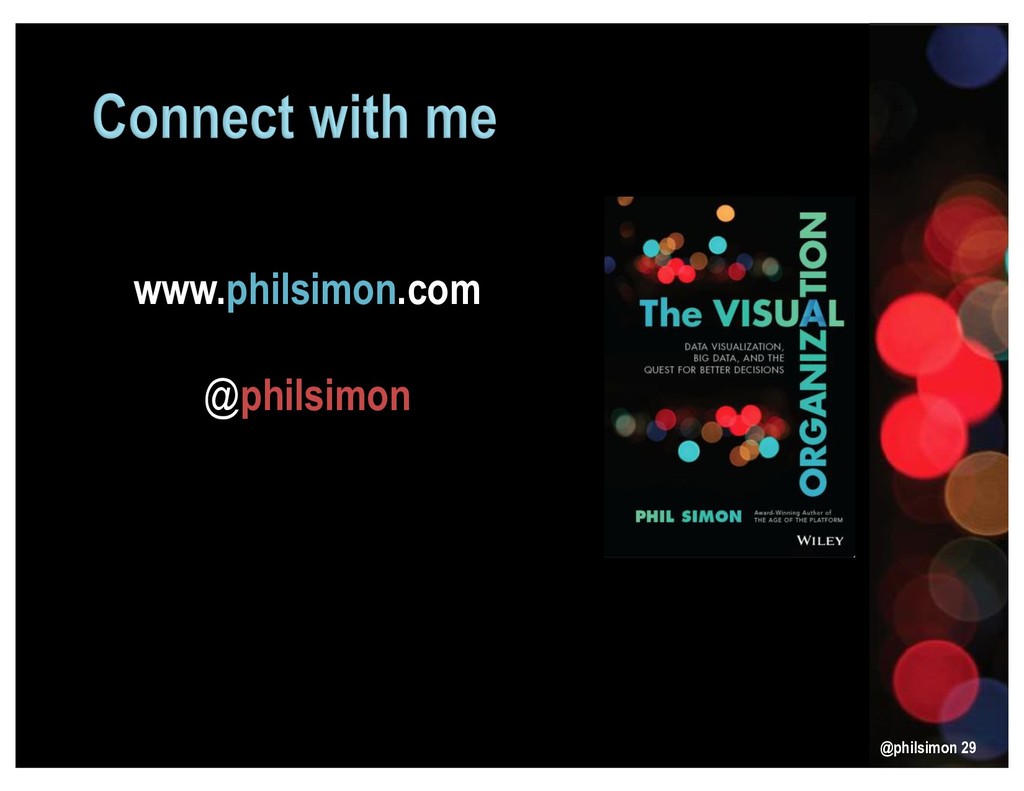
In The Visual Organization, award-winning author, keynote speaker, and recognized technology expert Phil Simon demonstrates how progressive enterprises have turned traditional dataviz on its head. In their stead, they are embracing new, interactive, and more robust tools that help locate the signals in the noise that is Big Data. As a result, these enterprises are asking better questions and making better business decisions.
Rife with real-world examples and practical advice, The Visual Organization is a full-color tour de force. Simon deftly explains how organizations can do more than just survive the data deluge; they can thrive in it. It is required reading for executives, professionals, and others interested in unleashing the power of their data.