and CTO of 3 startups (total 30M+ users), all based on Postgres Founder of #RuPostgres (1600+ members on Meetup.com) Twitter: @postgresmen Private consulting practice in the U.S. (SF Bay Area) http://PostgreSQL.support 2
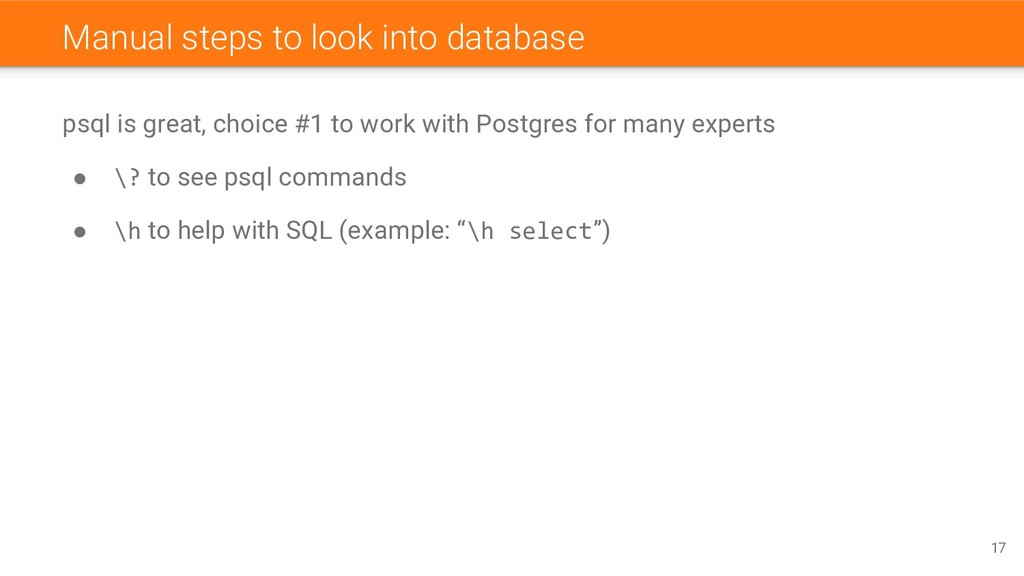
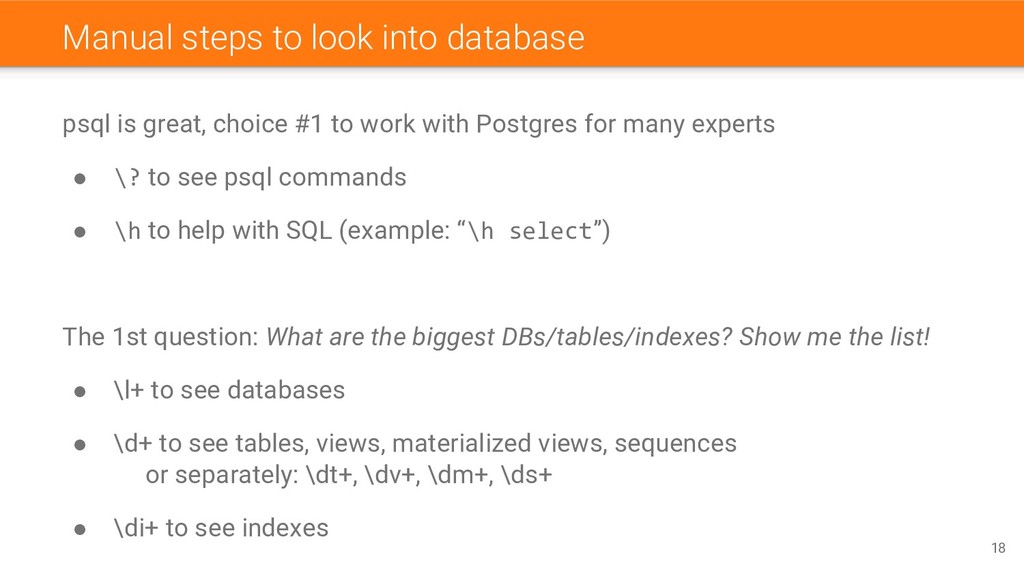
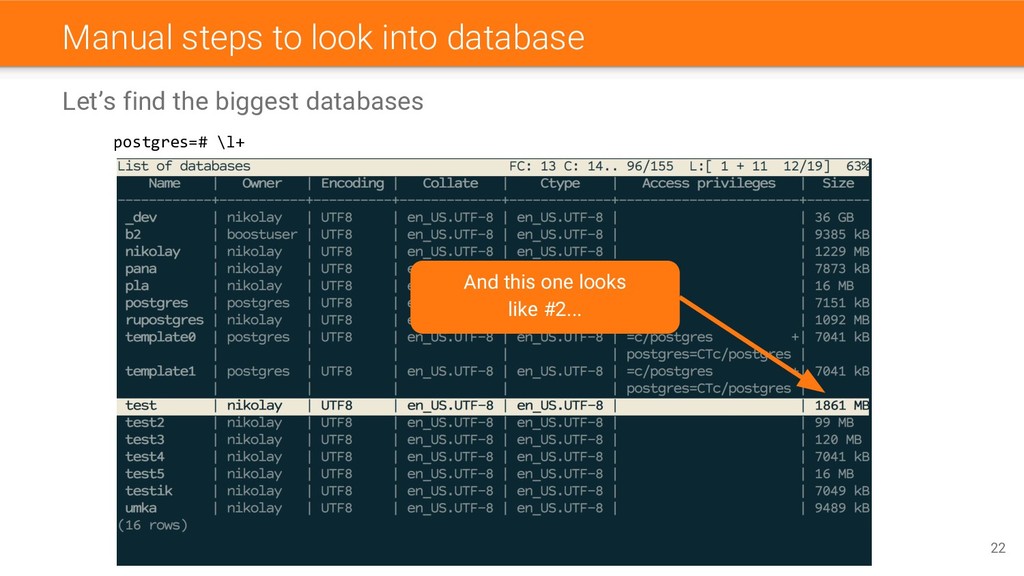
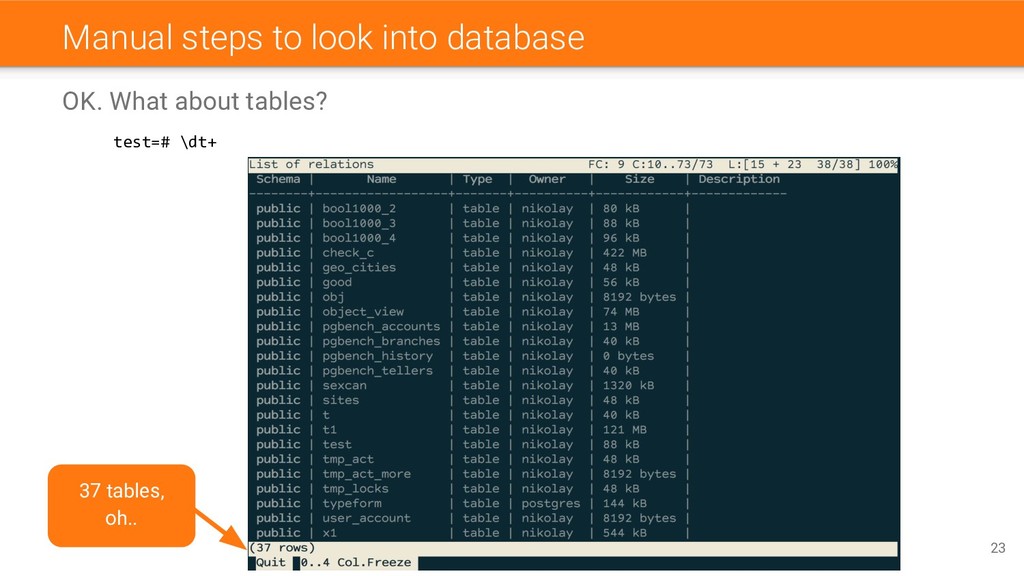
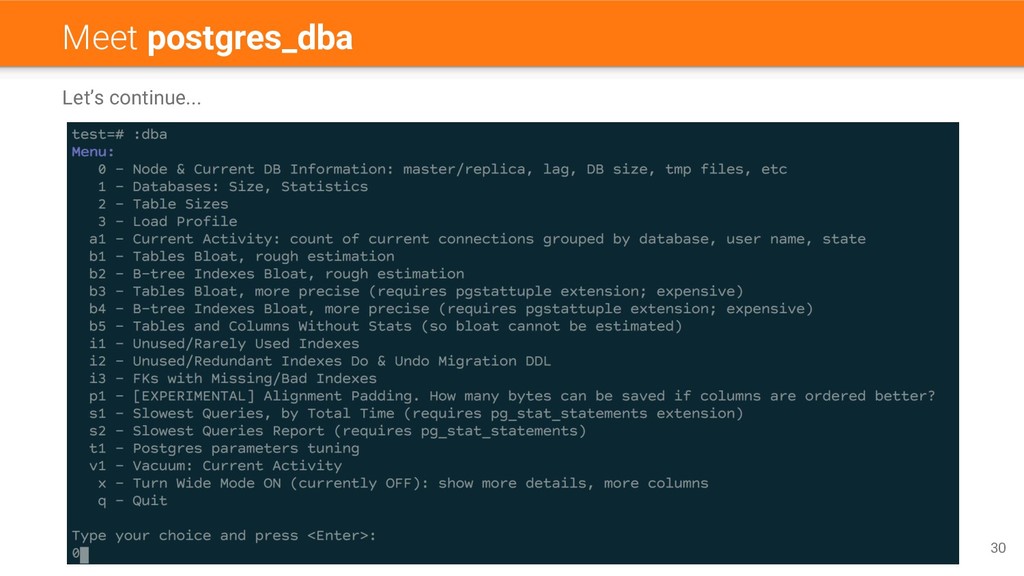
#1 to work with Postgres for many experts • \? to see psql commands • \h to help with SQL (example: “\h select”) The 1st question: What are the biggest DBs/tables/indexes? Show me the list! • \l+ to see databases • \d+ to see tables, views, materialized views, sequences or separately: \dt+, \dv+, \dm+, \ds+ • \di+ to see indexes 18
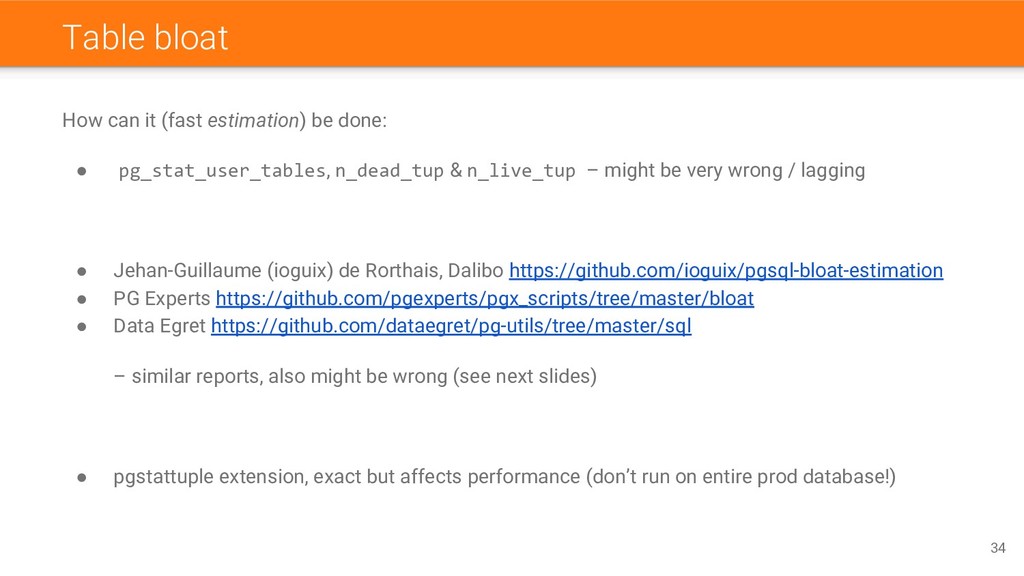
pg_stat_user_tables, n_dead_tup & n_live_tup – might be very wrong / lagging • Jehan-Guillaume (ioguix) de Rorthais, Dalibo https://github.com/ioguix/pgsql-bloat-estimation • PG Experts https://github.com/pgexperts/pgx_scripts/tree/master/bloat • Data Egret https://github.com/dataegret/pg-utils/tree/master/sql – similar reports, also might be wrong (see next slides) 33
pg_stat_user_tables, n_dead_tup & n_live_tup – might be very wrong / lagging • Jehan-Guillaume (ioguix) de Rorthais, Dalibo https://github.com/ioguix/pgsql-bloat-estimation • PG Experts https://github.com/pgexperts/pgx_scripts/tree/master/bloat • Data Egret https://github.com/dataegret/pg-utils/tree/master/sql – similar reports, also might be wrong (see next slides) • pgstattuple extension, exact but affects performance (don’t run on entire prod database!) 34
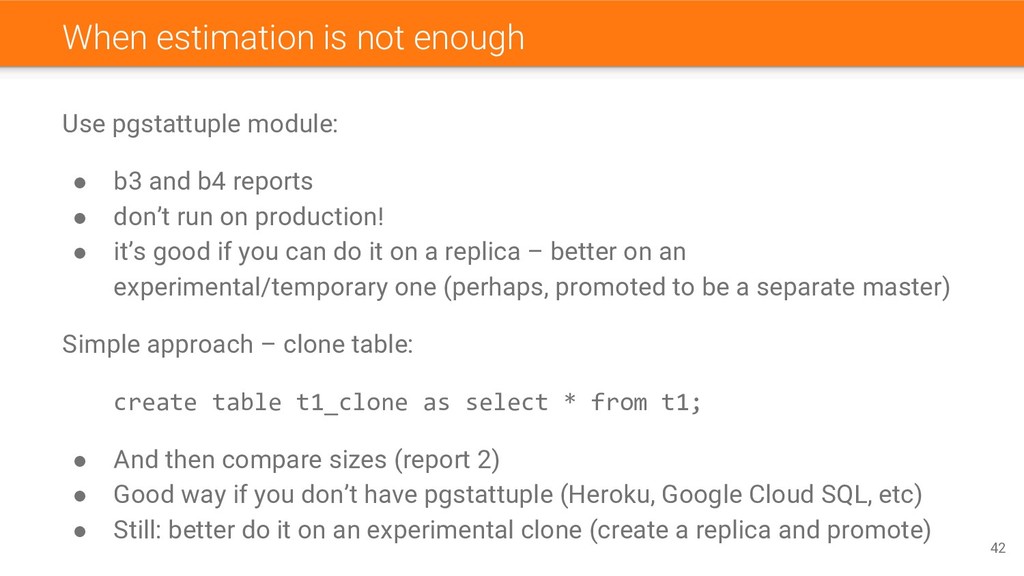
and b4 reports • don’t run on production! • it’s good if you can do it on a replica – better on an experimental/temporary one (perhaps, promoted to be a separate master) Simple approach – clone table: create table t1_clone as select * from t1; • And then compare sizes (report 2) • Good way if you don’t have pgstattuple (Heroku, Google Cloud SQL, etc) • Still: better do it on an experimental clone (create a replica and promote) 42
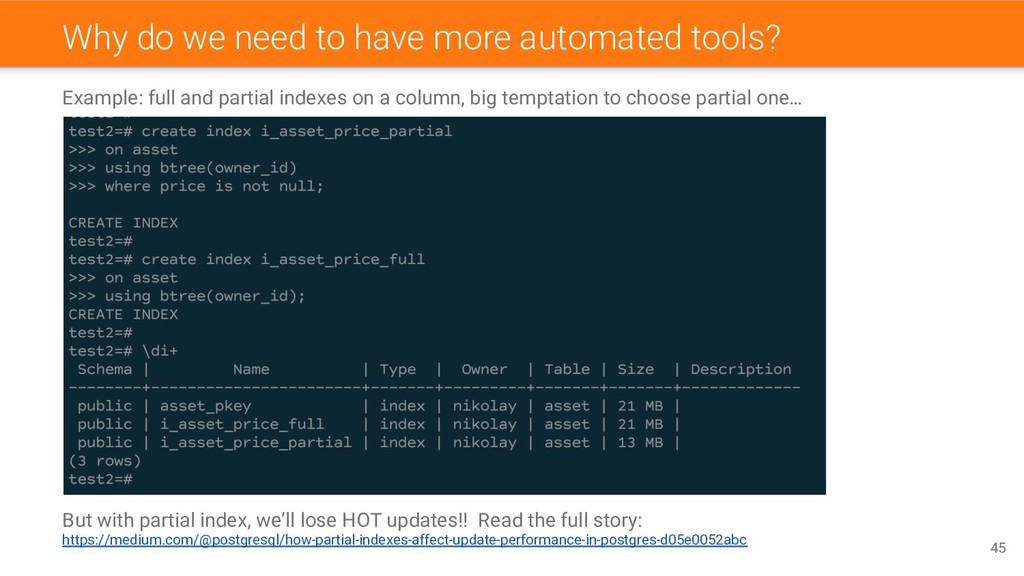
full and partial indexes on a column, big temptation to choose partial one… But with partial index, we’ll lose HOT updates!! Read the full story: https://medium.com/@postgresql/how-partial-indexes-affect-update-performance-in-postgres-d05e0052abc 45
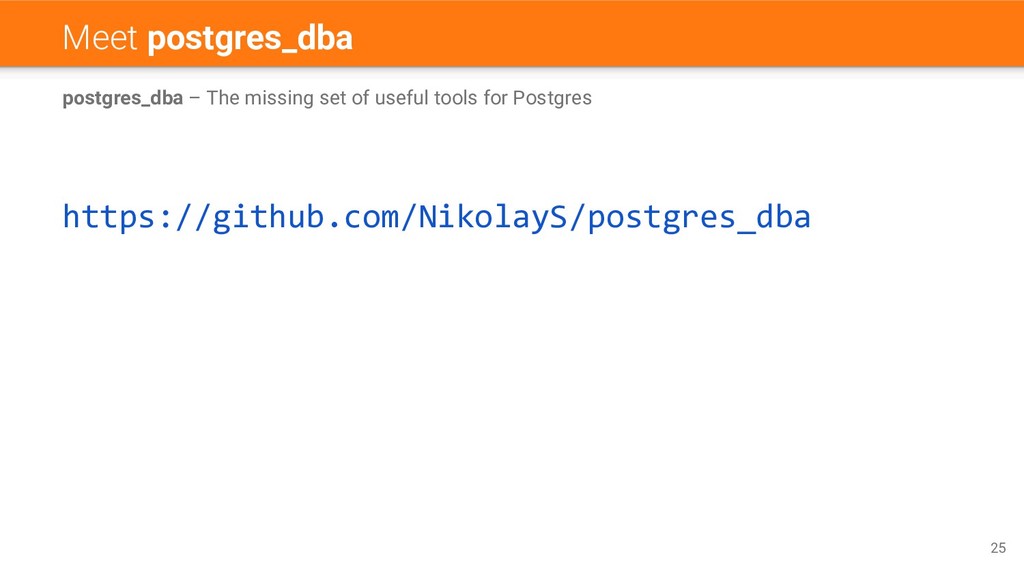
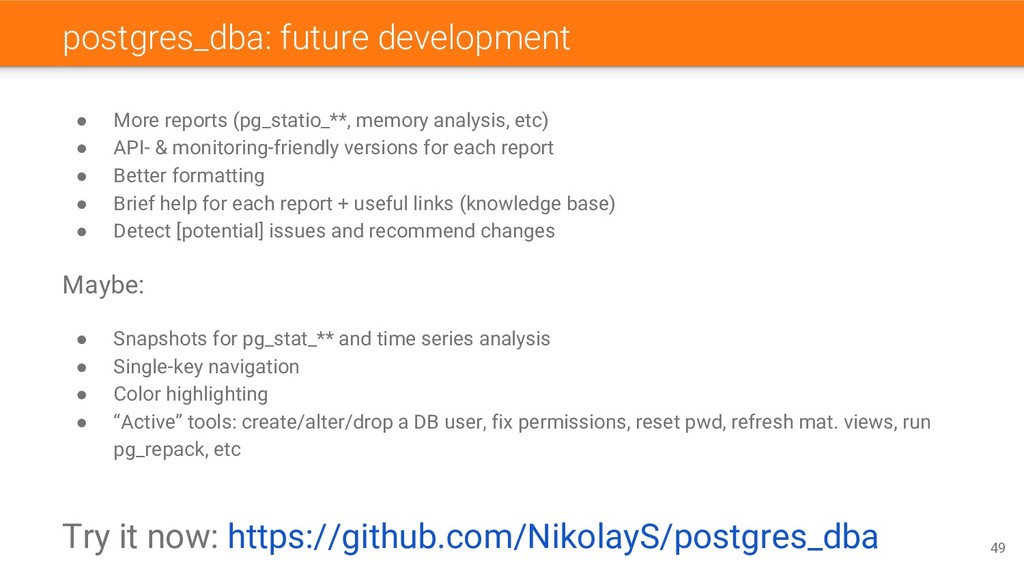
• API- & monitoring-friendly versions for each report • Better formatting • Brief help for each report + useful links (knowledge base) • Detect [potential] issues and recommend changes Maybe: • Snapshots for pg_stat_** and time series analysis • Single-key navigation • Color highlighting • “Active” tools: create/alter/drop a DB user, fix permissions, reset pwd, refresh mat. views, run pg_repack, etc Try it now: https://github.com/NikolayS/postgres_dba 49
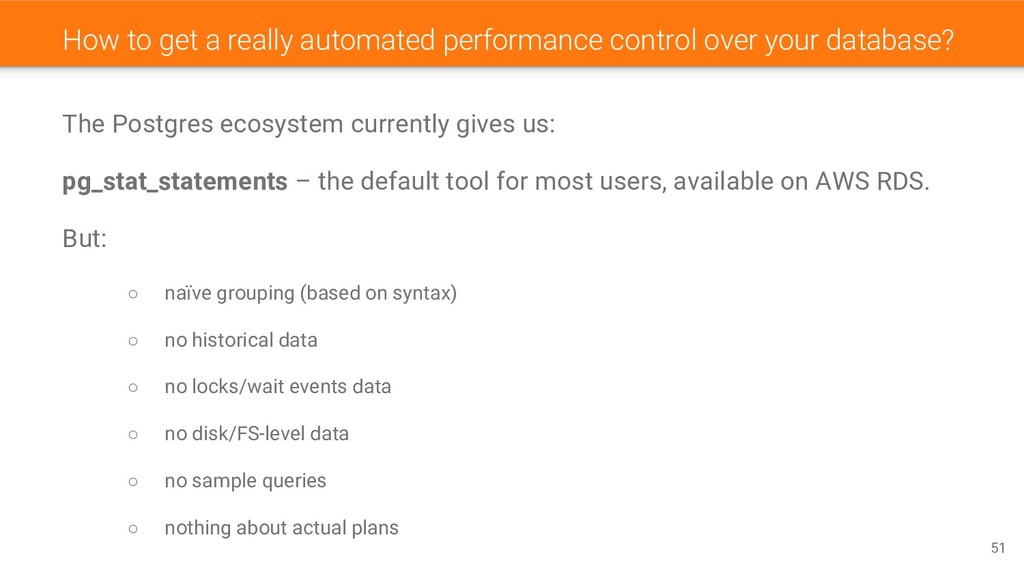
database? The Postgres ecosystem currently gives us: pg_stat_statements – the default tool for most users, available on AWS RDS. But: ◦ naïve grouping (based on syntax) ◦ no historical data ◦ no locks/wait events data ◦ no disk/FS-level data ◦ no sample queries ◦ nothing about actual plans 51
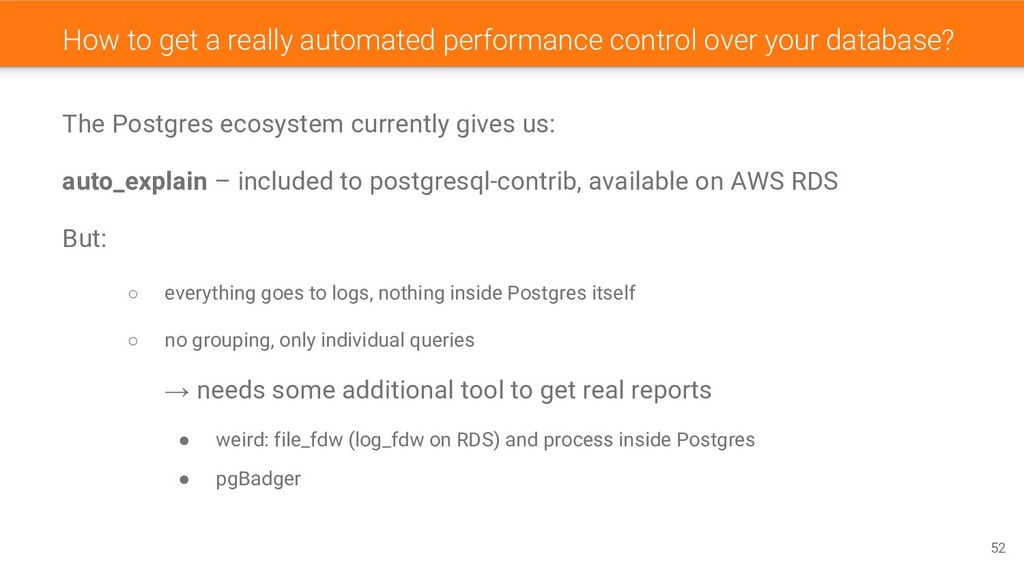
database? The Postgres ecosystem currently gives us: auto_explain – included to postgresql-contrib, available on AWS RDS But: ◦ everything goes to logs, nothing inside Postgres itself ◦ no grouping, only individual queries → needs some additional tool to get real reports • weird: file_fdw (log_fdw on RDS) and process inside Postgres • pgBadger 52
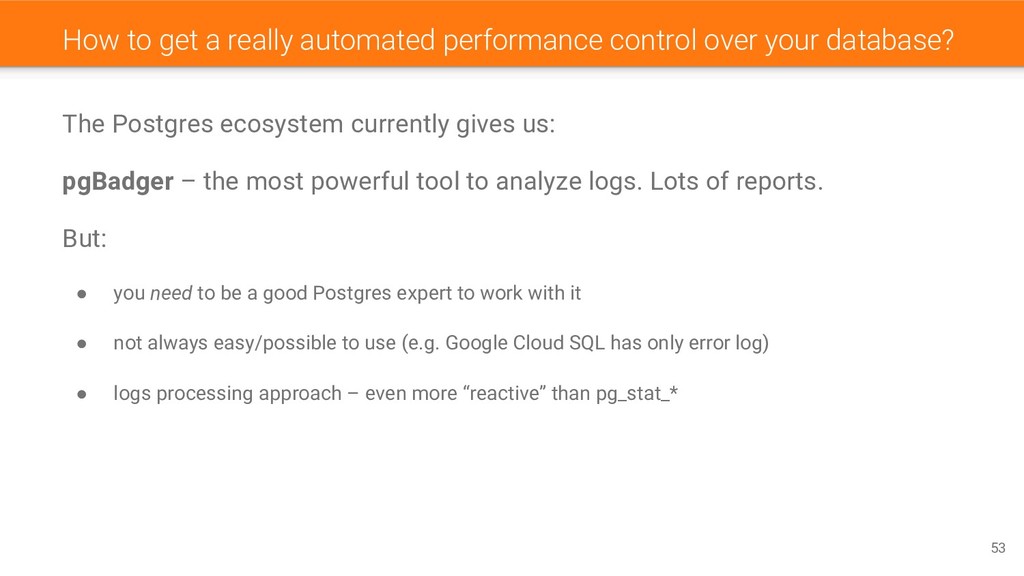
database? The Postgres ecosystem currently gives us: pgBadger – the most powerful tool to analyze logs. Lots of reports. But: • you need to be a good Postgres expert to work with it • not always easy/possible to use (e.g. Google Cloud SQL has only error log) • logs processing approach – even more “reactive” than pg_stat_* 53
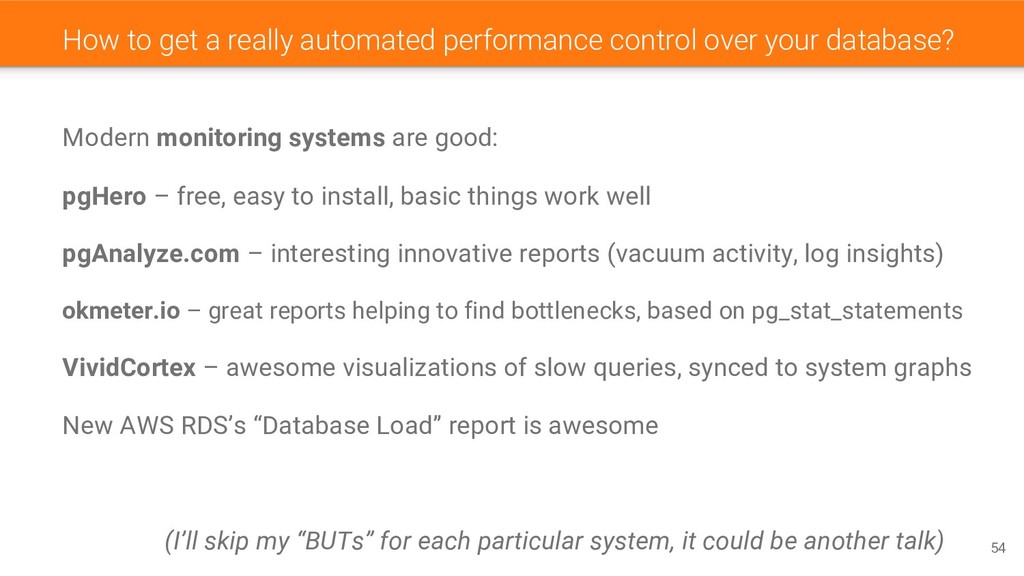
database? Modern monitoring systems are good: pgHero – free, easy to install, basic things work well pgAnalyze.com – interesting innovative reports (vacuum activity, log insights) okmeter.io – great reports helping to find bottlenecks, based on pg_stat_statements VividCortex – awesome visualizations of slow queries, synced to system graphs New AWS RDS’s “Database Load” report is awesome (I’ll skip my “BUTs” for each particular system, it could be another talk) 54
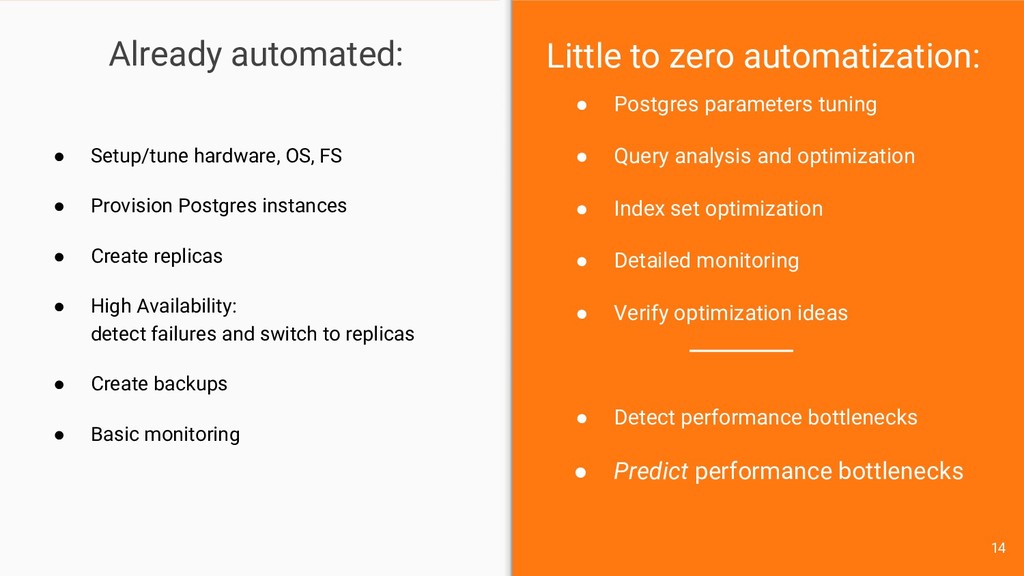
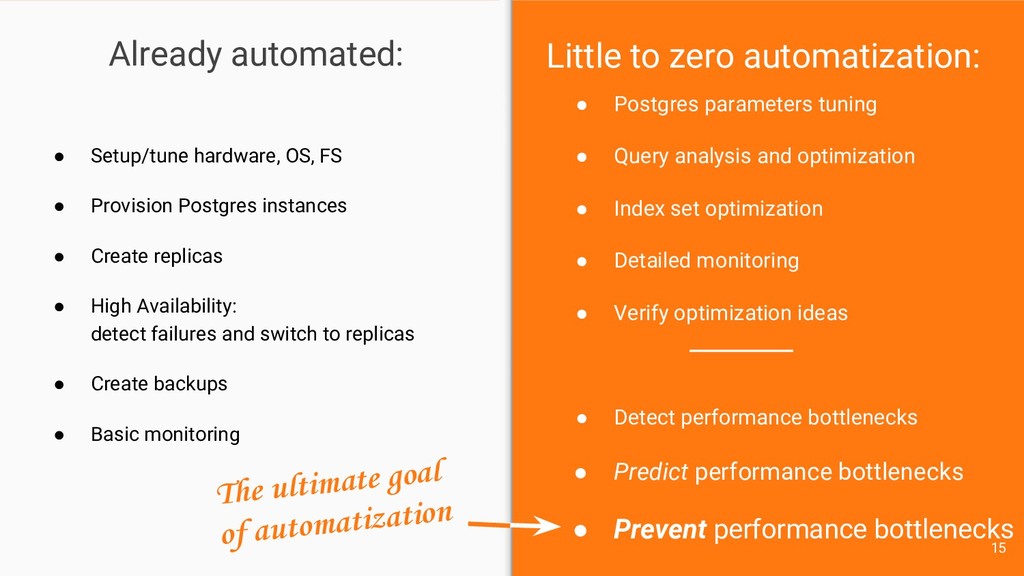
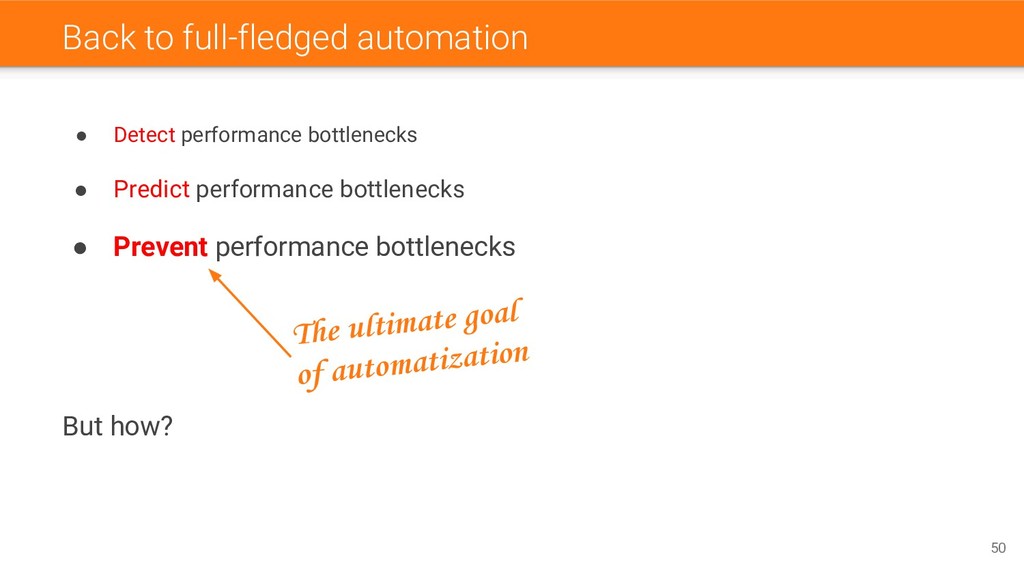
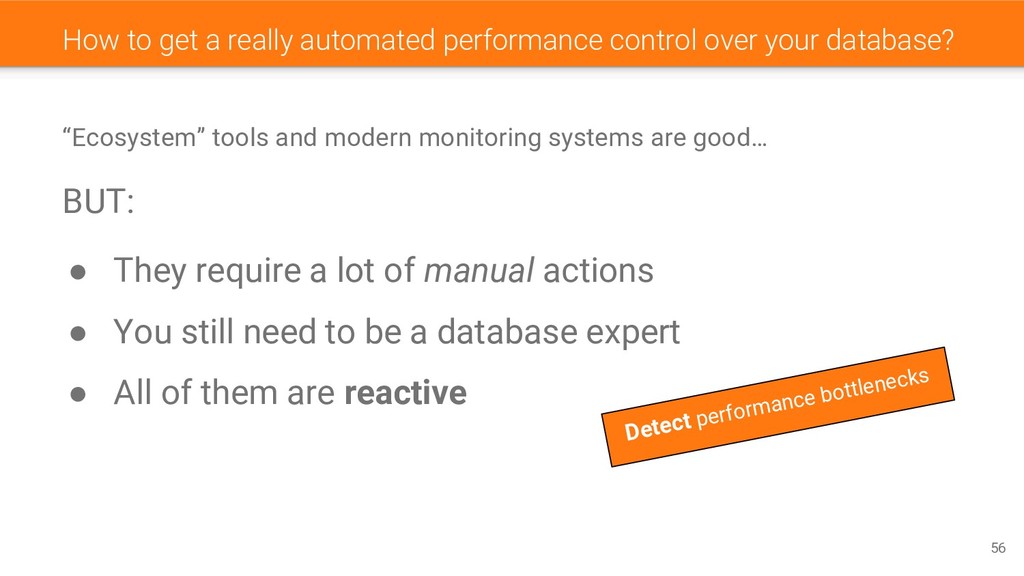
database? “Ecosystem” tools and modern monitoring systems are good… BUT: • They require a lot of manual actions • You still need to be a database expert • All of them are reactive 56 Detect performance bottlenecks
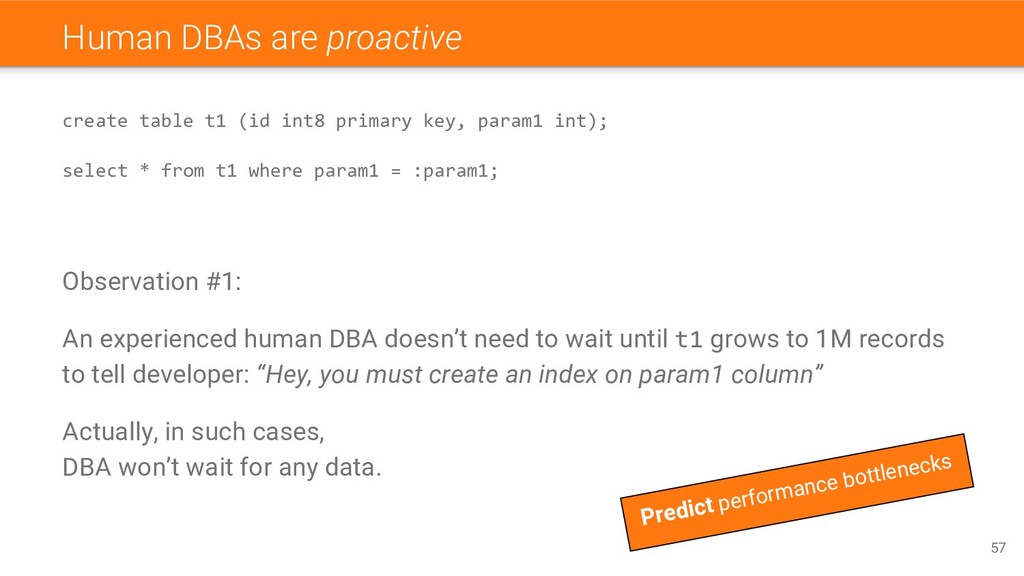
key, param1 int); select * from t1 where param1 = :param1; Observation #1: An experienced human DBA doesn’t need to wait until t1 grows to 1M records to tell developer: “Hey, you must create an index on param1 column” Actually, in such cases, DBA won’t wait for any data. 57 Predict performance bottlenecks
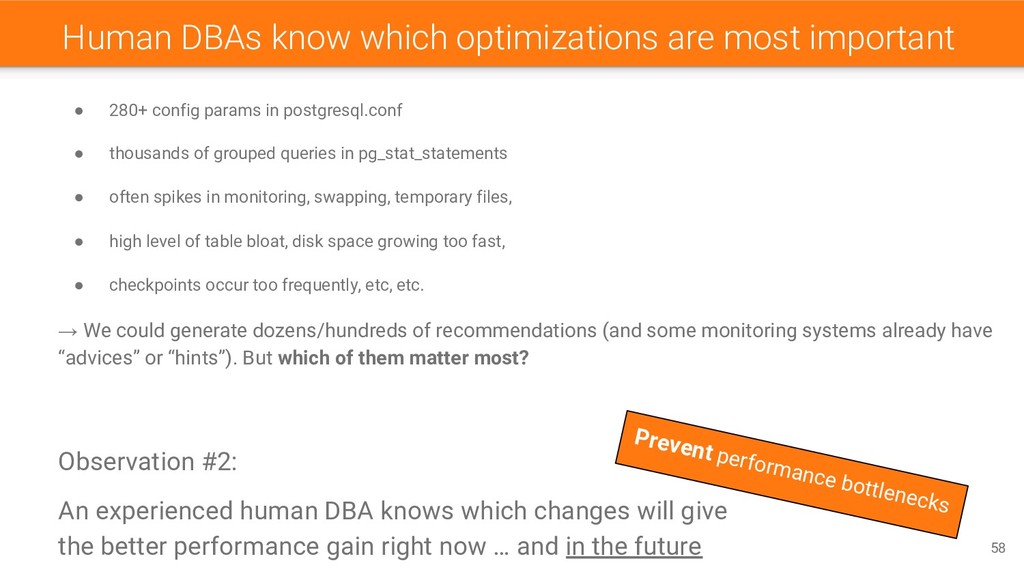
config params in postgresql.conf • thousands of grouped queries in pg_stat_statements • often spikes in monitoring, swapping, temporary files, • high level of table bloat, disk space growing too fast, • checkpoints occur too frequently, etc, etc. → We could generate dozens/hundreds of recommendations (and some monitoring systems already have “advices” or “hints”). But which of them matter most? Observation #2: An experienced human DBA knows which changes will give the better performance gain right now … and in the future 58 Prevent performance bottlenecks
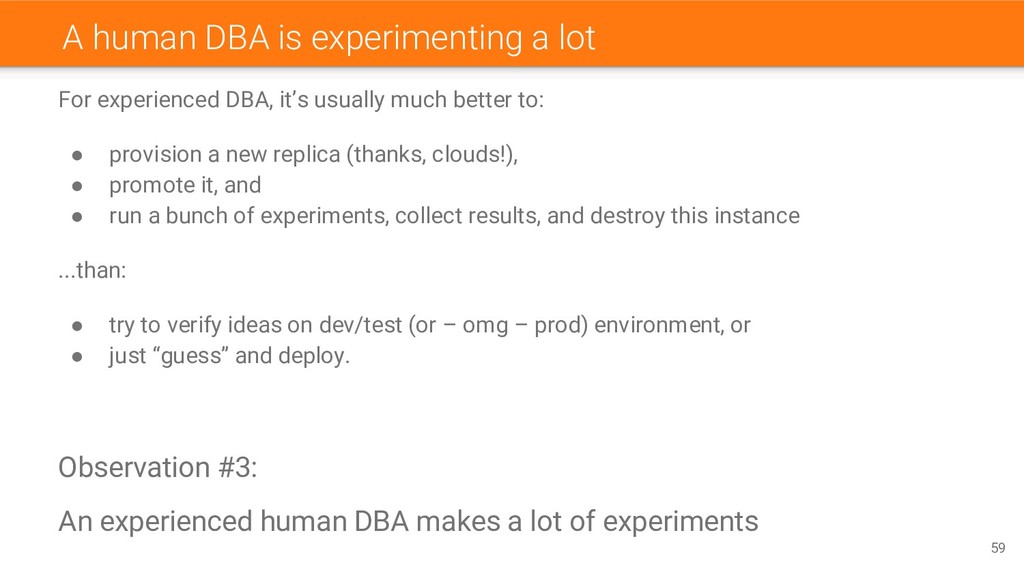
it’s usually much better to: • provision a new replica (thanks, clouds!), • promote it, and • run a bunch of experiments, collect results, and destroy this instance ...than: • try to verify ideas on dev/test (or – omg – prod) environment, or • just “guess” and deploy. Observation #3: An experienced human DBA makes a lot of experiments 59
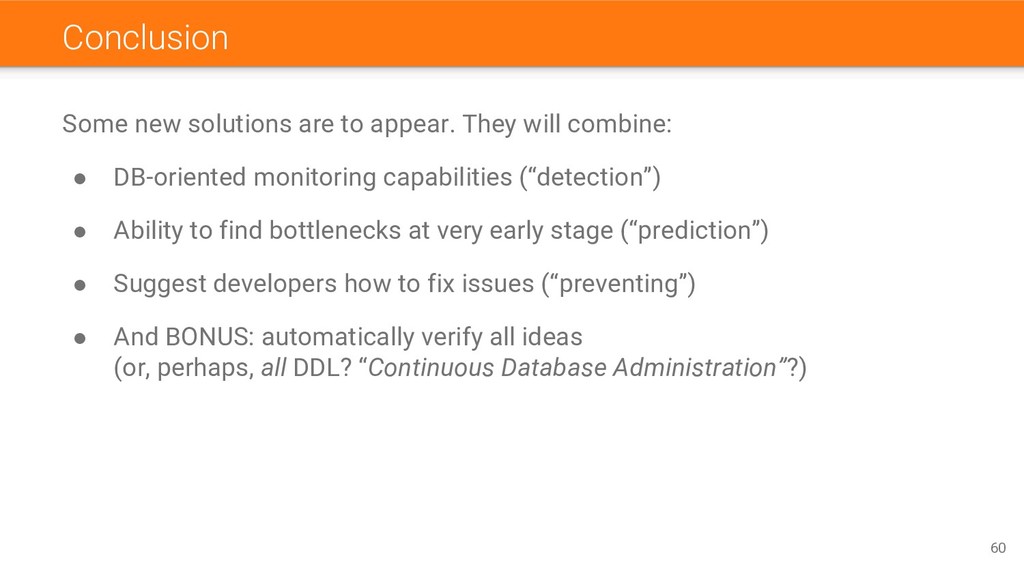
• DB-oriented monitoring capabilities (“detection”) • Ability to find bottlenecks at very early stage (“prediction”) • Suggest developers how to fix issues (“preventing”) • And BONUS: automatically verify all ideas (or, perhaps, all DDL? “Continuous Database Administration”?) 60
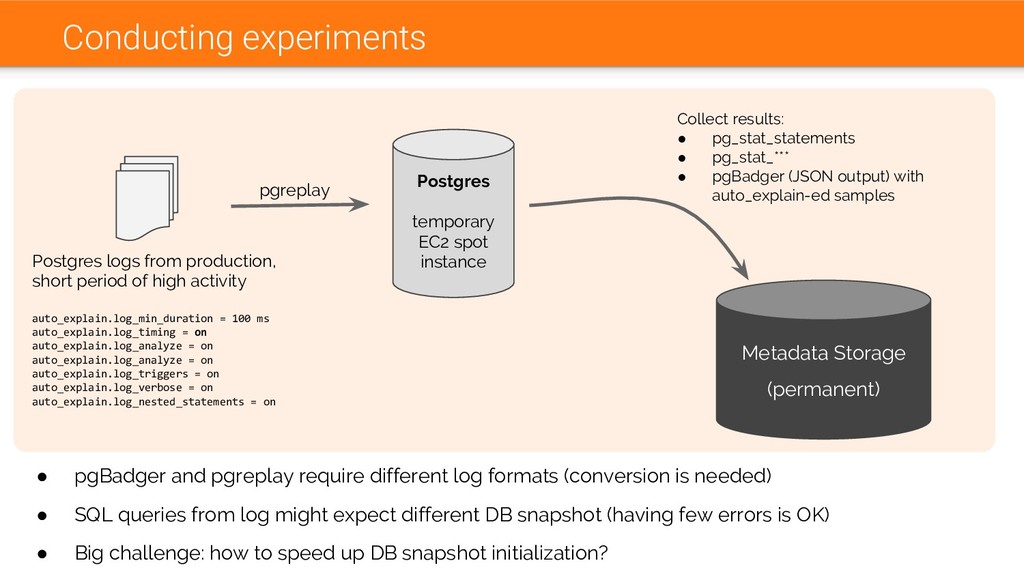
production, short period of high activity auto_explain.log_min_duration = 100 ms auto_explain.log_timing = on auto_explain.log_analyze = on auto_explain.log_analyze = on auto_explain.log_triggers = on auto_explain.log_verbose = on auto_explain.log_nested_statements = on pgreplay Metadata Storage (permanent) Collect results: • pg_stat_statements • pg_stat_*** • pgBadger (JSON output) with auto_explain-ed samples • pgBadger and pgreplay require different log formats (conversion is needed) • SQL queries from log might expect different DB snapshot (having few errors is OK) • Big challenge: how to speed up DB snapshot initialization?
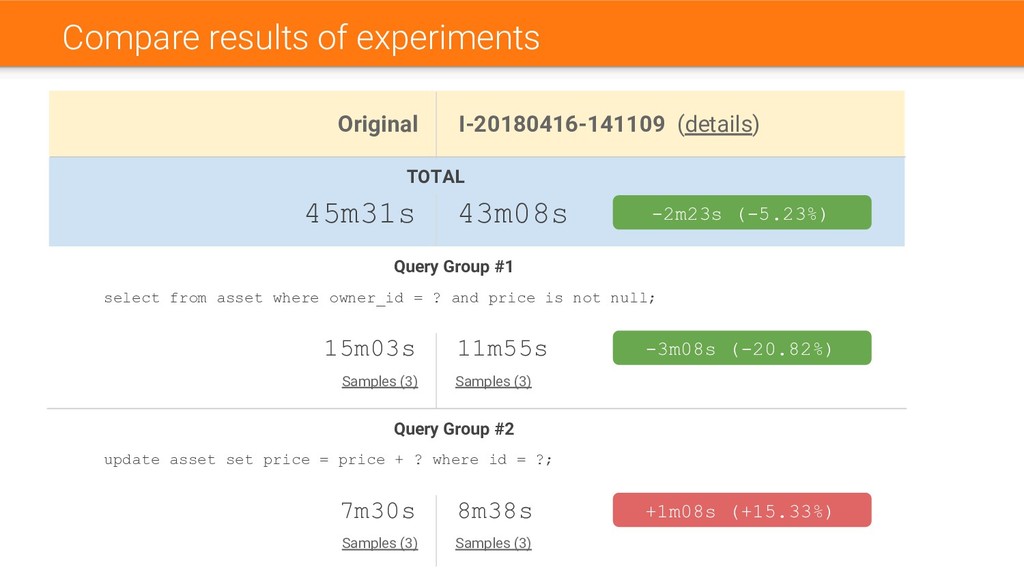
43m08s 45m31s Query Group #1 select from asset where owner_id = ? and price is not null; 11m55s 15m03s -3m08s (-20.82%) Samples (3) Samples (3) Query Group #2 update asset set price = price + ? where id = ?; 8m38s 7m30s +1m08s (+15.33%) Samples (3) Samples (3)
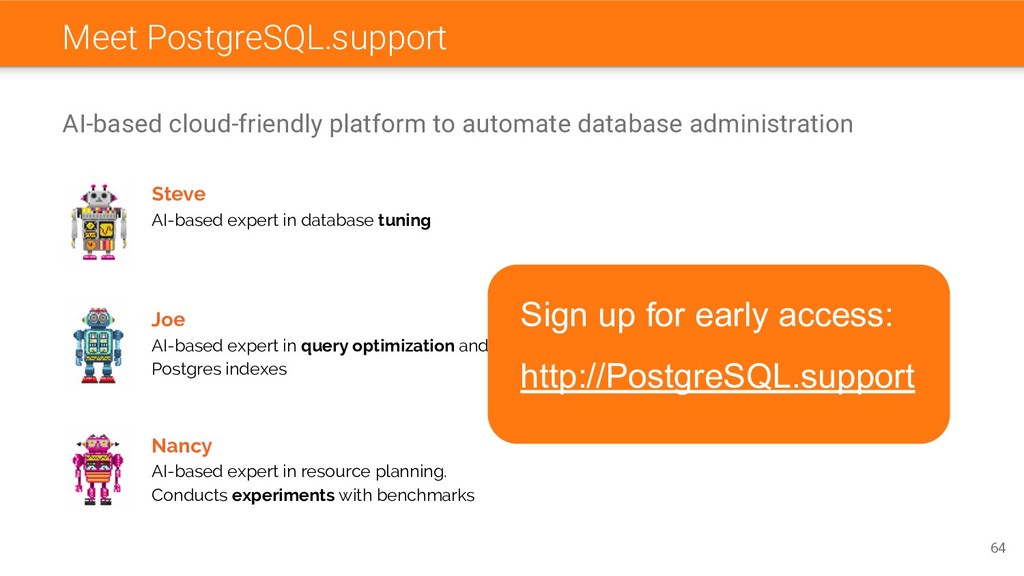
Steve AI-based expert in database tuning Joe AI-based expert in query optimization and Postgres indexes Nancy AI-based expert in resource planning. Conducts experiments with benchmarks Sign up for early access: http://PostgreSQL.support
![Automated DBA Nikolay Samokhvalov twitter: @postgresmen email: [email protected]](https://files.speakerdeck.com/presentations/9e3d920decc84379987513ec8a3d003a/slide_0.jpg)
![Thanks! Nikolay Samokhvalov [email protected] twitter: @postgresmen http://PostgreSQL.support 66](https://files.speakerdeck.com/presentations/9e3d920decc84379987513ec8a3d003a/slide_65.jpg)