Upgrade to Pro — share decks privately, control downloads, hide ads and more …

Six Numbers every Investors Must Know

Soon Lim
April 21, 2014
360

Six Numbers every Investors Must Know

Soon Lim

April 21, 2014
Tweet

Transcript

  1. Example $10,000 1 Jan 2010 1 Jan 2011 $13,000 1

    Jan 2012 $9,500 1 Jan 2013 $14,000 CAGR = 11.87%
  2. COMPOUNDED RETURNS & LIMITS AS PRACTICED BY FAMOUS INVESTORS PETER

    LYNCH – 29% compounded for 13 years WARREN BUFFET – 20.3% compounded for 45 years SIEGEL – 6.7% over 204 years S&P500 – 9.3% compounded for since 1965 U.S. 10-YR BONDS – 3.0% Application – Evaluating Investment Proposal and Claims
  3. 0 1000 2000 3000 4000 2009 2010 2011 2012 Sales

    Net Income Market Cap Source: Bloomberg, Cap IQ, Reuters
  4. Buy or Sell? 3 5 7 9 11 13 15

    17 19 21 PE Ratios Buy? Sell?
  5. P/E EY 1 100% 5 20% 10 10% 15 6.7%

    20 5% 30 3.3% 40 2.5% 50 2% 100 1%
  6. Earnings yield Bond Vs Growth Stock Bonds Stock Coupon/Earnings yield

    5% 5% Investment $100 $100 Year 1 Return $5 $5 Earnings growth 0% 0% Year 10 Return $5 $5 Earnings yield – Year 1 5% 5% Earnings yield – Year 10 5% 5% Implied Stock Price $100 $100
  7. Earnings yield Bond Vs Growth Stock Bonds Stock Coupon/Earnings yield

    5% 5% Investment $100 $100 Year 1 Return $5 $5 Earnings growth 0% 10% Year 10 Return $5 $12.97 Earnings yield – Year 1 5% 5% Earnings yield – Year 10 5% 12.97% Implied Stock Price $100 $259
  8. Earnings Growth, Earnings Yield and PEG Stock 1 Stock 2

    Stock 3 Stock 4 Stock 5 Coupon/ EY 5% 5% 5% 5% 5% Investment $100 $100 $100 $100 $100 Year 1 Return $5 $5 $5 $5 $5 Earnings Growth 0% 5% 10% 15% 20% Year 10 Return $5 $8.14 $12.97 $20.23 $30.96 EY(Year 1) 5% 5% 5% 5% 5% EY(Year 10) 5% 8.1% 13% 20.2% 31% Year 1 P/E NA 20 20 20 20 Year 1 PEG NA 4 2 1.3 1
  9. Interpretatio n Great Good Marginal Avoid PEG 0 - 1

    1 - 2 2 - 3 >3 Source: Bloomberg, Cap IQ, Reuters
  10. Stock Current PE Trailing PE Forward PE PEG Facebook 2619.25

    133.35 52.55 81.85 Google 34.87 30.12 22.55 2.03 Apple 13.52 13.52 12.81 0.82 Microsoft 14.28 13.79 14.01 1.82 Source: Bloomberg, Cap IQ, Reuters
  11. Stock Current PE Trailing PE Forward PE PEG DBS 10.63

    10.64 11.68 1.69 UOB 11.56 11.35 12.28 1.42 OCBC 8.49 12.82 13.03 1.42 Source: Bloomberg, Cap IQ, Reuters
  12. Stock Current PE Trailing PE Forward PE PEG Dairy Farm

    28.53 29.44 24.55 2.57 Nestle 29.47 28.29 27.53 4.33 ST Engineering 20.67 21.63 20.39 3.19 Source: Bloomberg, Cap IQ, Reuters
  13. Net Income ROE = Equity Sales Sales X Net Income

    Sales X Sales Equity X Total Assets Total Assets Decomposing The ROE Net Income Sales X Sales Equity Total Assets Total Assets X
  14. company symbol Price to Book (P/B) Price to Earnings (P/E)

    ROE Net Margin Sales / Assets Assets/Book Dairy Farm International Holdings Limited D01-SG 11.3 30.6 36.7 4.3 2.6 3.3 Carrefour SA CA-FR 2.5 8.5 5.6 0.5 2 5.6 Kroger Co. KR-US 4.5 14.8 32.4 1.6 4 5.1 Whole Foods Market, Inc. WFM-US 5.1 36.4 14.4 4.2 2.4 1.4 Royal Ahold NV AH-NL 2 16.7 10.9 2.2 2.1 2.4 Casino Guichard-Perrachon SA CO-FR 1.3 6.1 20.6 3.4 1.1 5.5 METRO AG MEO-DE 1.6 18.5 9 0.7 2.2 5.8 Jeronimo Martins, SGPS S.A. JMT-PT 5.7 19.9 30.4 3.2 2.4 4.0 Safeway Inc. SWY-US 1.5 2.7 5.2 0.6 2.3 3.8 Wm Morrison Supermarkets plc MRW-GB 0.9 8.5 11.2 3.2 1.7 2.1 Delhaize Group SA DELB-BE 1 N/A -1.3 -0.3 1.9 2.3 Sheng Siong Group Ltd. OV8-SG 5.9 22 26.2 5.5 3 1.6 Tesco PLC TSCO-GB 1.5 N/A 7.6 1.9 1.3 3.1 Big C Supercenter Public Co., Ltd. BIGC-TH 4.1 21.7 20.3 5.5 1.3 2.8
  15. Company Symbol Price to Book (P/B) Price to Earning s

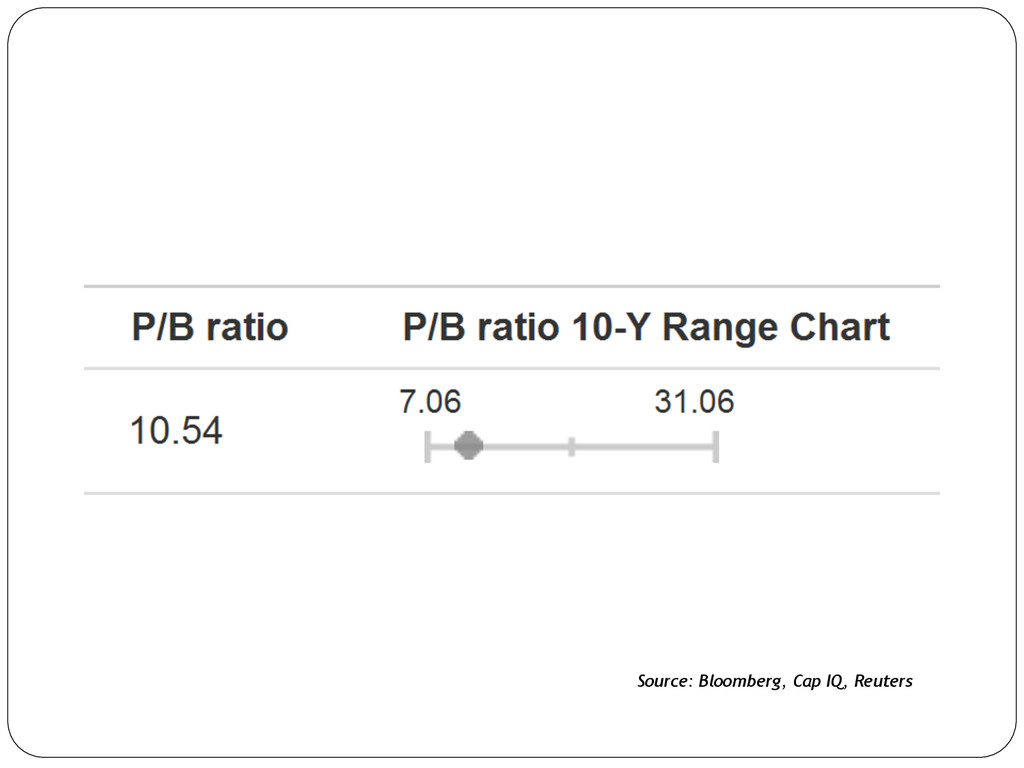
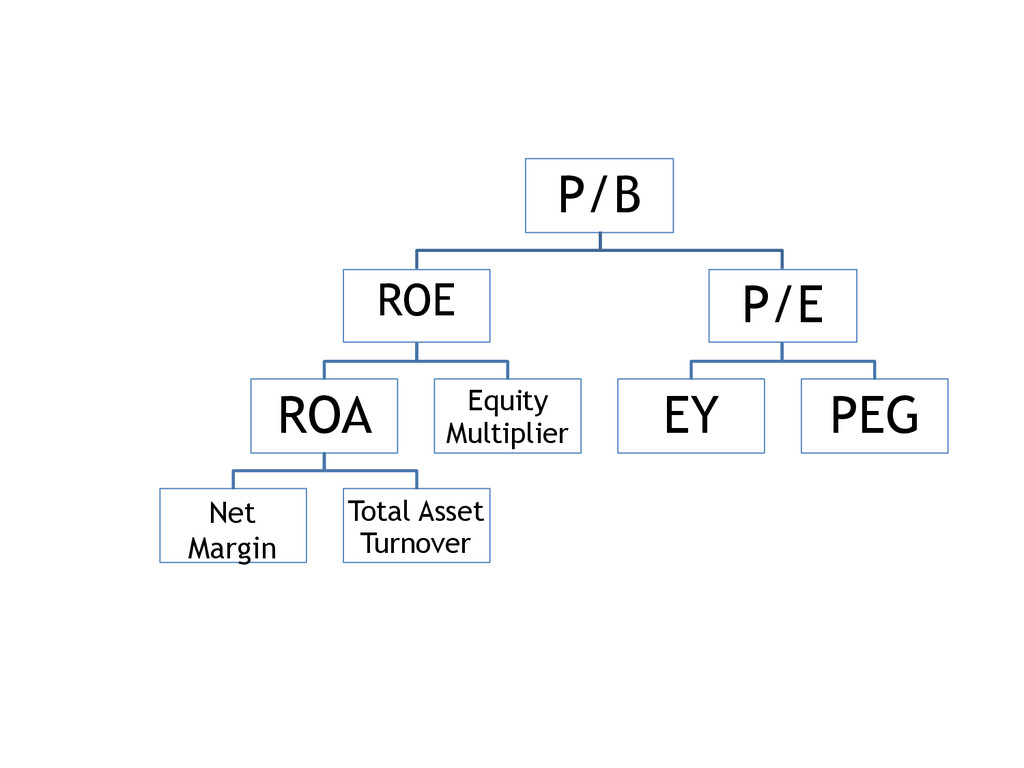
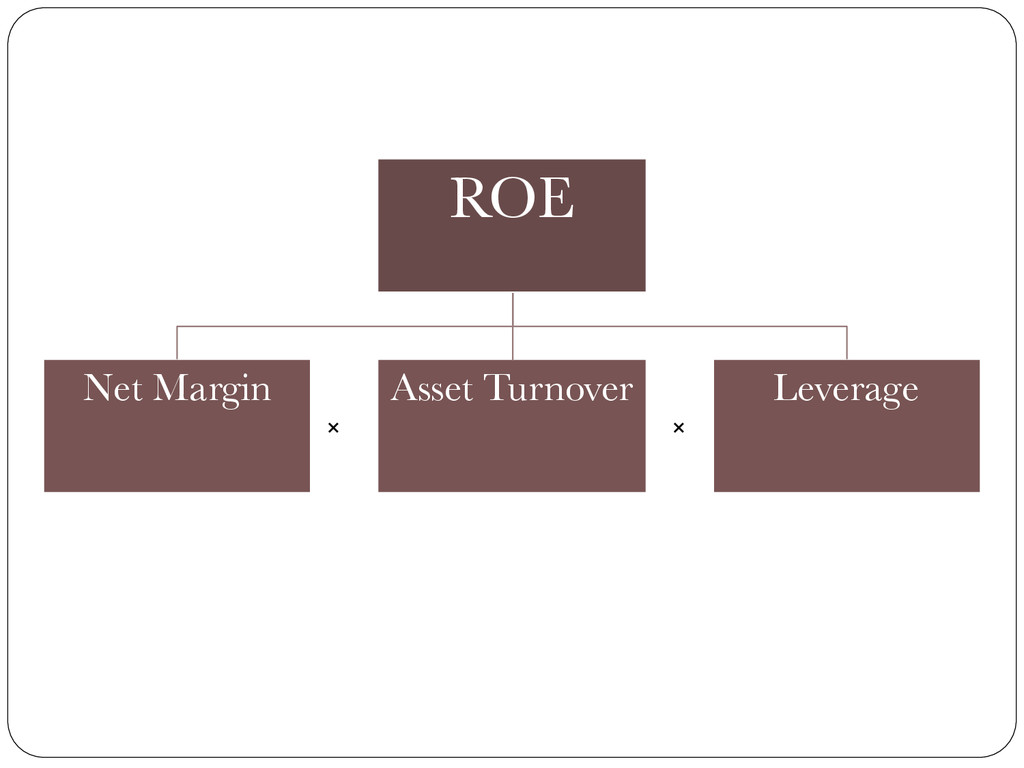
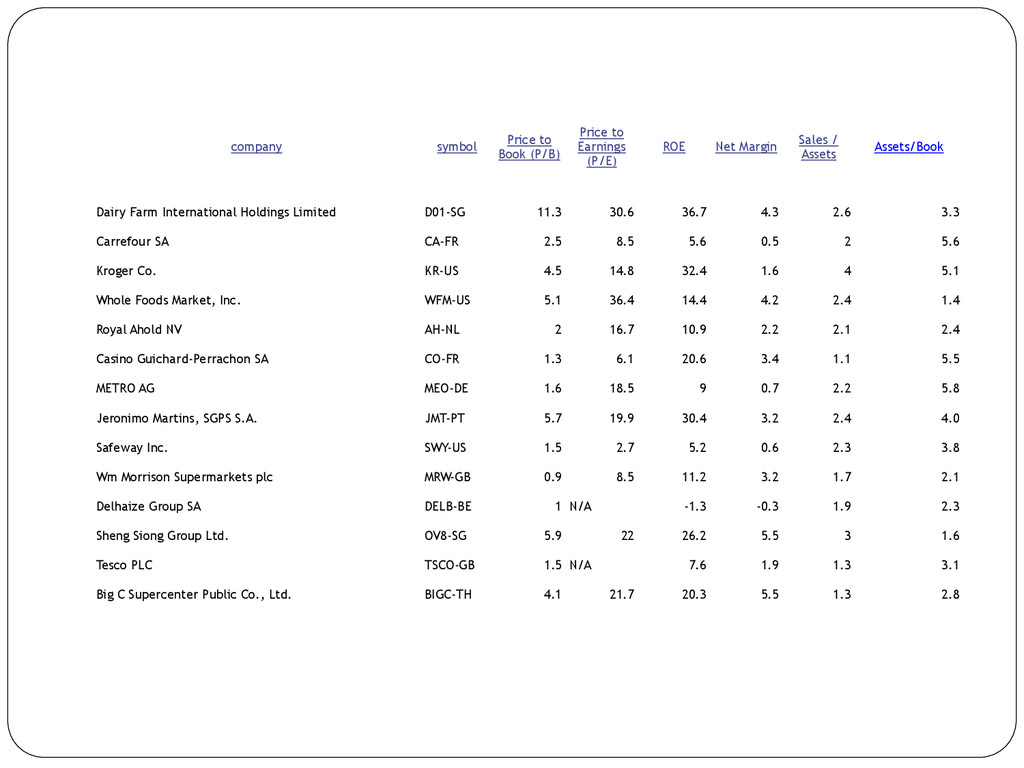
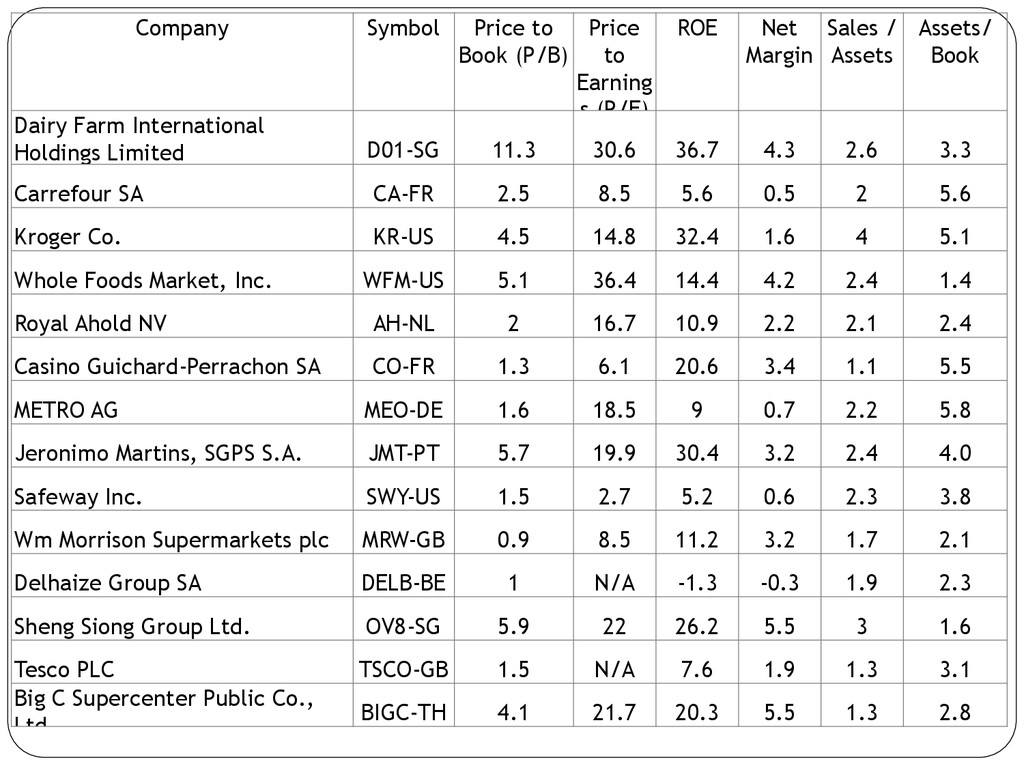
    (P/E) ROE Net Margin Sales / Assets Assets/ Book Dairy Farm International Holdings Limited D01-SG 11.3 30.6 36.7 4.3 2.6 3.3 Carrefour SA CA-FR 2.5 8.5 5.6 0.5 2 5.6 Kroger Co. KR-US 4.5 14.8 32.4 1.6 4 5.1 Whole Foods Market, Inc. WFM-US 5.1 36.4 14.4 4.2 2.4 1.4 Royal Ahold NV AH-NL 2 16.7 10.9 2.2 2.1 2.4 Casino Guichard-Perrachon SA CO-FR 1.3 6.1 20.6 3.4 1.1 5.5 METRO AG MEO-DE 1.6 18.5 9 0.7 2.2 5.8 Jeronimo Martins, SGPS S.A. JMT-PT 5.7 19.9 30.4 3.2 2.4 4.0 Safeway Inc. SWY-US 1.5 2.7 5.2 0.6 2.3 3.8 Wm Morrison Supermarkets plc MRW-GB 0.9 8.5 11.2 3.2 1.7 2.1 Delhaize Group SA DELB-BE 1 N/A -1.3 -0.3 1.9 2.3 Sheng Siong Group Ltd. OV8-SG 5.9 22 26.2 5.5 3 1.6 Tesco PLC TSCO-GB 1.5 N/A 7.6 1.9 1.3 3.1 Big C Supercenter Public Co., Ltd. BIGC-TH 4.1 21.7 20.3 5.5 1.3 2.8
  16. Company Symbol Price to Book (P/B) Price to Earnings (P/E)

    ROE ROA Assets/ Book DBS Group Holdings Ltd D05-SG 1.1 10.8 11.2 1 11.2 Sumitomo Mitsui Financial Group, Inc. 8316 0.8 6.2 13.3 0.6 22.2 Standard Chartered PLC STAN-GB 1 11 9.1 0.7 13.0 Deutsche Bank AG DBK-DE 0.6 N/A -0.9 0 NA Citigroup Inc. C-US 0.7 11 6.7 0.7 9.6 Bank of China Ltd. Class H 3988 0.8 4.6 17.5 1.1 15.9 Oversea-Chinese Banking Corporation Limited O39-SG 1.4 12 11.5 0.9 12.8 United Oversea Bank U11-SG 1.3 6.4 12.1 1.1 11.0