Upgrade to Pro — share decks privately, control downloads, hide ads and more …

The Many Faces of the PE Ratio

Soon Lim
March 12, 2014
400

The Many Faces of the PE Ratio

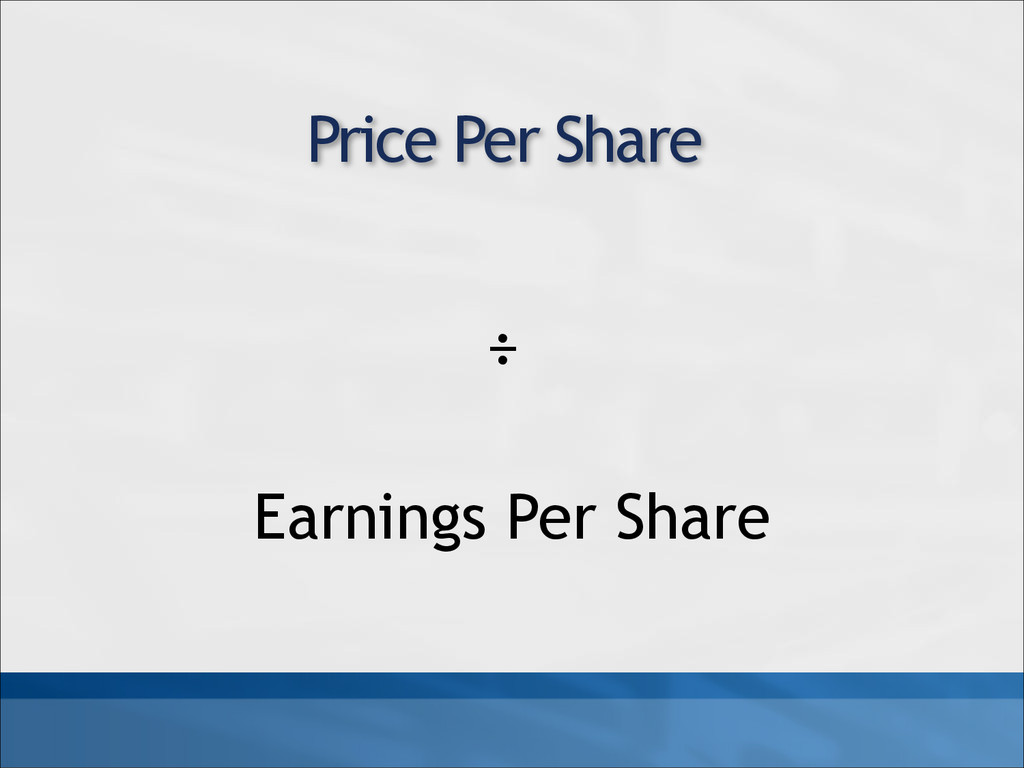
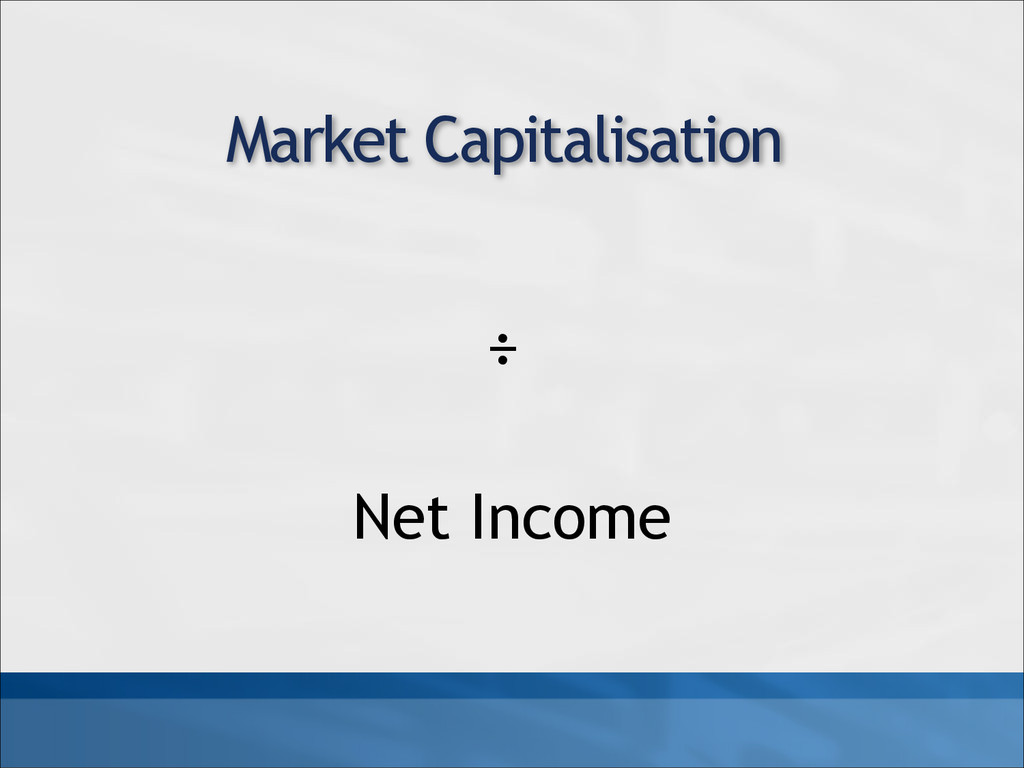
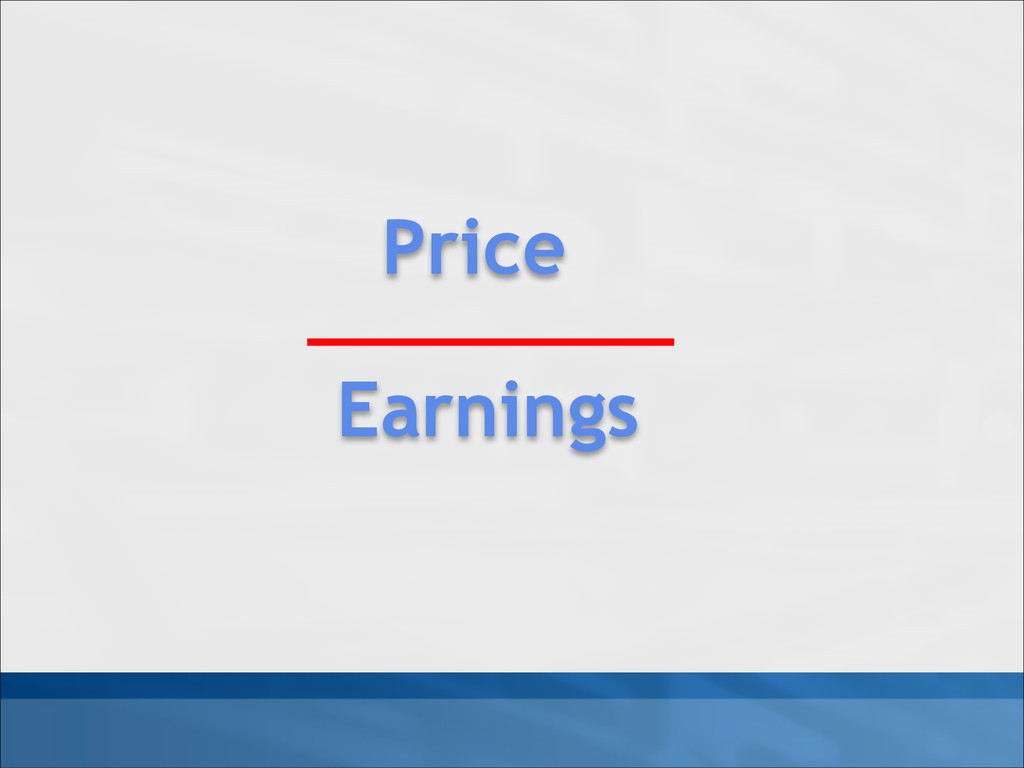
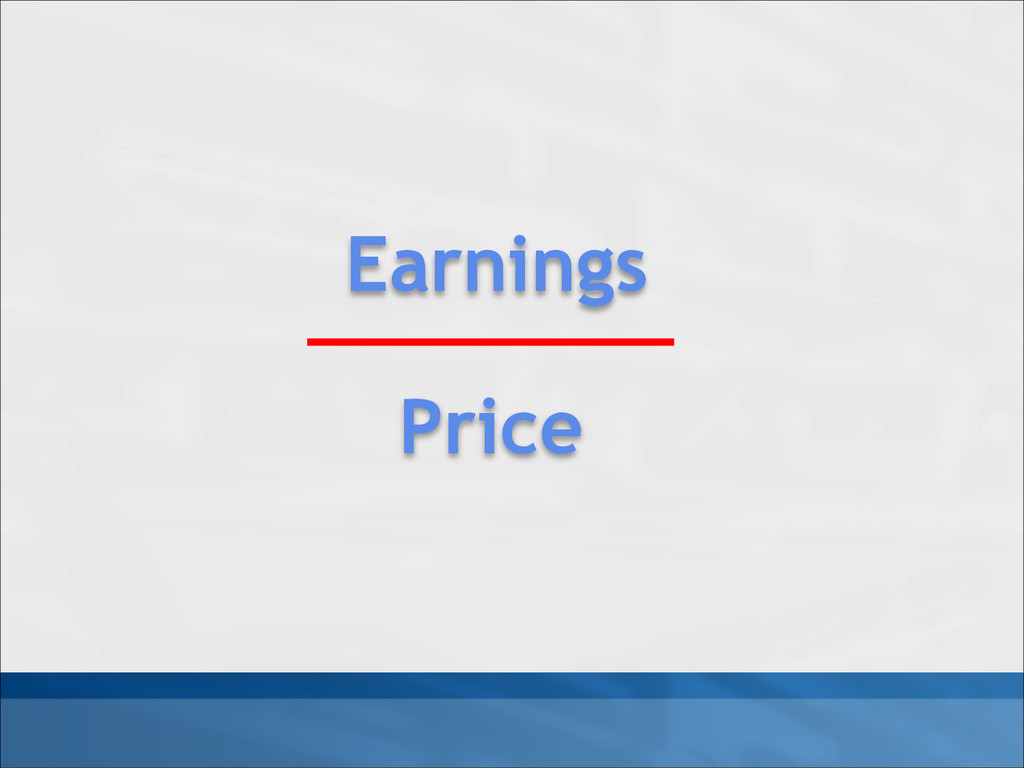
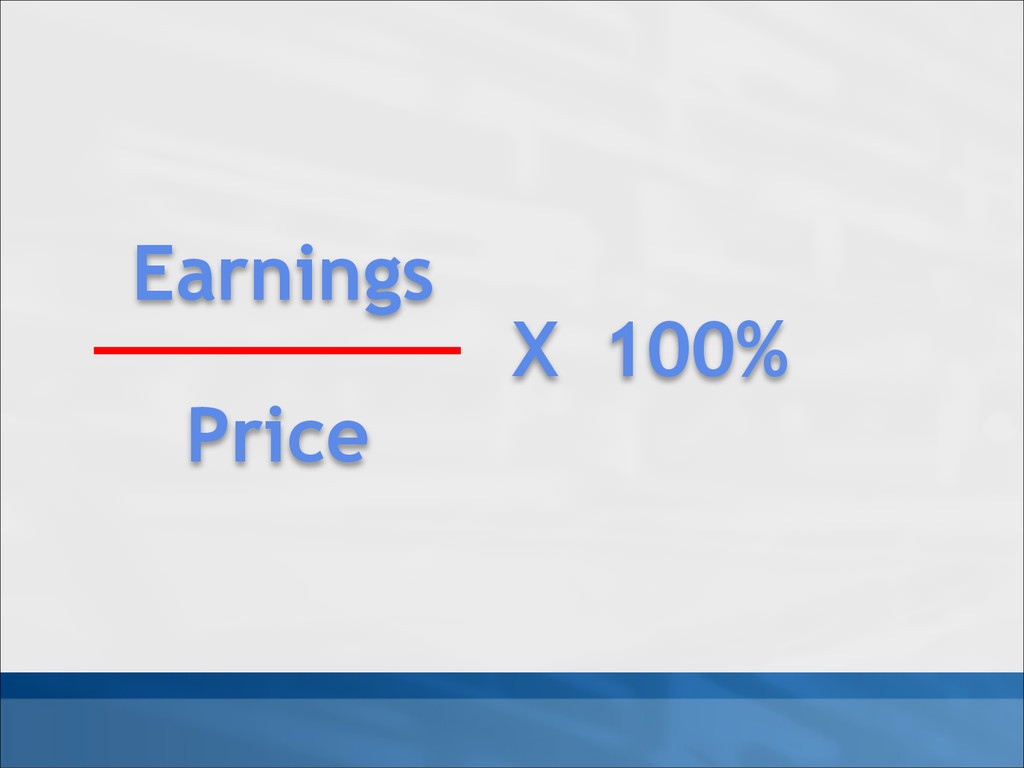
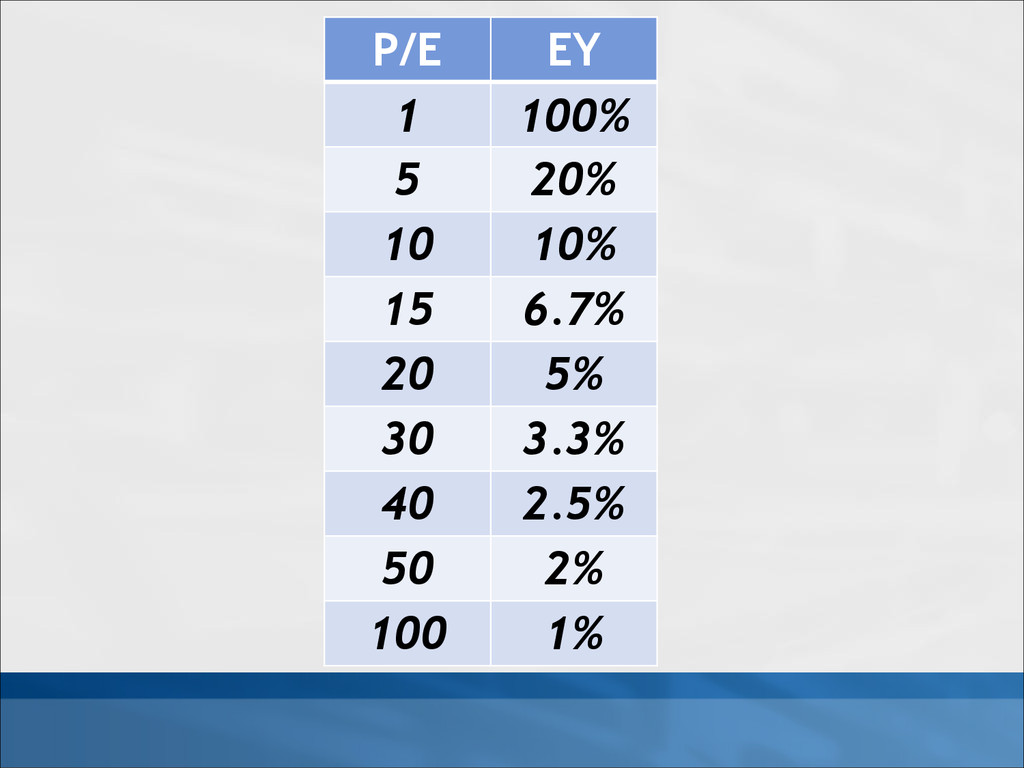
By far, the most popular valuation tool is the price to earnings, or P/E ratio. It’s in every newspaper, Web site, and cocktail party investing discussion. P/E will furnish a cornerstone for this pricing discussion, too, although there’s a lot more to P/E than meets the eye. Once well understood, P/E is one of the major ways that investors make sense of the price tag.
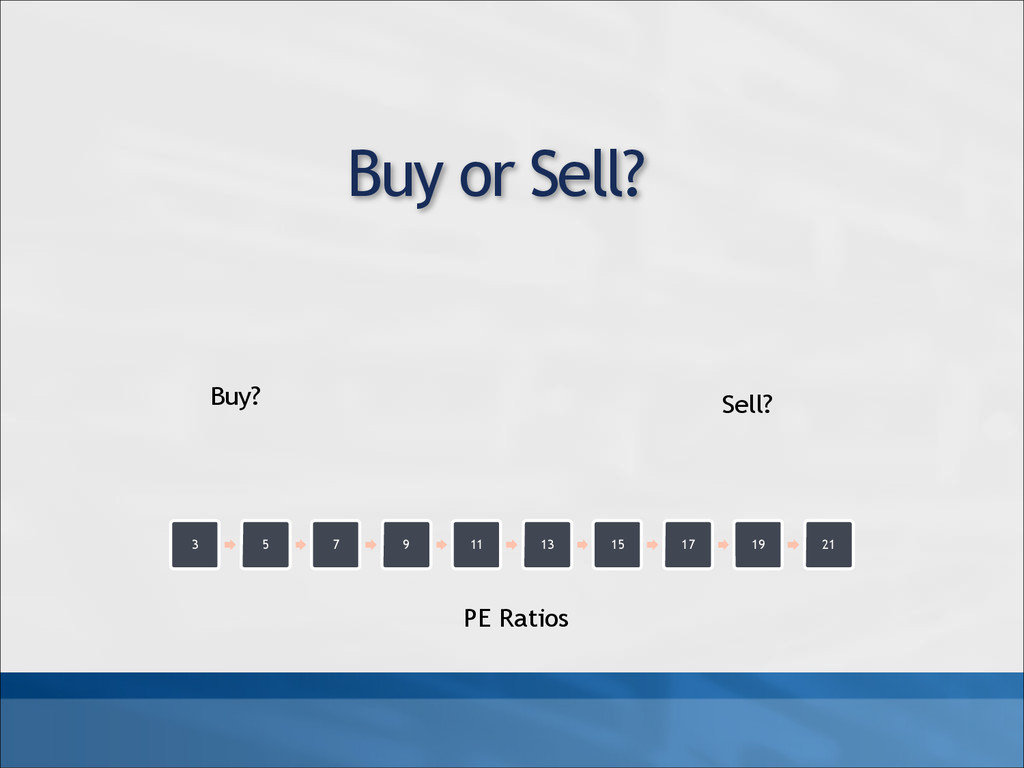
There is no set formula for applying P/E. “If it’s 17 you buy, and if it’s 25 you sell” doesn’t work. A deeper understanding of the P/E and underlying fundamentals is required.
This workshop examines P/E, its components, drivers and alternatives, and how to deploy it to price a business.

Soon Lim

March 12, 2014
Tweet

Transcript

  1. Disclaimer 1) The presentation by the speaker is for information

    purposes only and does not constitute an offer, a solicitation, a recommendation or investment advice by CIMB Securities (Singapore) Pte Ltd to enter or conclude any transactions. 2) The views expressed by Mr Puah Soon Lim (the “External Party”) on the occasion of “The Many Faces of PE” are the personal views and opinions of the External Party (the “External Party’s Views”) and in no way reflect the views, opinions, expressions or representations of CIMB Securities (Singapore) Pte Ltd. CIMB Securities Pte Ltd has no, and will not accept any, obligation to check or ensure (i) the reliability, relevancy or fairness of the External Party’s Views, or (ii) the accuracy or completeness of the External Party’s Views. Without prejudice to or derogating from the generality of the foregoing, no representation or assurance is given by CIMB Securities (Singapore) Pte Ltd that the External Party’s Views contain all information that an investor may require. To the extent permitted by applicable law, CIMB Securities (Singapore) Pte Ltd, or any of its affiliates, or its related persons (and their respective directors, associates, connected persons and/or employees) shall not be liable in any manner whatsoever for any consequences (including but not limited to any direct, indirect or consequential losses, loss of profits and damages) arising from the reliance or use of the External Party’s Views Investors are advised to make their own independent evaluation of the External Party’s Views, consider their own individual investment objectives, financial situation and particular needs and consult their own professional and financial advisers as to the legal, business, financial, tax and other aspects as investors may regard as relevant.
  2. Buy or Sell? 3 5 7 9 11 13 15

    17 19 21 PE Ratios Buy? Sell?
  3. P/E EY 1 100% 5 20% 10 10% 15 6.7%

    20 5% 30 3.3% 40 2.5% 50 2% 100 1%
  4. Earnings yield Bond Vs Growth Stock Bonds Stock Coupon/Earnings yield

    5% 5% Investment $100 $100 Year 1 Return $5 $5 Earnings growth 0% 0% Year 10 Return $5 $5 Earnings yield – Year 1 5% 5% Earnings yield – Year 10 5% 5% Implied Stock Price $100 $100
  5. Earnings yield Bond Vs Growth Stock Bonds Stock Coupon/Earnings yield

    5% 5% Investment $100 $100 Year 1 Return $5 $5 Earnings growth 0% 10% Year 10 Return $5 $5 Earnings yield – Year 1 5% 5% Earnings yield – Year 10 5% 12.97% Implied Stock Price $100 $259
  6. Earnings Growth, Earnings Yield and PEG Stock 1 Stock 2

    Stock 3 Stock 4 Stock 5 Coupon/ EY 5% 5% 5% 5% 5% Investment $100 $100 $100 $100 $100 Year 1 Return $5 $5 $5 $5 $5 Earnings Growth 0% 5% 10% 15% 20% Year 10 Return $5 $8.14 $12.97 $20.23 $30.96 EY(Year 1) 5% 5% 5% 5% 5% EY(Year 10) 5% 8.1% 13% 20.2% 31% Year 1 P/E NA 20 20 20 20 Year 1 PEG NA 4 2 1.3 1
  7. Stock Current PE Trailing PE Forward PE PEG Facebook 2619.25

    133.35 52.55 81.85 Google 34.87 30.12 22.55 2.03 Apple 13.52 13.52 12.81 0.82 Source: Bloomberg, Cap IQ
  8. Stock Current PE Trailing PE Forward PE PEG DBS 10.63

    10.64 11.68 1.69 UOB 11.56 11.35 12.28 1.42 OCBC 8.49 12.82 13.03 1.42 Source: Bloomberg, Cap IQ
  9. Stock Current PE Trailing PE Forward PE PEG Dairy Farm

    28.53 29.44 24.55 2.57 Nestle 29.47 28.29 27.53 4.33 ST Engineering 20.67 21.63 20.39 3.19 Source: Bloomberg, Cap IQ
  10. Other PE that you will come across Median P/E –

    Median Statistical P/E over the last 10 years Relative P/E – a Value Line measure of 1,700 stocks in US Average Annual P/E – uses average price for the year
  11. FREQUENTLY ASKED QUESTION IS IT A GOOD STOCK? IS IT

    THE RIGHT 
 TIME? CAN BUY OR NOT?
  12. You have to understand accounting and you have to understand

    the nuances of accounting. It’s the language of business and it’s an imperfect language, but unless you are willing to put in the effort to learn accounting – how to read and interpret financial statements – you really shouldn’t select stocks yourself” – Warren Buffett