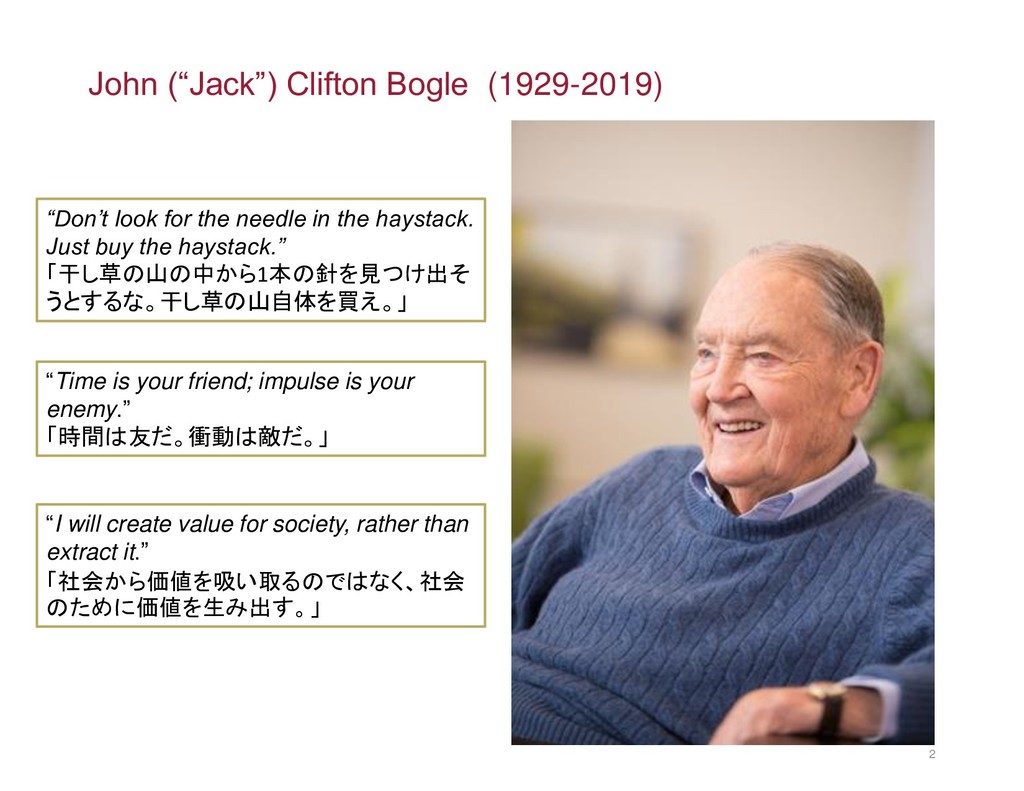
impulse is your enemy.” 「時間は友だ。衝動は敵だ。」 “Don’t look for the needle in the haystack. Just buy the haystack.” 「干し草の山の中から1本の針を見つけ出そ うとするな。干し草の山自体を買え。」 “I will create value for society, rather than extract it.” 「社会から価値を吸い取るのではなく、社会 のために価値を生み出す。」
2000 Index domestic equity mutual funds Index domestic equity ETFs Actively managed domestic equity mutual funds Active funds to Index funds and ETFs Source: Investment Company Instituite
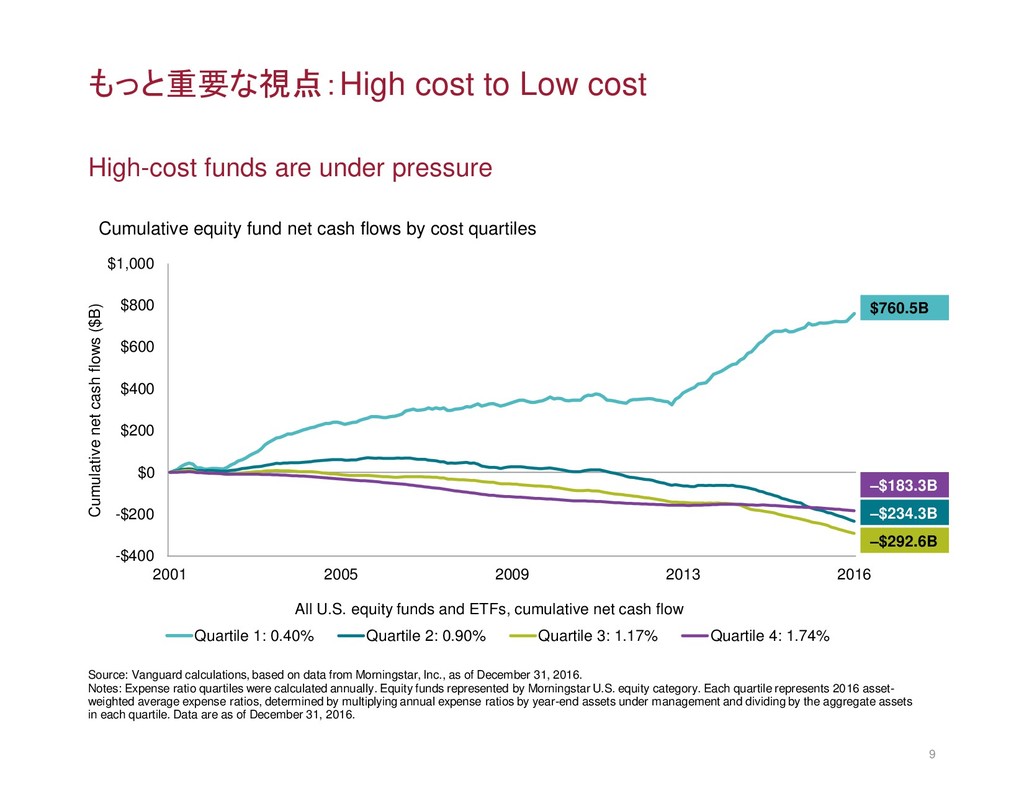
pressure -$400 -$200 $0 $200 $400 $600 $800 $1,000 2001 2005 2009 2013 2016 Cumulative net cash flows ($B) All U.S. equity funds and ETFs, cumulative net cash flow Quartile 1: 0.40% Quartile 2: 0.90% Quartile 3: 1.17% Quartile 4: 1.74% $760.5B –$183.3B –$234.3B –$292.6B Cumulative equity fund net cash flows by cost quartiles Source: Vanguard calculations, based on data from Morningstar, Inc., as of December 31, 2016. Notes: Expense ratio quartiles were calculated annually. Equity funds represented by Morningstar U.S. equity category. Each quartile represents 2016 asset- weighted average expense ratios, determined by multiplying annual expense ratios by year-end assets under management and dividing by the aggregate assets in each quartile. Data are as of December 31, 2016.
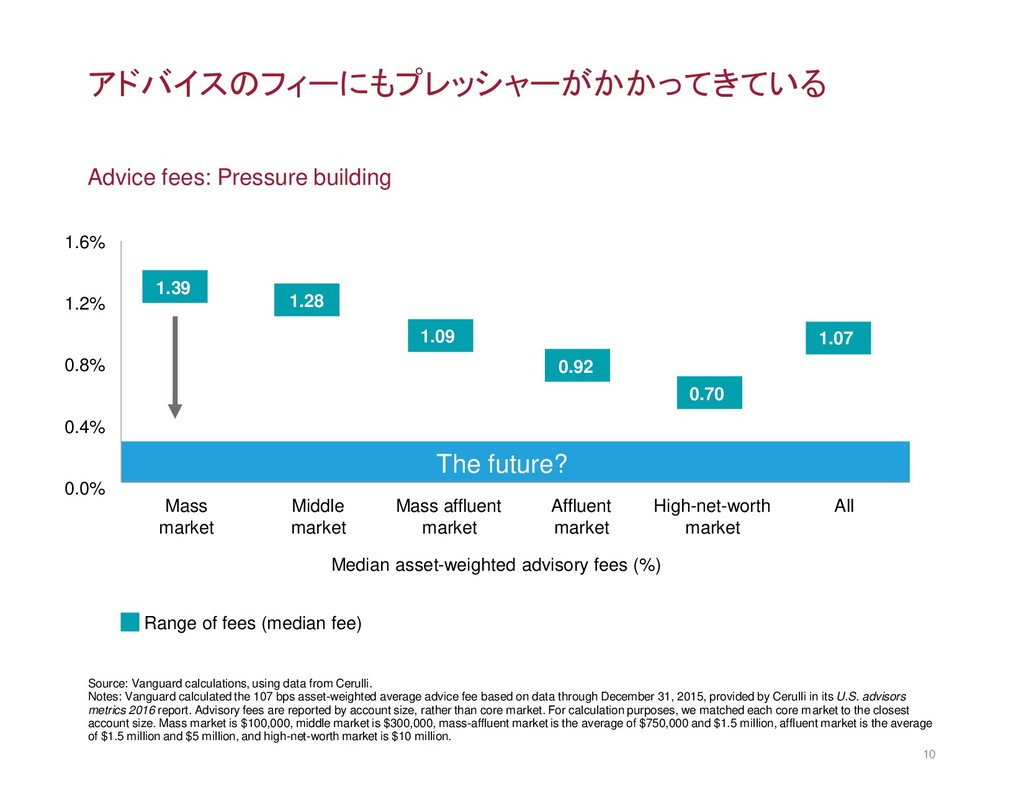
0.8% 0.4% 0.0% The future? Source: Vanguard calculations, using data from Cerulli. Notes: Vanguard calculated the 107 bps asset-weighted average advice fee based on data through December 31, 2015, provided by Cerulli in its U.S. advisors metrics 2016 report. Advisory fees are reported by account size, rather than core market. For calculation purposes, we matched each core market to the closest account size. Mass market is $100,000, middle market is $300,000, mass-affluent market is the average of $750,000 and $1.5 million, affluent market is the average of $1.5 million and $5 million, and high-net-worth market is $10 million. Mass Middle Mass affluent Affluent High-net-worth All market market market market market Median asset-weighted advisory fees (%) Range of fees (median fee) Advice fees: Pressure building
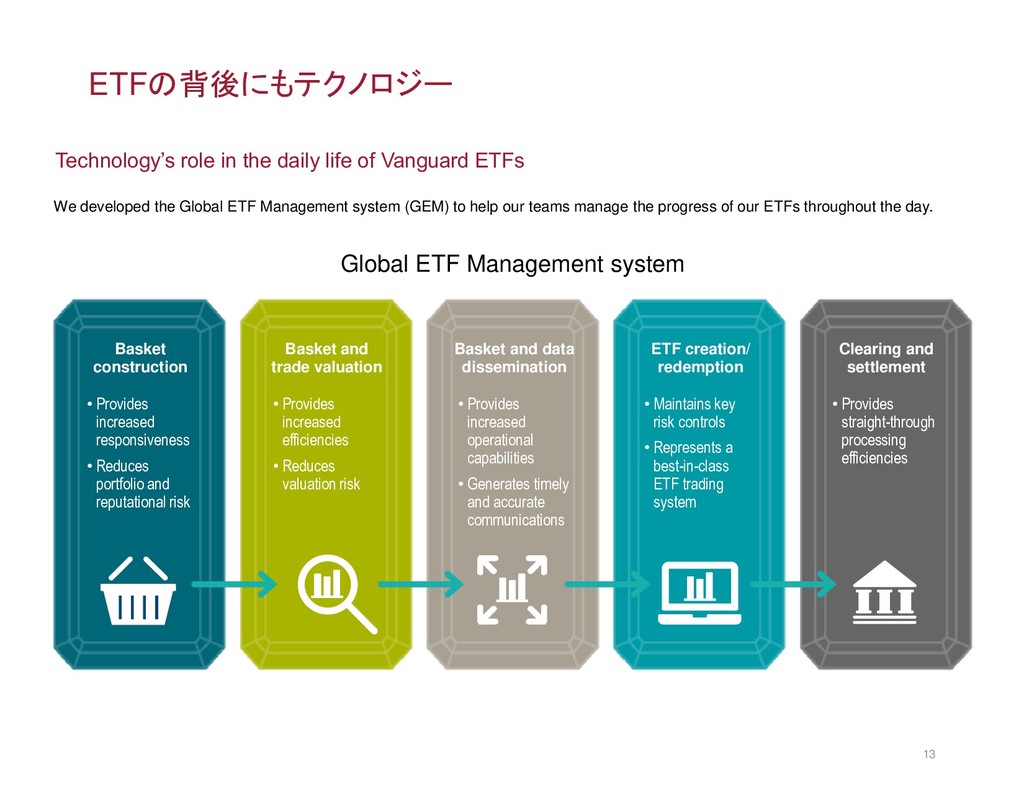
life of Vanguard ETFs • Provides increased responsiveness • Reduces portfolio and reputational risk • Provides increased efficiencies • Reduces valuation risk • Provides increased operational capabilities • Generates timely and accurate communications • Maintains key risk controls • Represents a best-in-class ETF trading system • Provides straight-through processing efficiencies We developed the Global ETF Management system (GEM) to help our teams manage the progress of our ETFs throughout the day. Basket construction Basket and trade valuation Basket and data dissemination ETF creation/ redemption Clearing and settlement ETFの背後にもテクノロジー
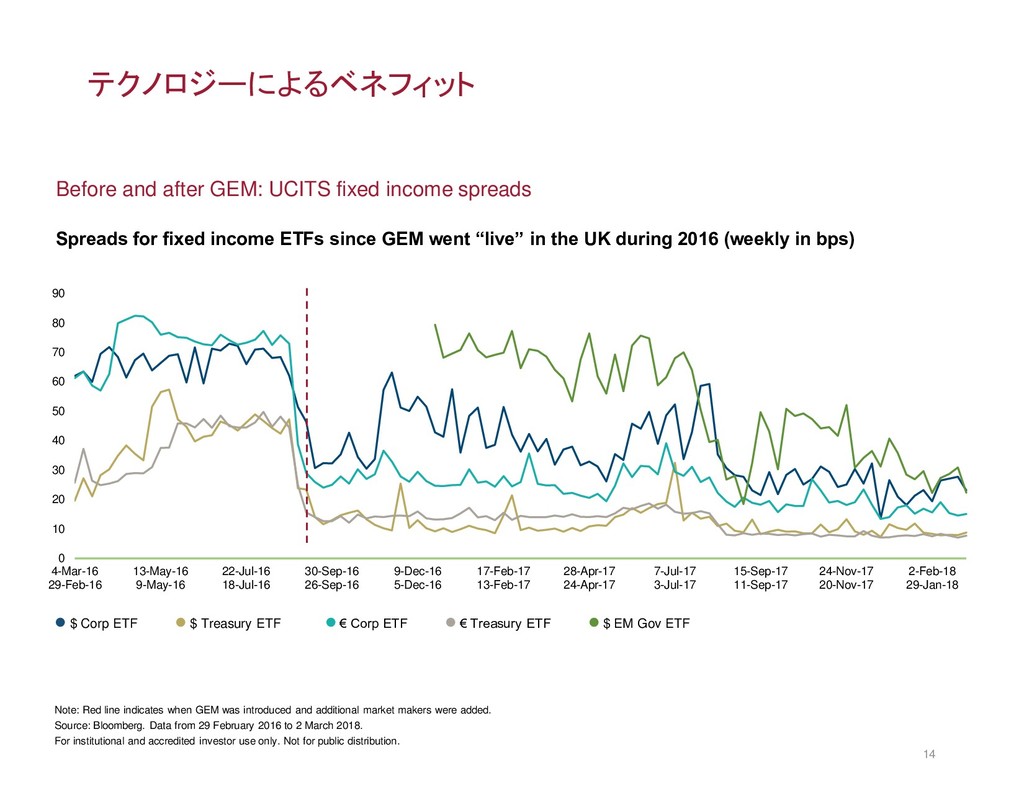
90 4-Mar-16 29-Feb-16 13-May-16 9-May-16 22-Jul-16 18-Jul-16 30-Sep-16 26-Sep-16 9-Dec-16 5-Dec-16 17-Feb-17 13-Feb-17 28-Apr-17 24-Apr-17 7-Jul-17 3-Jul-17 15-Sep-17 11-Sep-17 24-Nov-17 20-Nov-17 2-Feb-18 29-Jan-18 $ Corp ETF $ Treasury ETF € Corp ETF € Treasury ETF $ EM Gov ETF Before and after GEM: UCITS fixed income spreads Note: Red line indicates when GEM was introduced and additional market makers were added. Source: Bloomberg. Data from 29 February 2016 to 2 March 2018. For institutional and accredited investor use only. Not for public distribution. Spreads for fixed income ETFs since GEM went “live” in the UK during 2016 (weekly in bps) l $ Corp ETF l $ Treasury ETF l € Corp ETF l € Treasury ETF l $ EM Gov ETF テクノロジーによるベネフィット
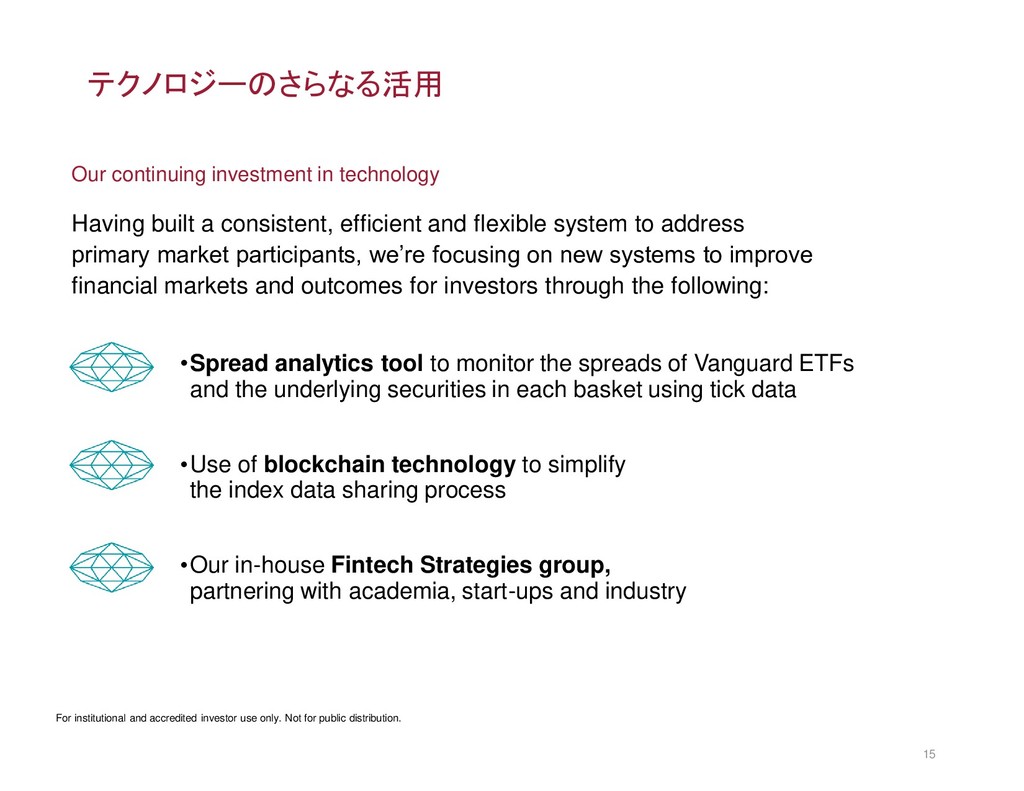
efficient and flexible system to address primary market participants, we’re focusing on new systems to improve financial markets and outcomes for investors through the following: •Spread analytics tool to monitor the spreads of Vanguard ETFs and the underlying securities in each basket using tick data •Use of blockchain technology to simplify the index data sharing process •Our in-house Fintech Strategies group, partnering with academia, start-ups and industry For institutional and accredited investor use only. Not for public distribution. テクノロジーのさらなる活用
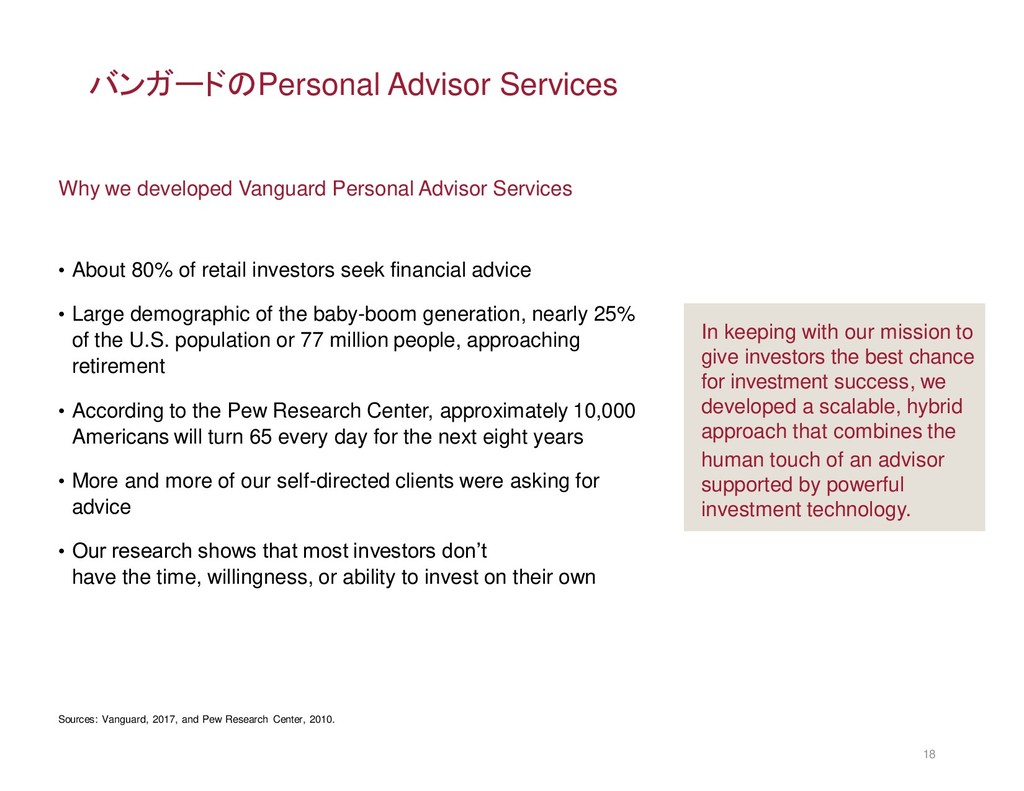
80% of retail investors seek financial advice • Large demographic of the baby-boom generation, nearly 25% of the U.S. population or 77 million people, approaching retirement • According to the Pew Research Center, approximately 10,000 Americans will turn 65 every day for the next eight years • More and more of our self-directed clients were asking for advice • Our research shows that most investors don’t have the time, willingness, or ability to invest on their own Sources: Vanguard, 2017, and Pew Research Center, 2010. In keeping with our mission to give investors the best chance for investment success, we developed a scalable, hybrid approach that combines the human touch of an advisor supported by powerful investment technology. バンガードのPersonal Advisor Services
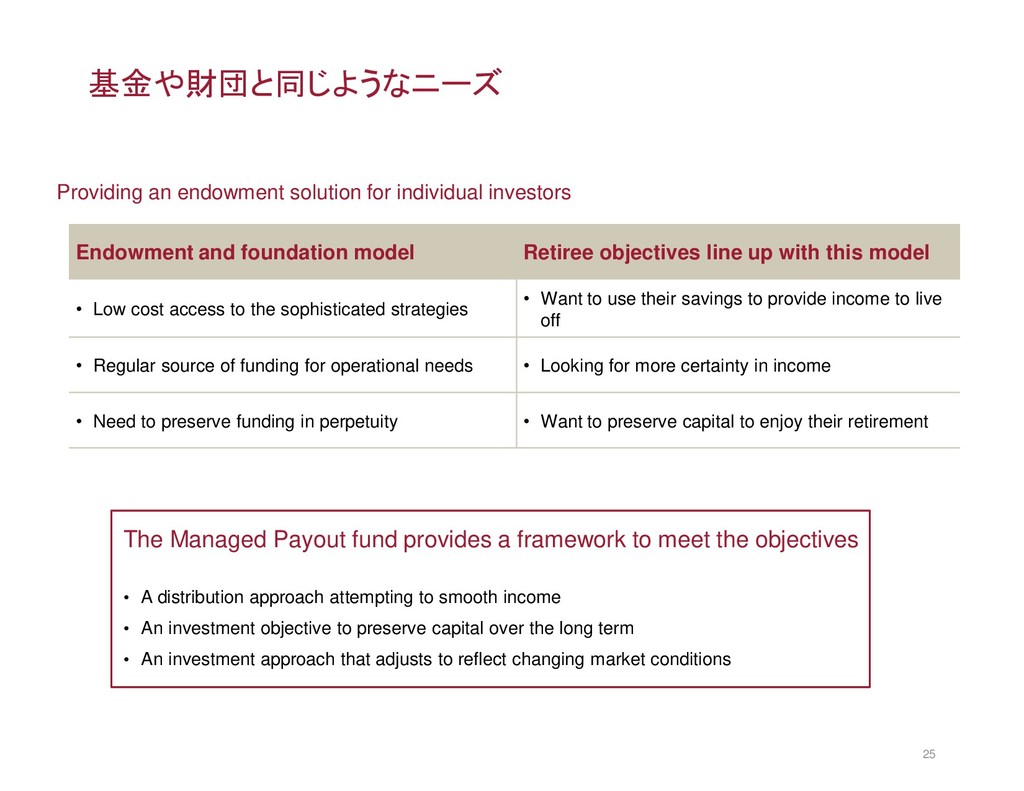
Payout fund provides a framework to meet the objectives • A distribution approach attempting to smooth income • An investment objective to preserve capital over the long term • An investment approach that adjusts to reflect changing market conditions Endowment and foundation model Retiree objectives line up with this model • Low cost access to the sophisticated strategies • Want to use their savings to provide income to live off • Regular source of funding for operational needs • Looking for more certainty in income • Need to preserve funding in perpetuity • Want to preserve capital to enjoy their retirement 基金や財団と同じようなニーズ
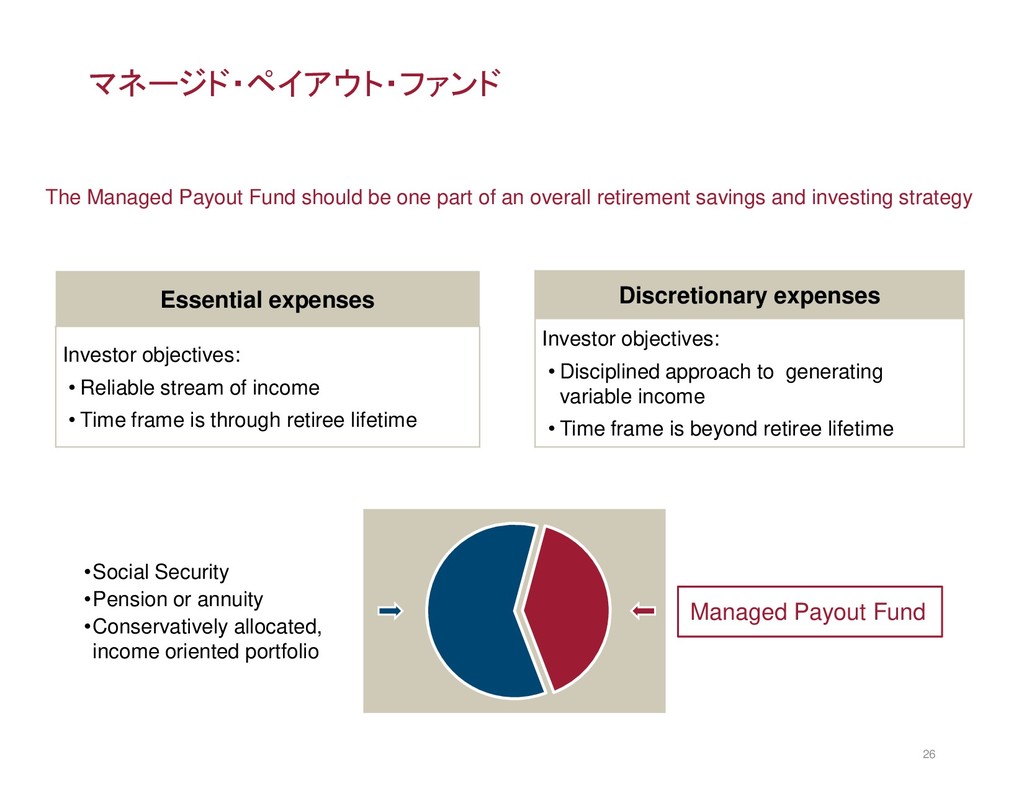
an overall retirement savings and investing strategy Essential expenses Investor objectives: • Reliable stream of income • Time frame is through retiree lifetime Discretionary expenses Investor objectives: • Disciplined approach to generating variable income • Time frame is beyond retiree lifetime •Social Security •Pension or annuity •Conservatively allocated, income oriented portfolio Managed Payout Fund マネージド・ペイアウト・ファンド
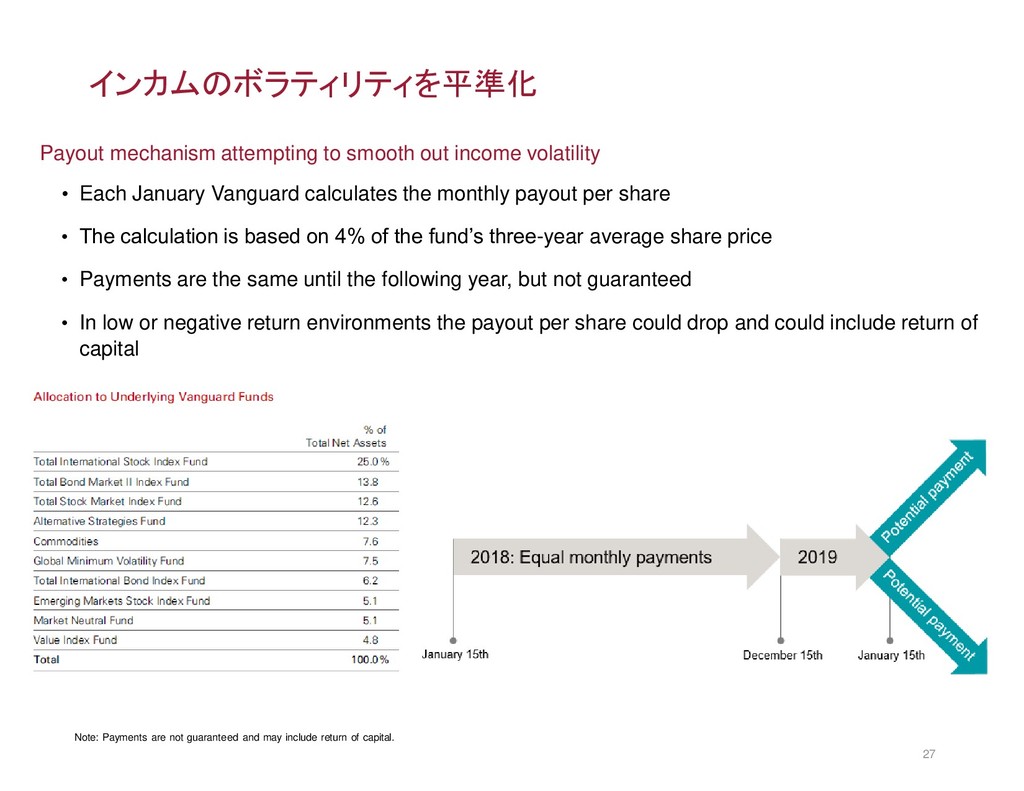
share • The calculation is based on 4% of the fund’s three-year average share price • Payments are the same until the following year, but not guaranteed • In low or negative return environments the payout per share could drop and could include return of capital Note: Payments are not guaranteed and may include return of capital. Payout mechanism attempting to smooth out income volatility インカムのボラティリティを平準化
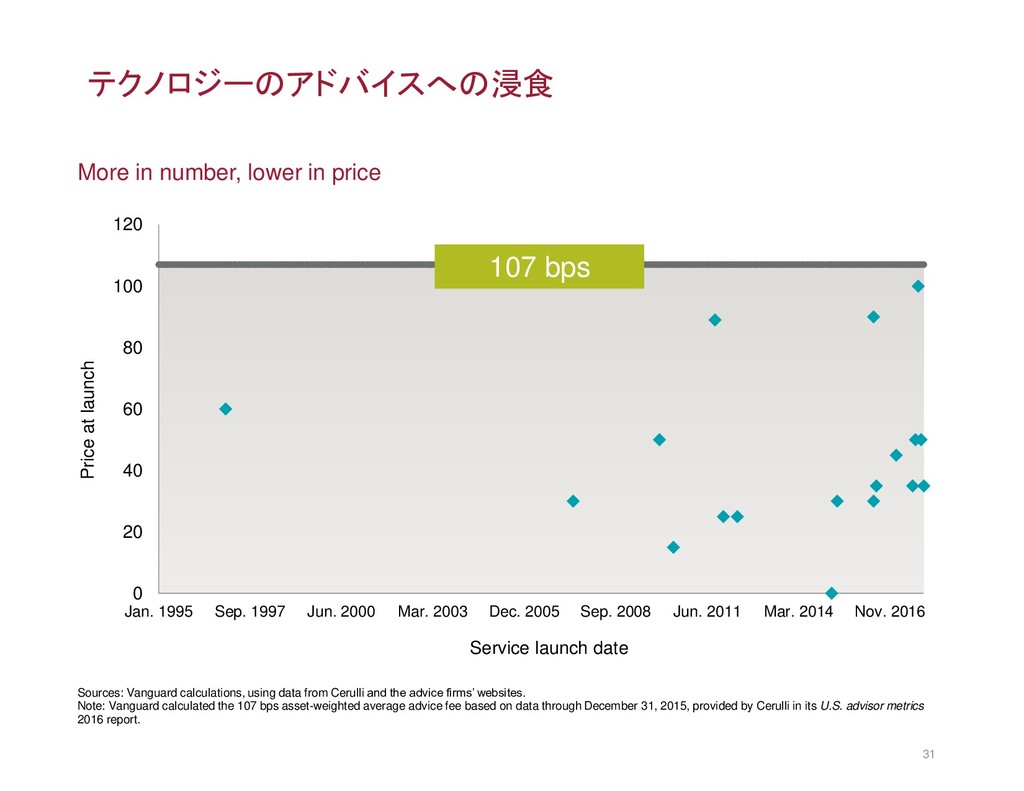
Sep. 1997 Jun. 2000 Mar. 2003 Dec. 2005 Sep. 2008 Jun. 2011 Mar. 2014 Nov. 2016 Price at launch Service launch date テクノロジーのアドバイスへの浸食 More in number, lower in price 107 bps Sources: Vanguard calculations, using data from Cerulli and the advice firms’ websites. Note: Vanguard calculated the 107 bps asset-weighted average advice fee based on data through December 31, 2015, provided by Cerulli in its U.S. advisor metrics 2016 report.
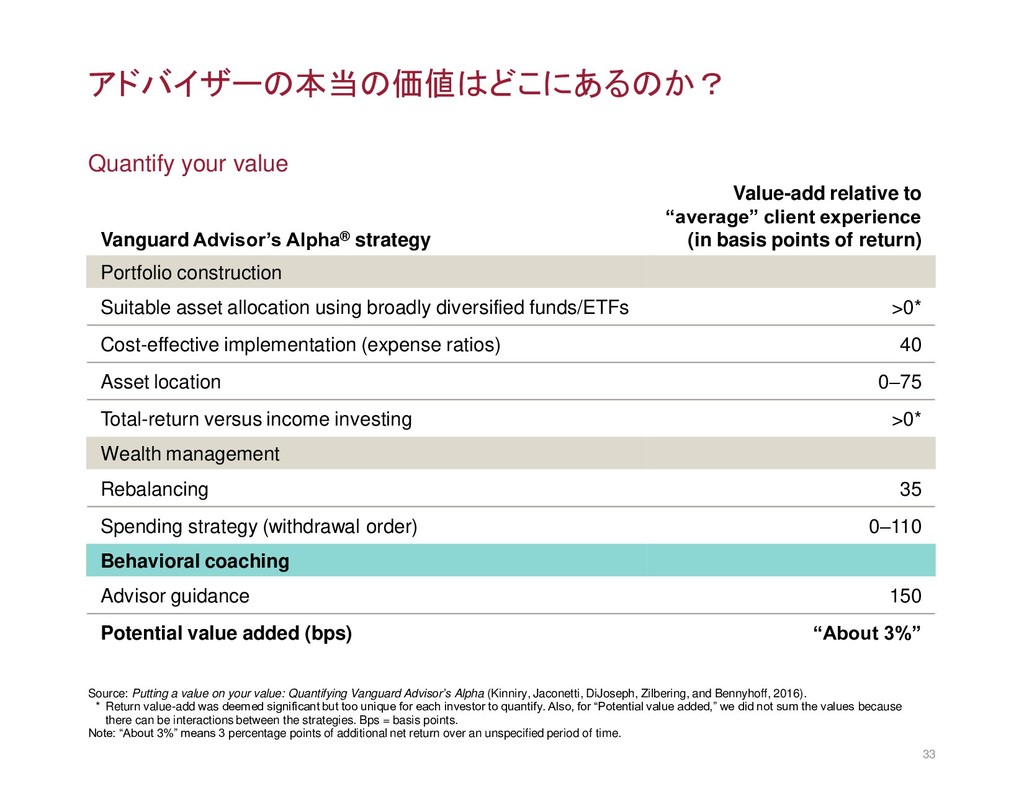
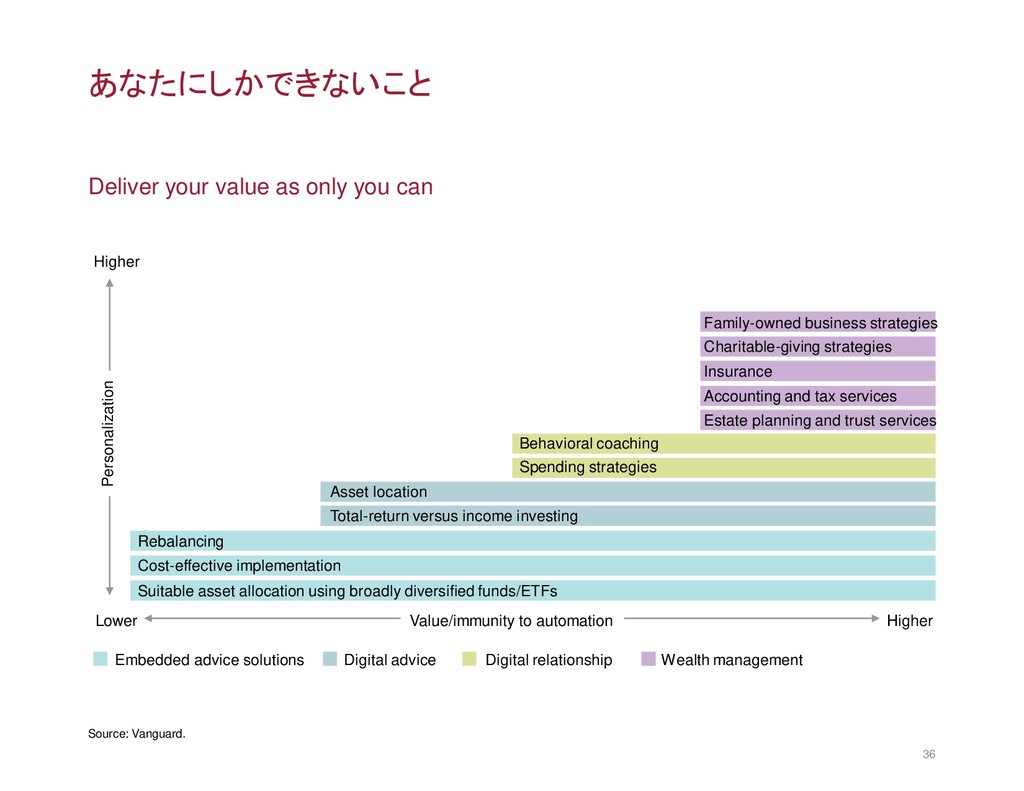
to “average” client experience (in basis points of return) Portfolio construction Suitable asset allocation using broadly diversified funds/ETFs >0* Cost-effective implementation (expense ratios) 40 Asset location 0–75 Total-return versus income investing >0* Wealth management Rebalancing 35 Spending strategy (withdrawal order) 0–110 Behavioral coaching Advisor guidance 150 Potential value added (bps) “About 3%” Source: Putting a value on your value: Quantifying Vanguard Advisor’s Alpha (Kinniry, Jaconetti, DiJoseph, Zilbering, and Bennyhoff, 2016). * Return value-add was deemed significant but too unique for each investor to quantify. Also, for “Potential value added,” we did not sum the values because there can be interactions between the strategies. Bps = basis points. Note: “About 3%” means 3 percentage points of additional net return over an unspecified period of time. アドバイザーの本当の価値はどこにあるのか?
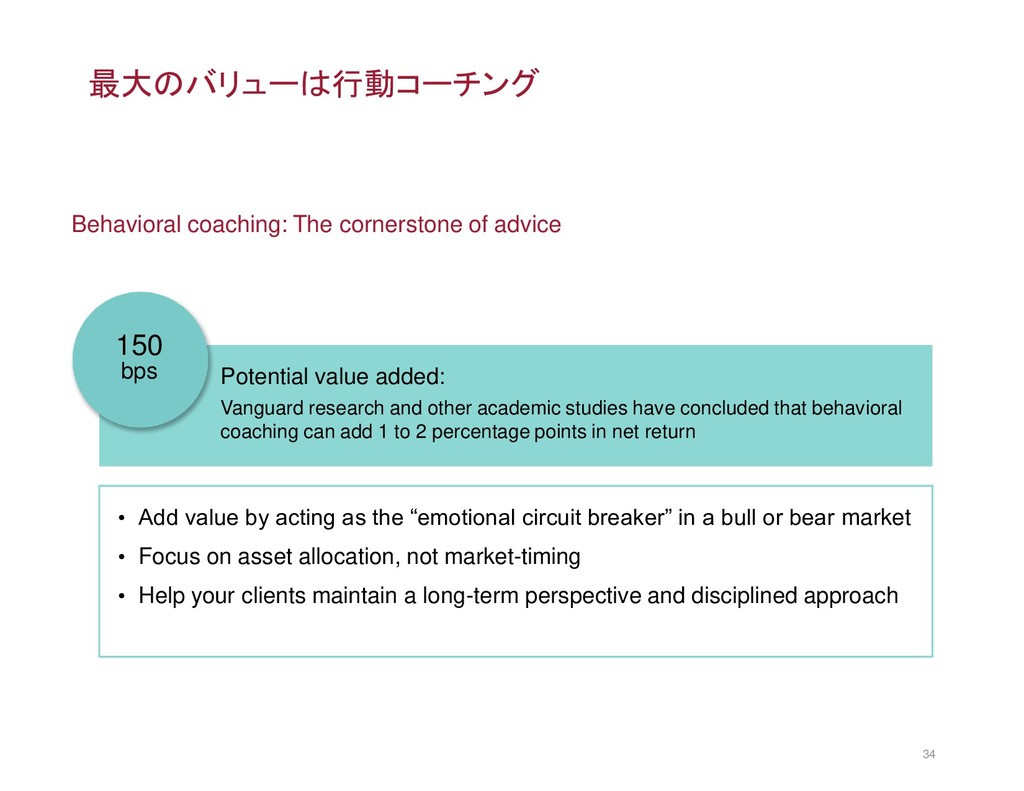
Vanguard research and other academic studies have concluded that behavioral coaching can add 1 to 2 percentage points in net return • Add value by acting as the “emotional circuit breaker” in a bull or bear market • Focus on asset allocation, not market-timing • Help your clients maintain a long-term perspective and disciplined approach 150 bps 最大のバリューは行動コーチング
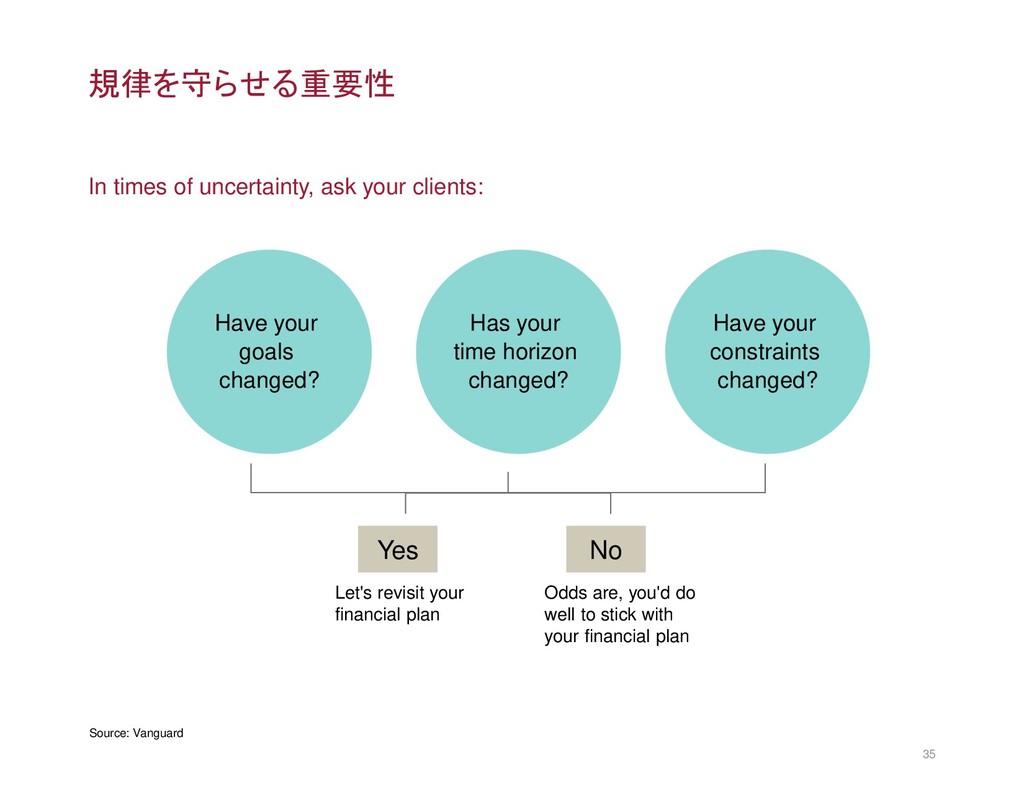
Vanguard Odds are, you'd do well to stick with your financial plan Yes No Let's revisit your financial plan Has your time horizon changed? Have your constraints changed? Have your goals changed?
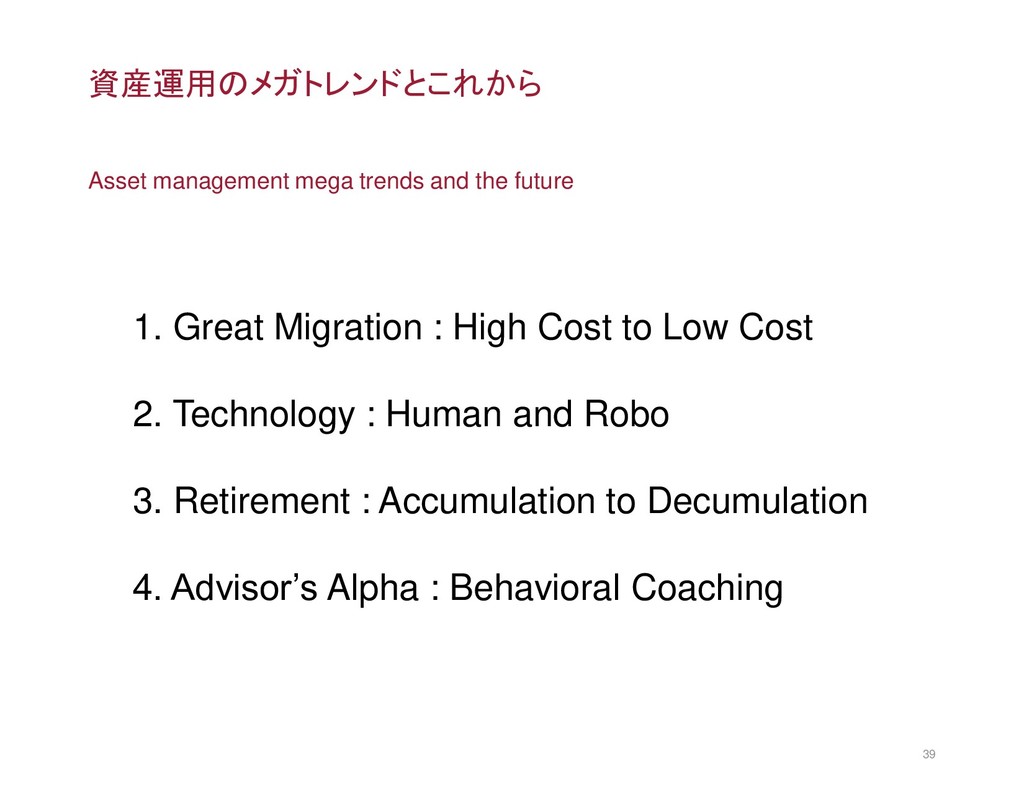
Great Migration : High Cost to Low Cost 2. Technology : Human and Robo 3. Retirement : Accumulation to Decumulation 4. Advisor’s Alpha : Behavioral Coaching
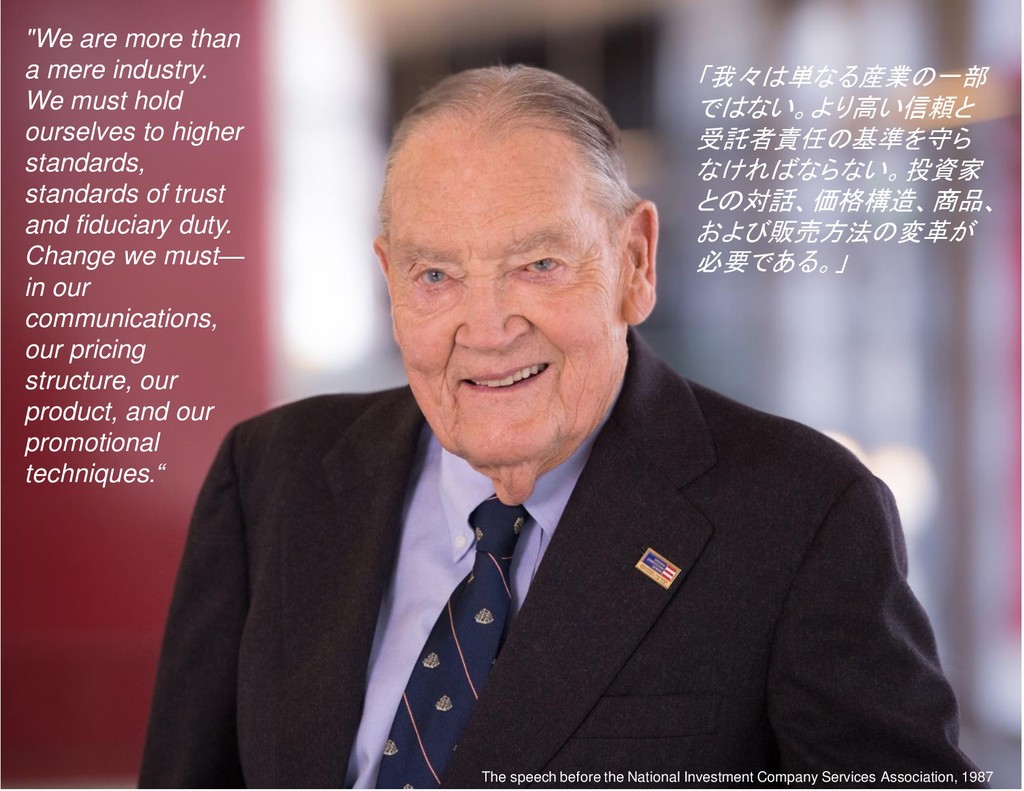
hold ourselves to higher standards, standards of trust and fiduciary duty. Change we must— in our communications, our pricing structure, our product, and our promotional techniques.“ 「我々は単なる産業の一部 ではない。より高い信頼と 受託者責任の基準を守ら なければならない。投資家 との対話、価格構造、商品、 および販売方法の変革が 必要である。」 The speech before the National Investment Company Services Association, 1987