Upgrade to Pro — share decks privately, control downloads, hide ads and more …

Prometheusを触ってみた!

Shunsuke Tanaka
July 13, 2023
290

 Prometheusを触ってみた!

本資料は次のイベントの投影資料です。

<イベント名>
IBM Tech Developer/Dojo 「Prometheusを触ってみた!」

<イベントページ>
https://ibm-developer.connpass.com/event/287905/

<概要>
監視ツールのPrometheus初学者向けに、
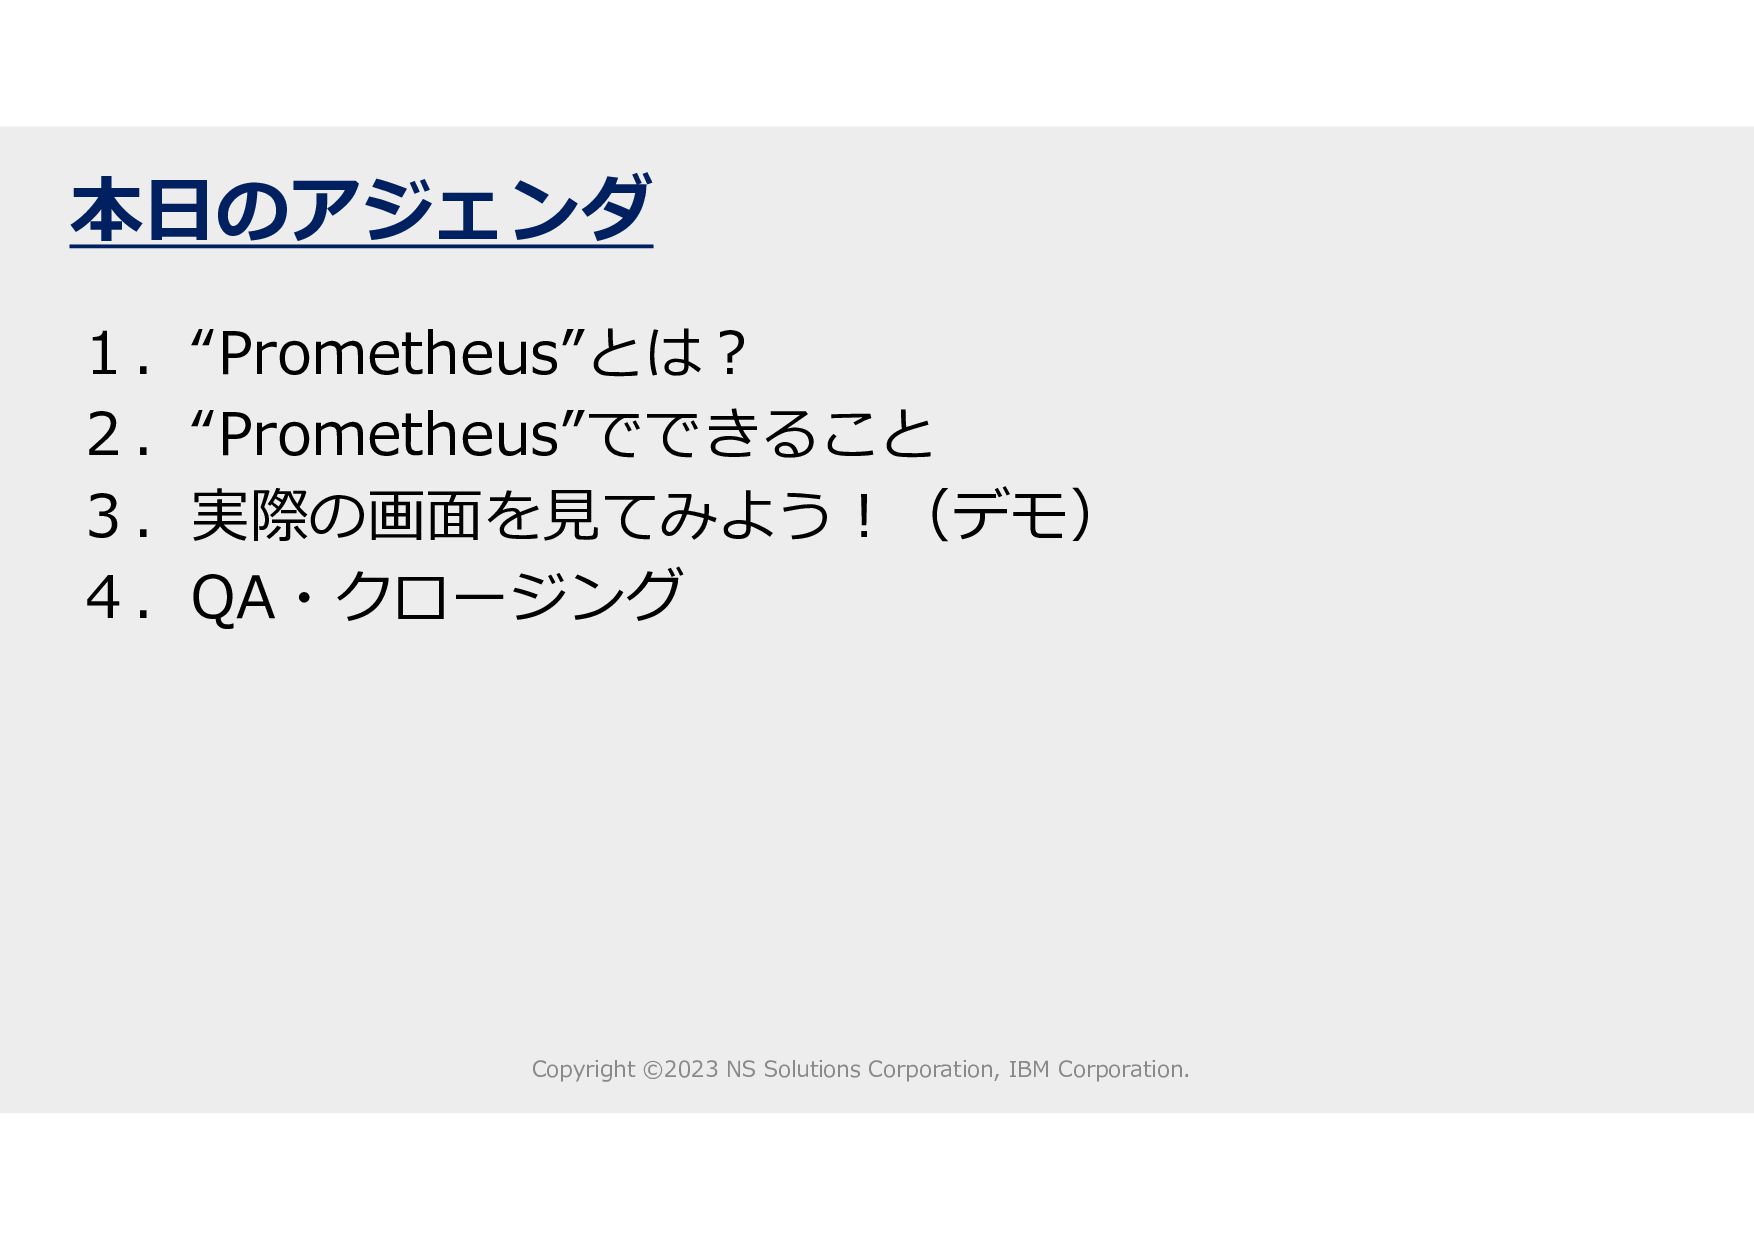
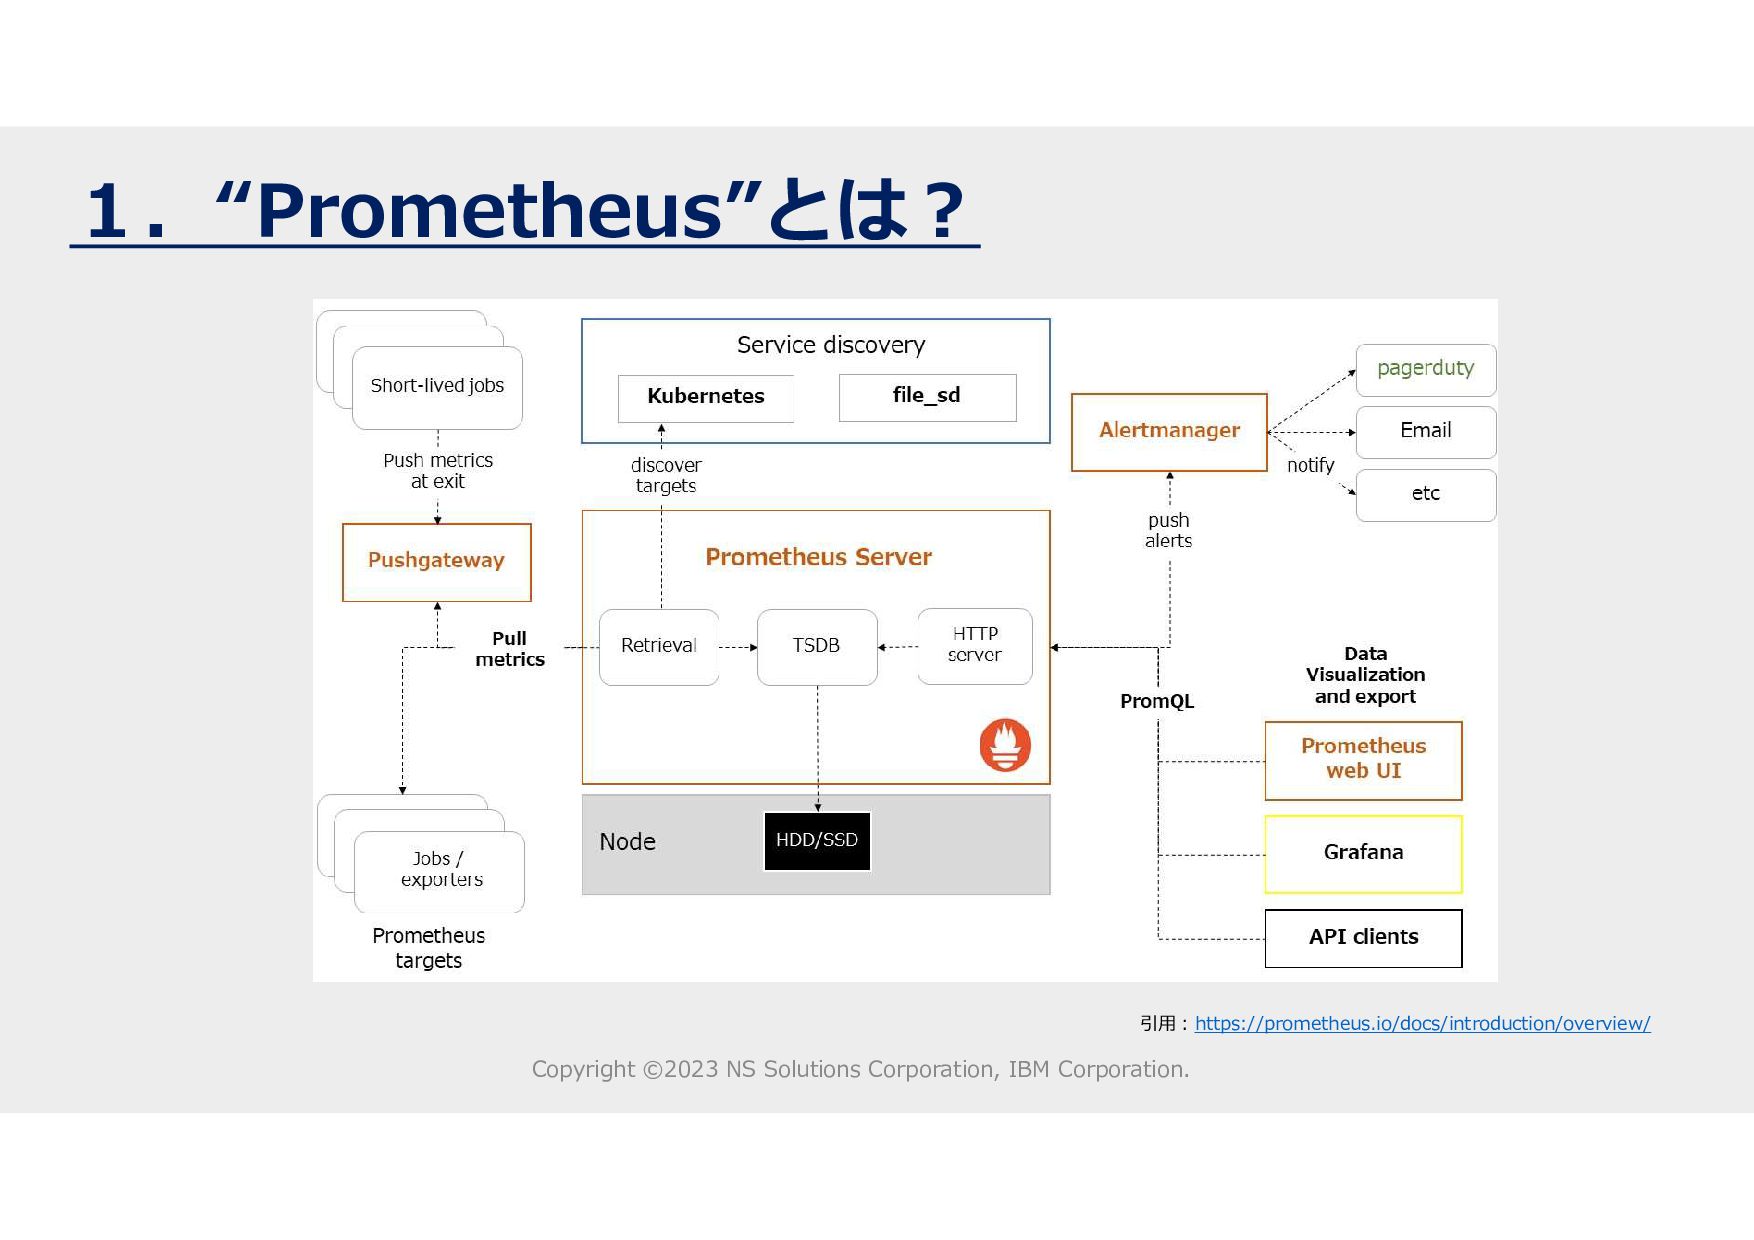
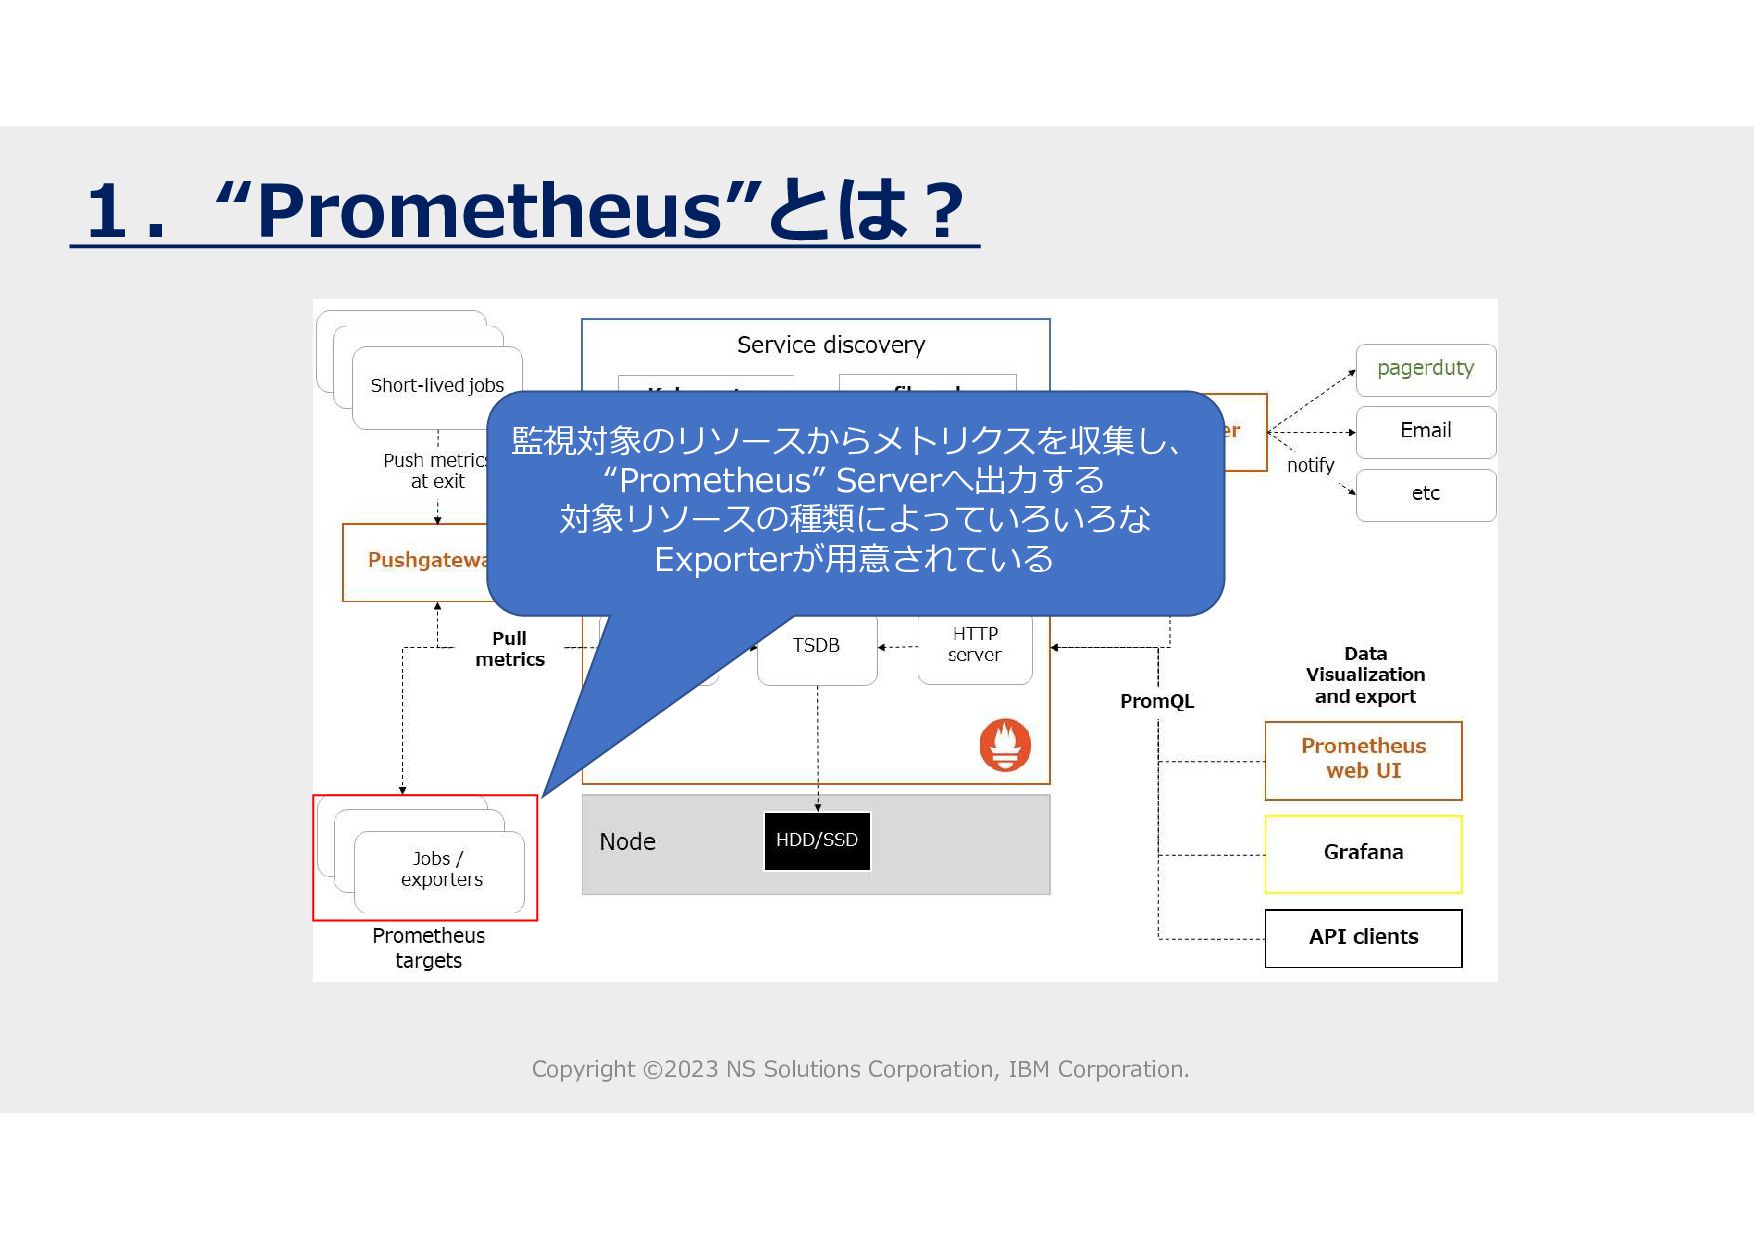
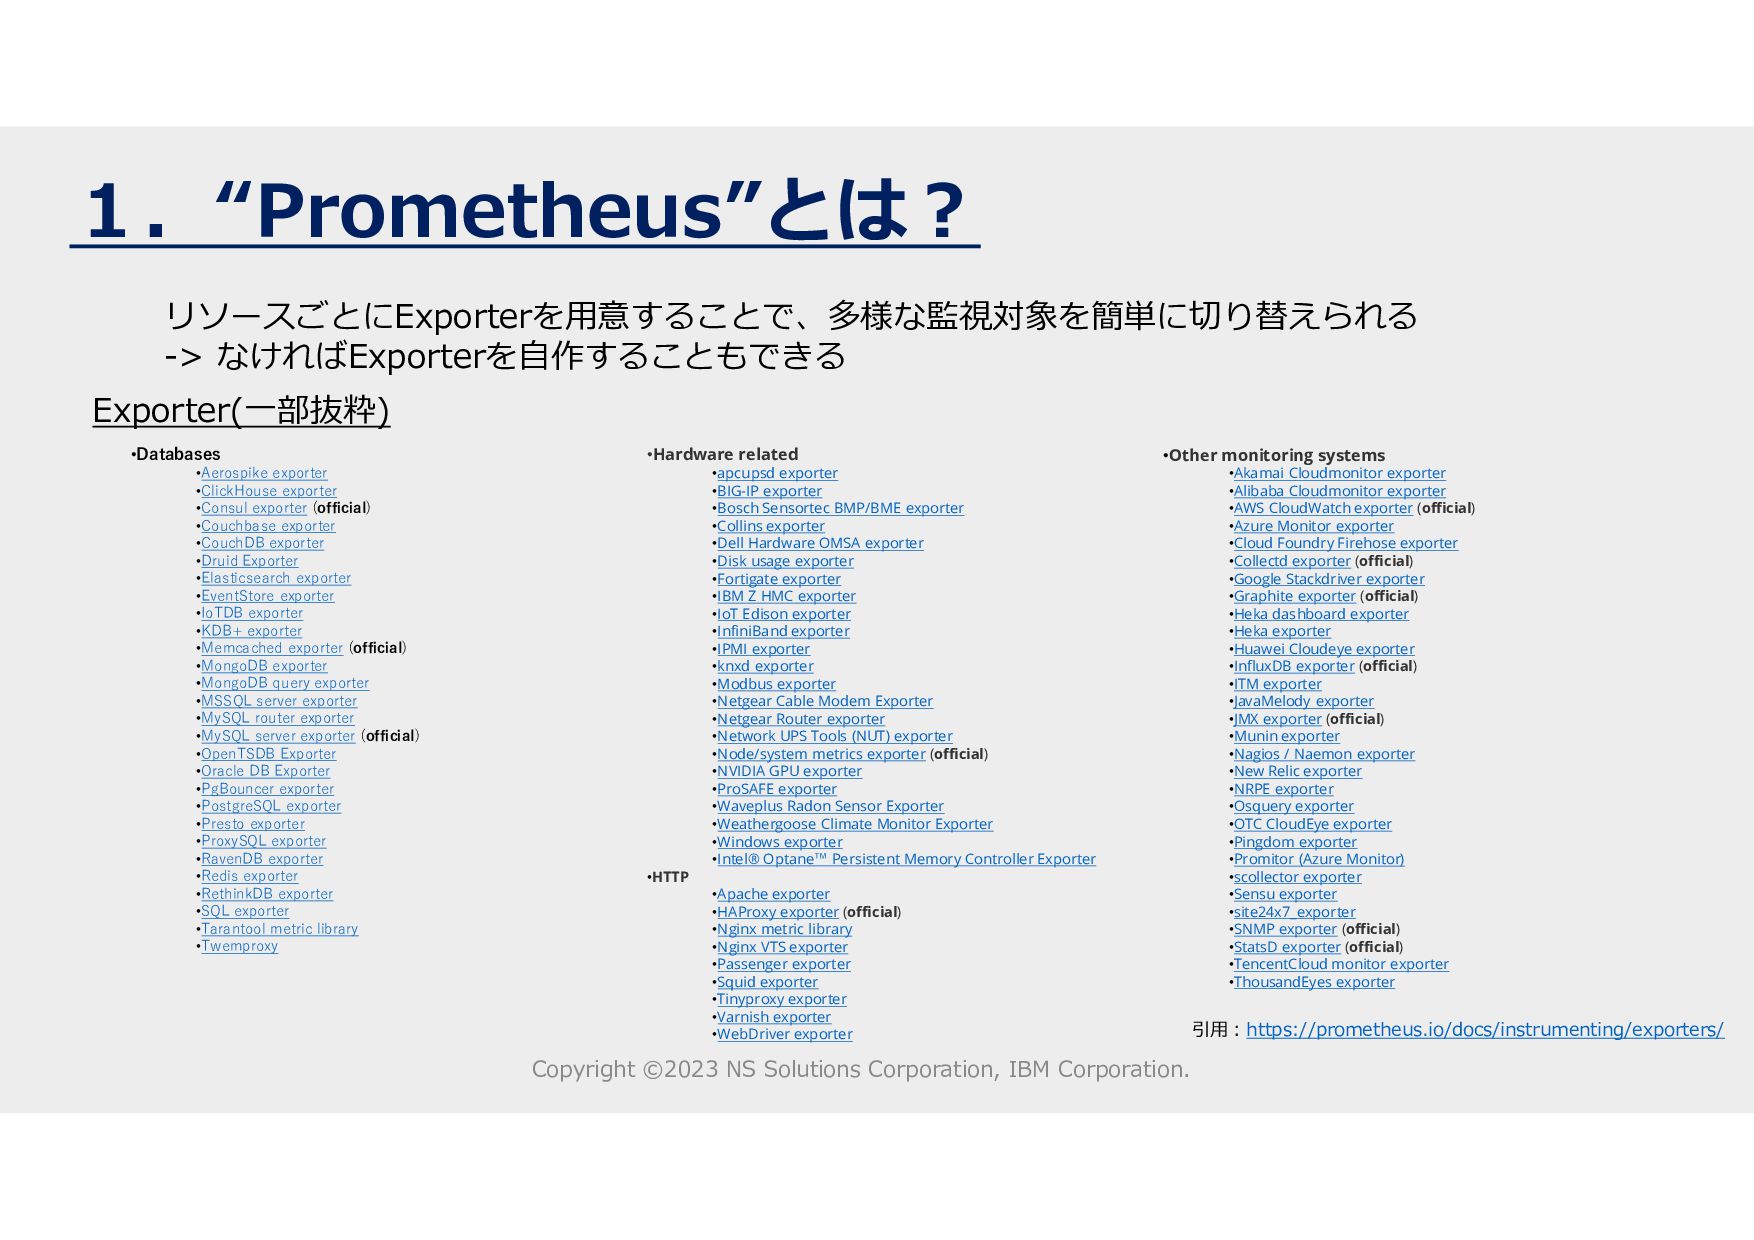
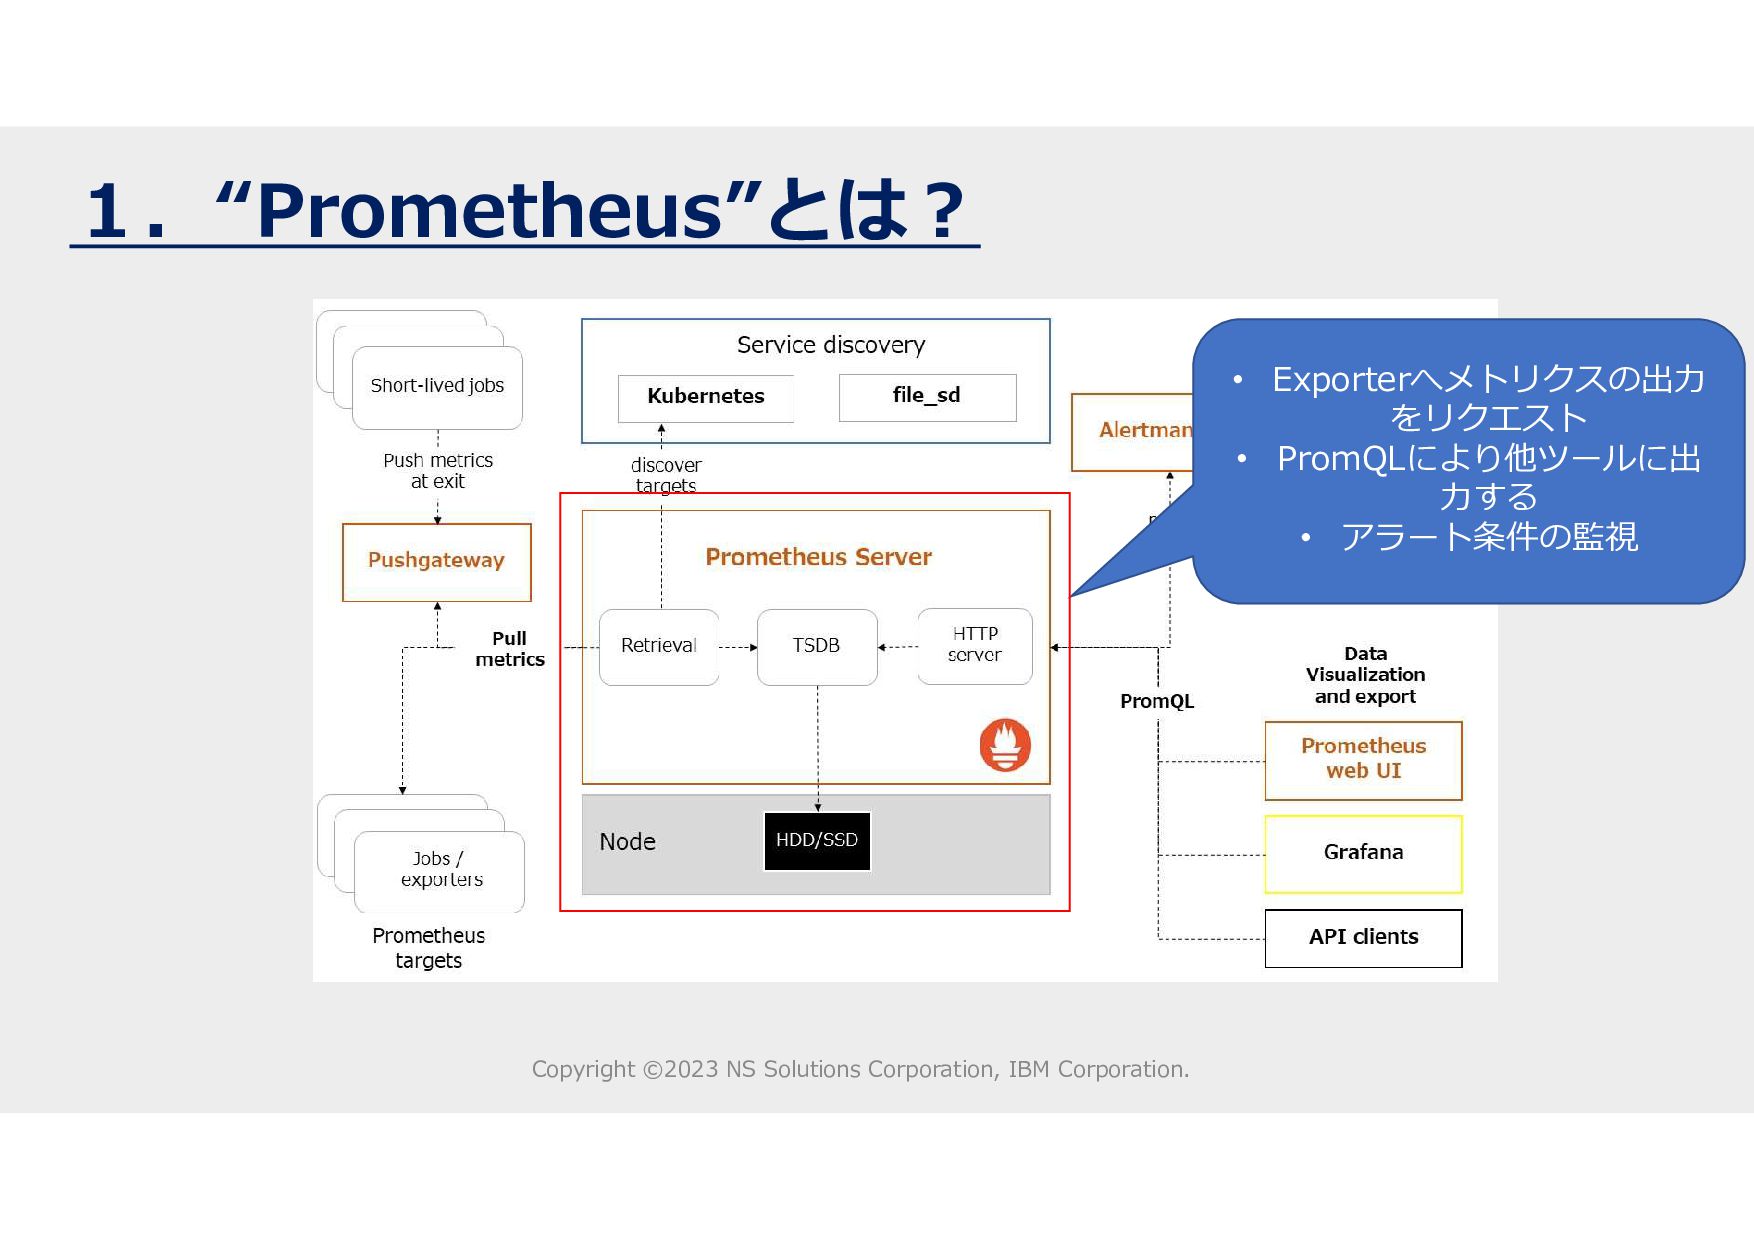
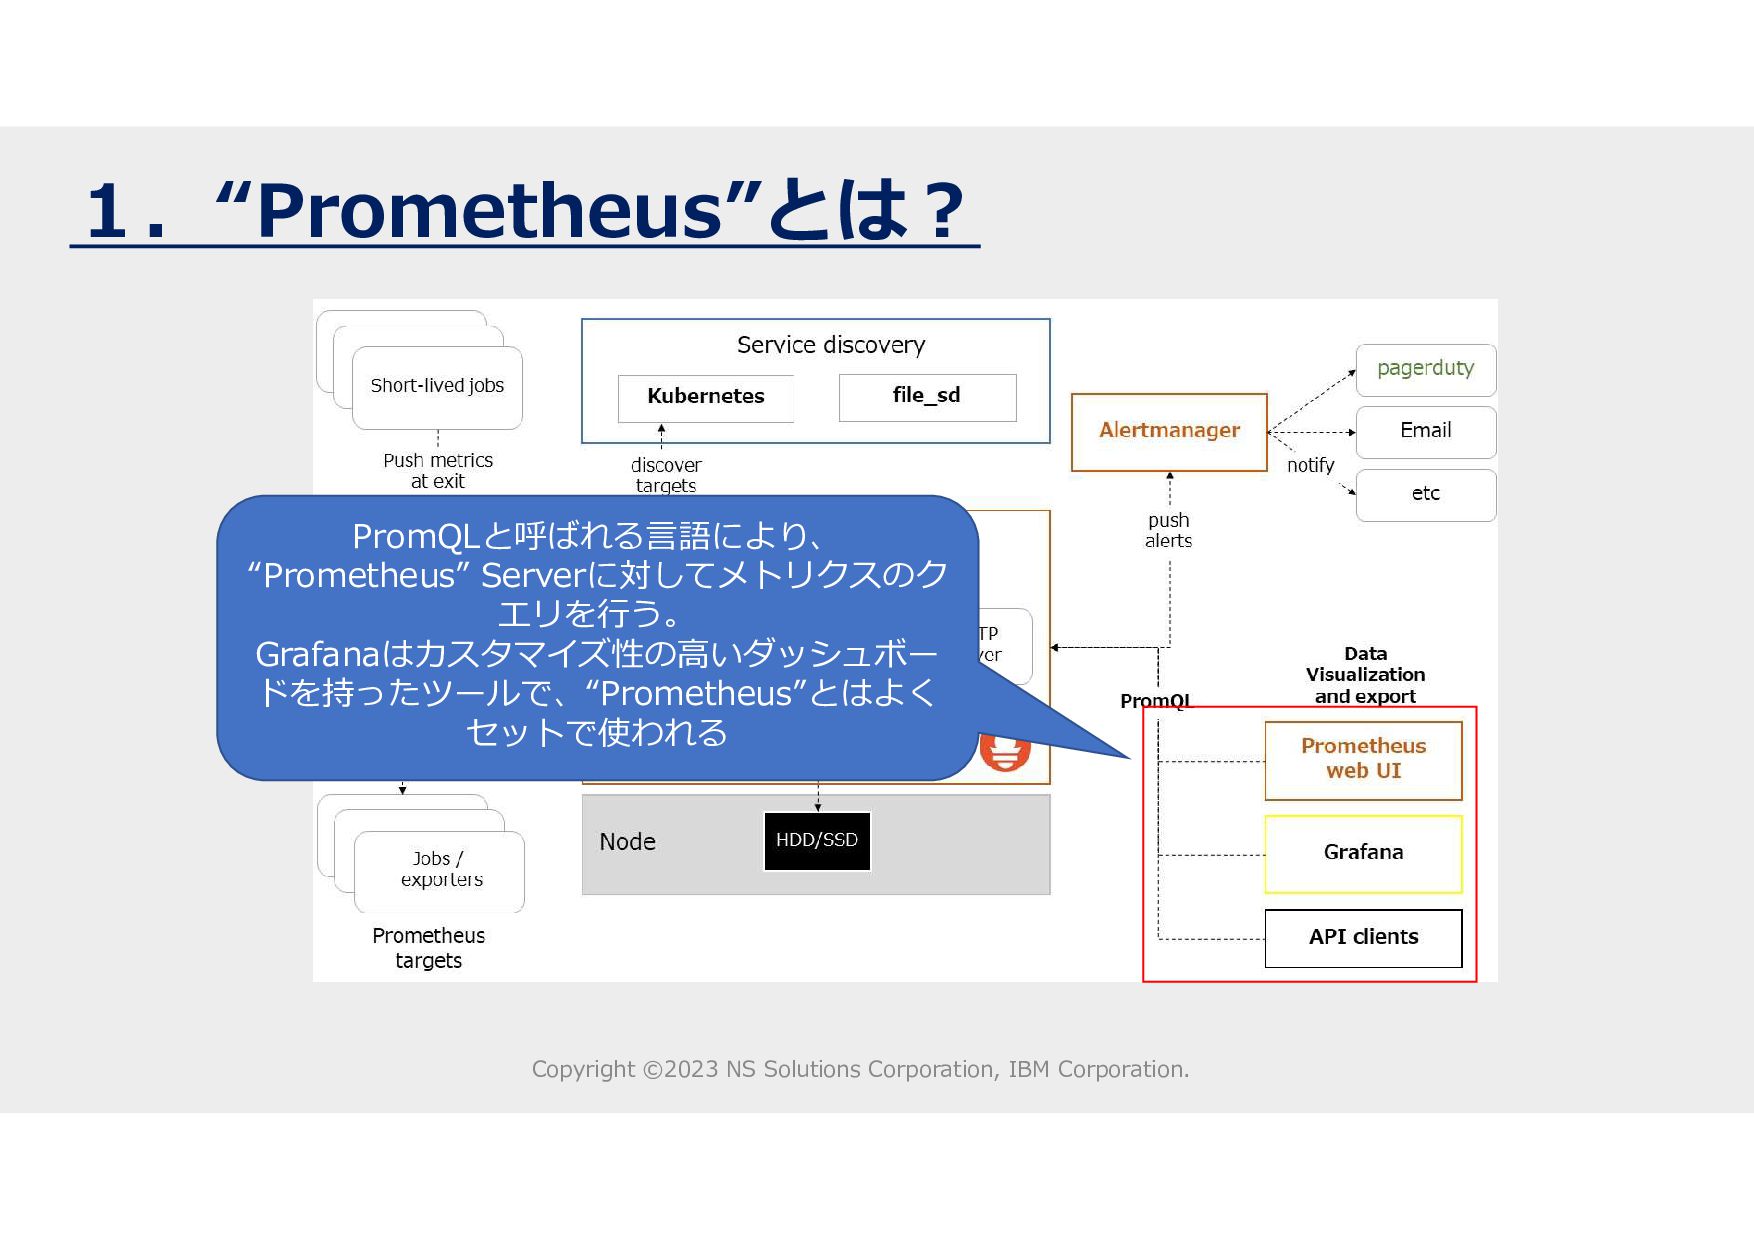
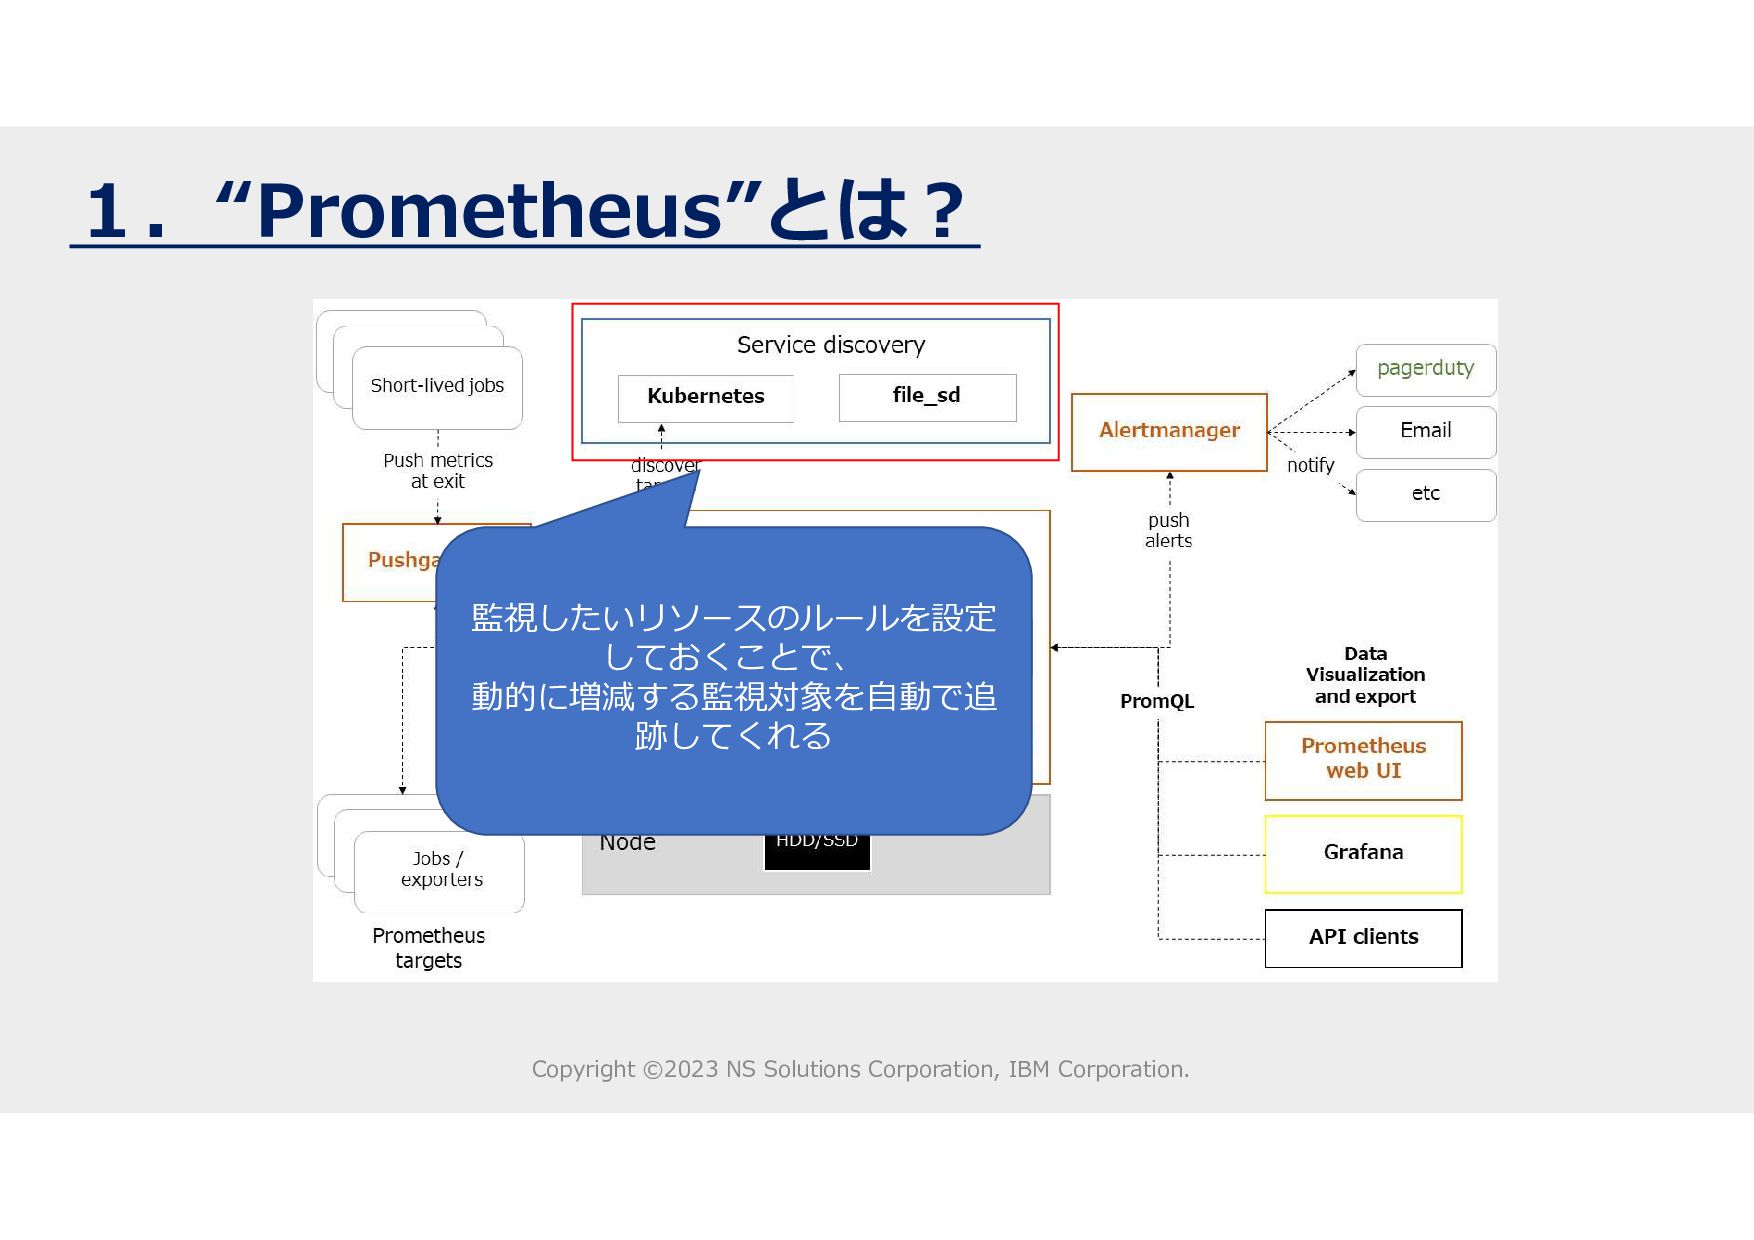
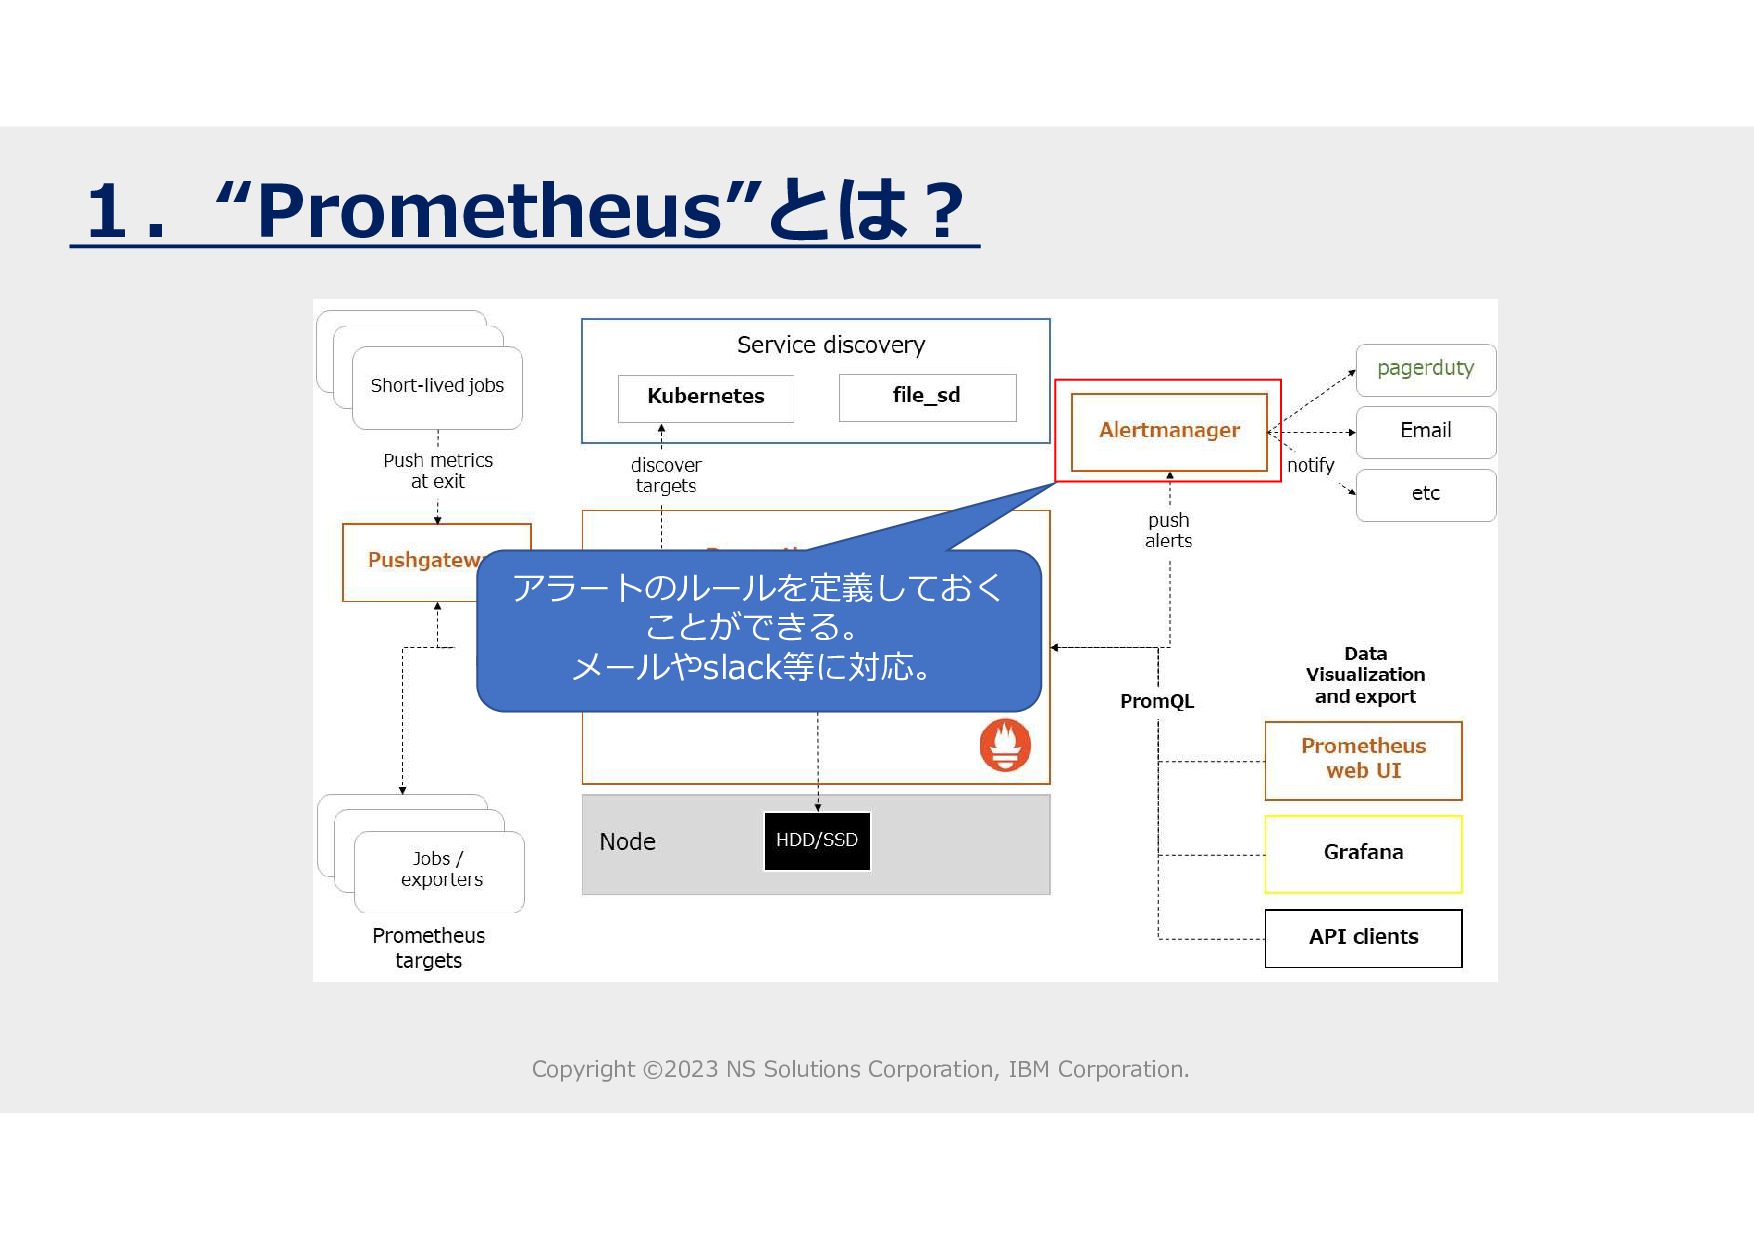
・Prometheusとは?
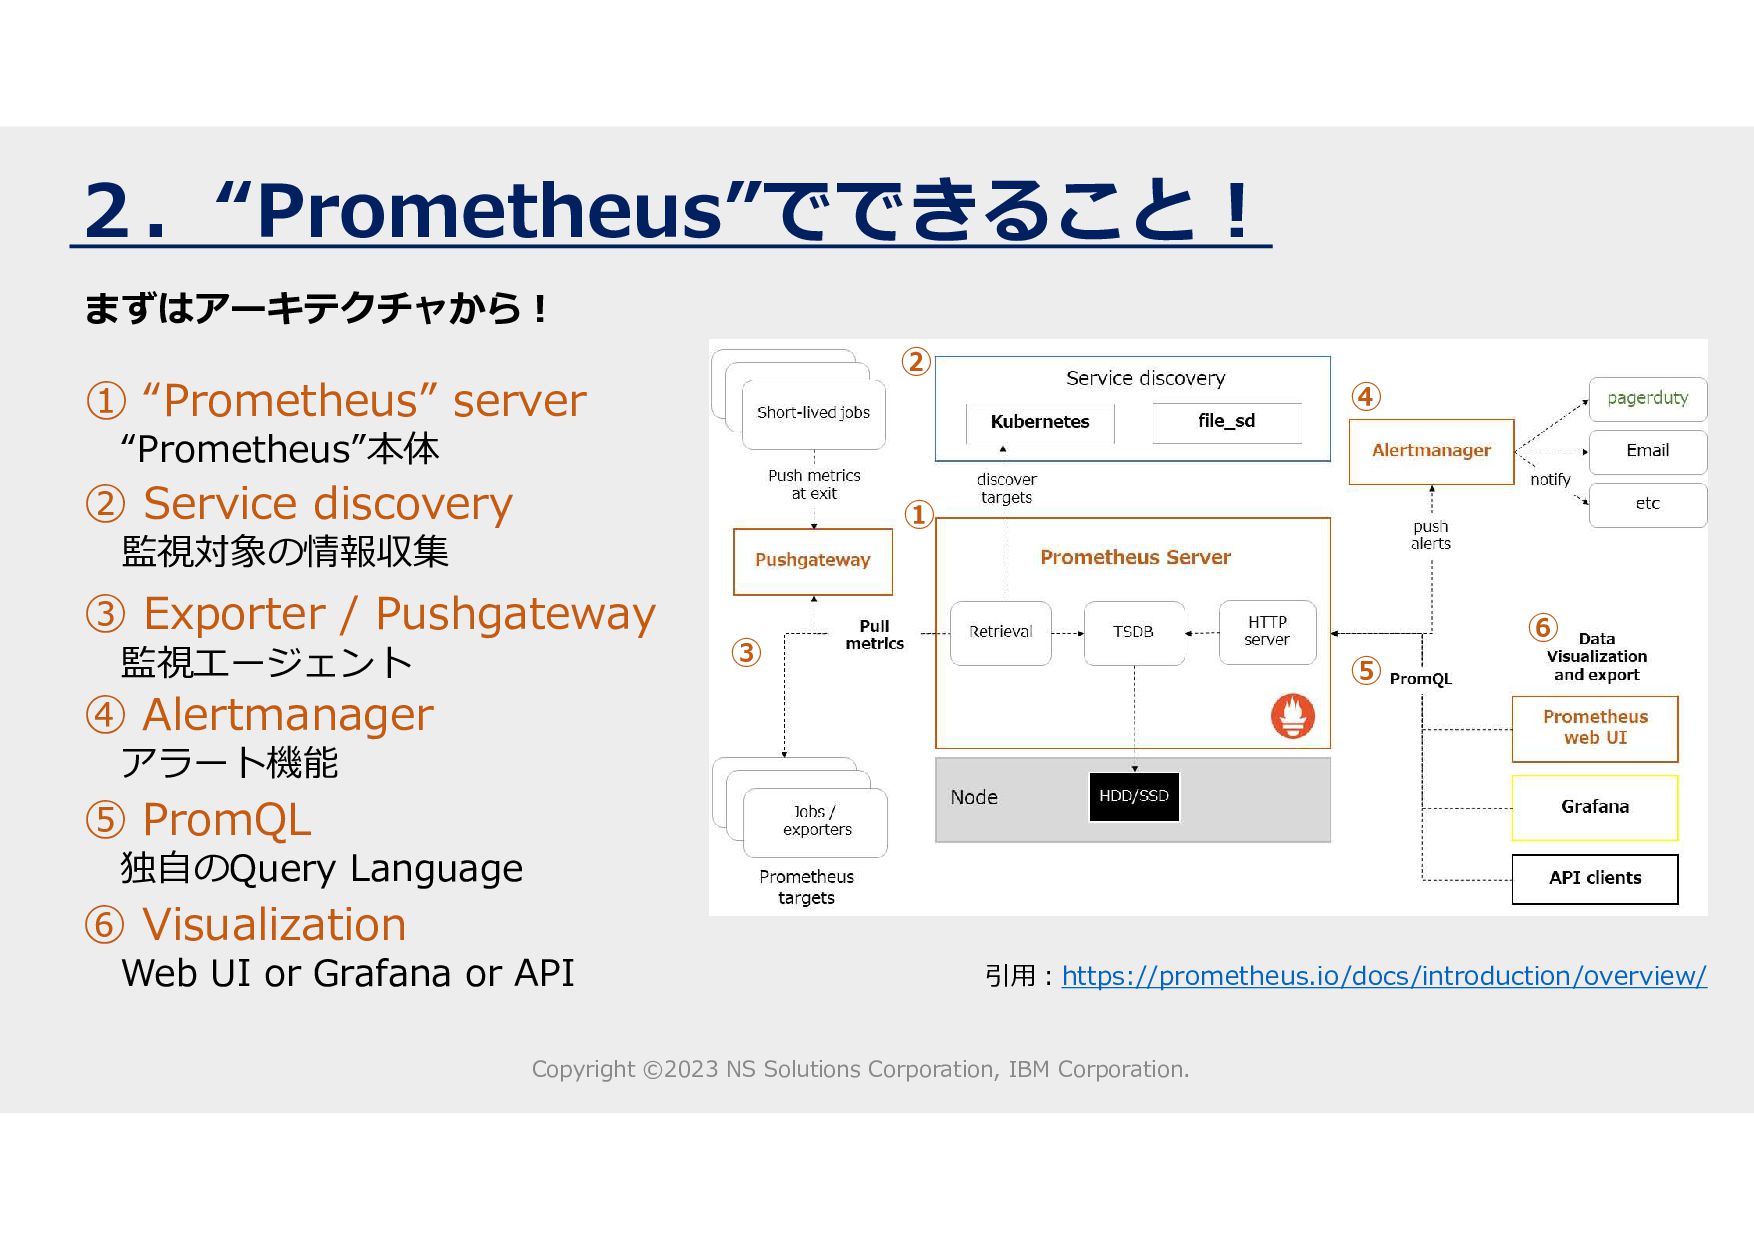
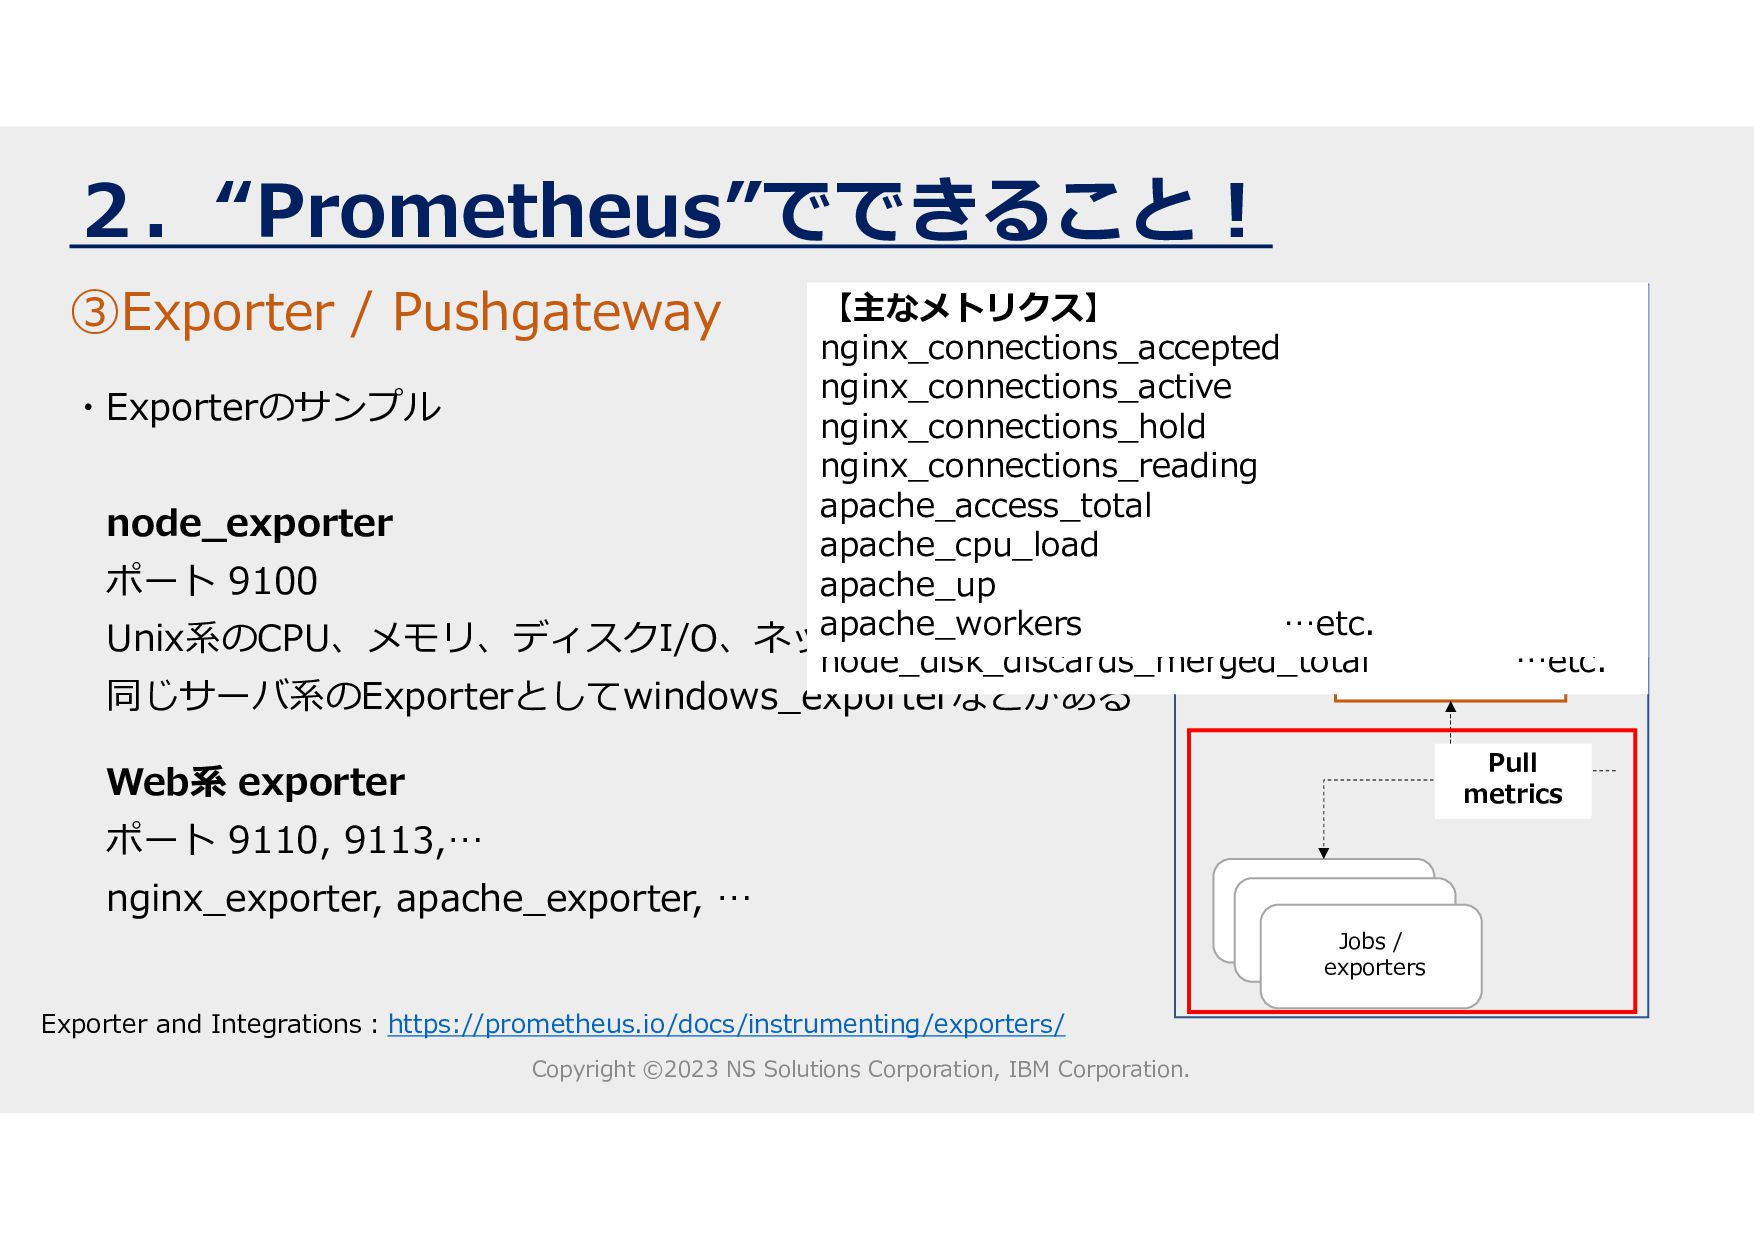
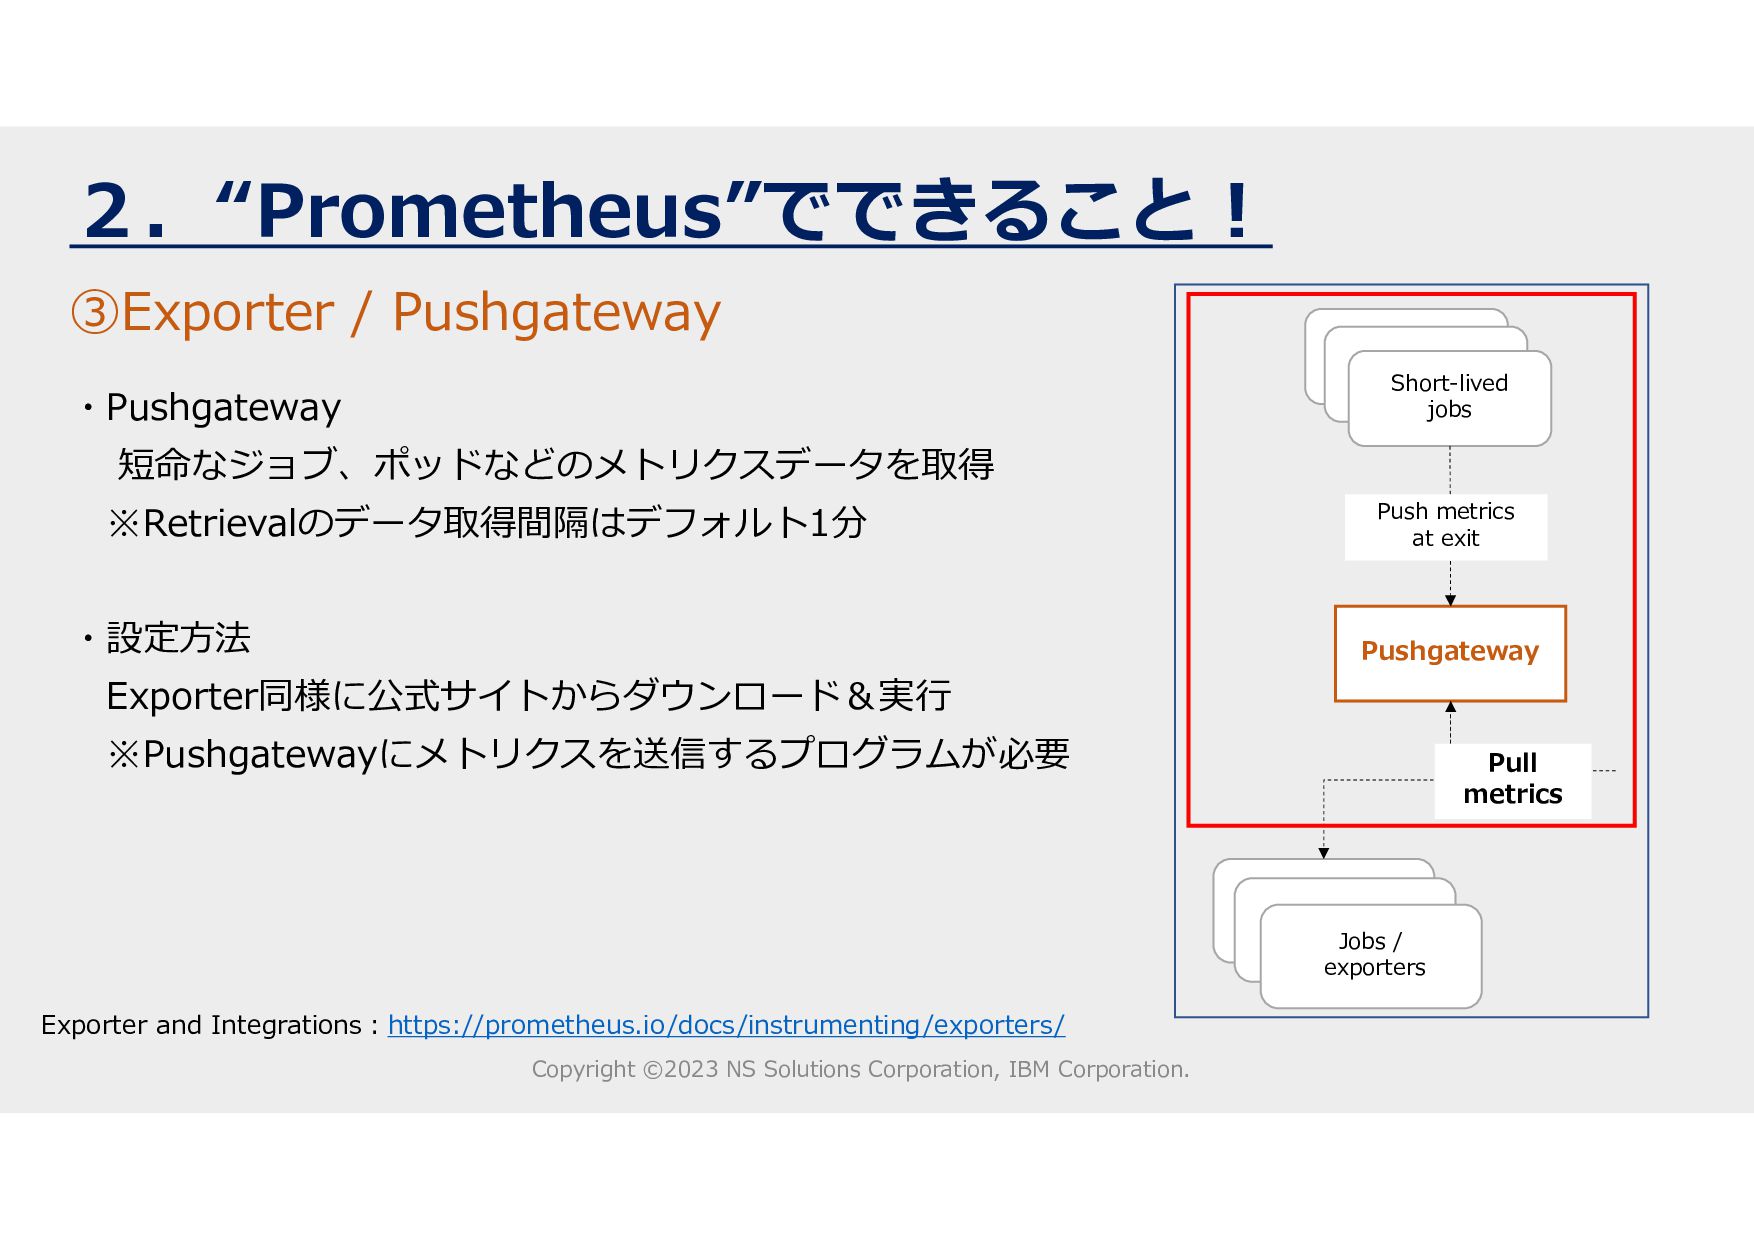
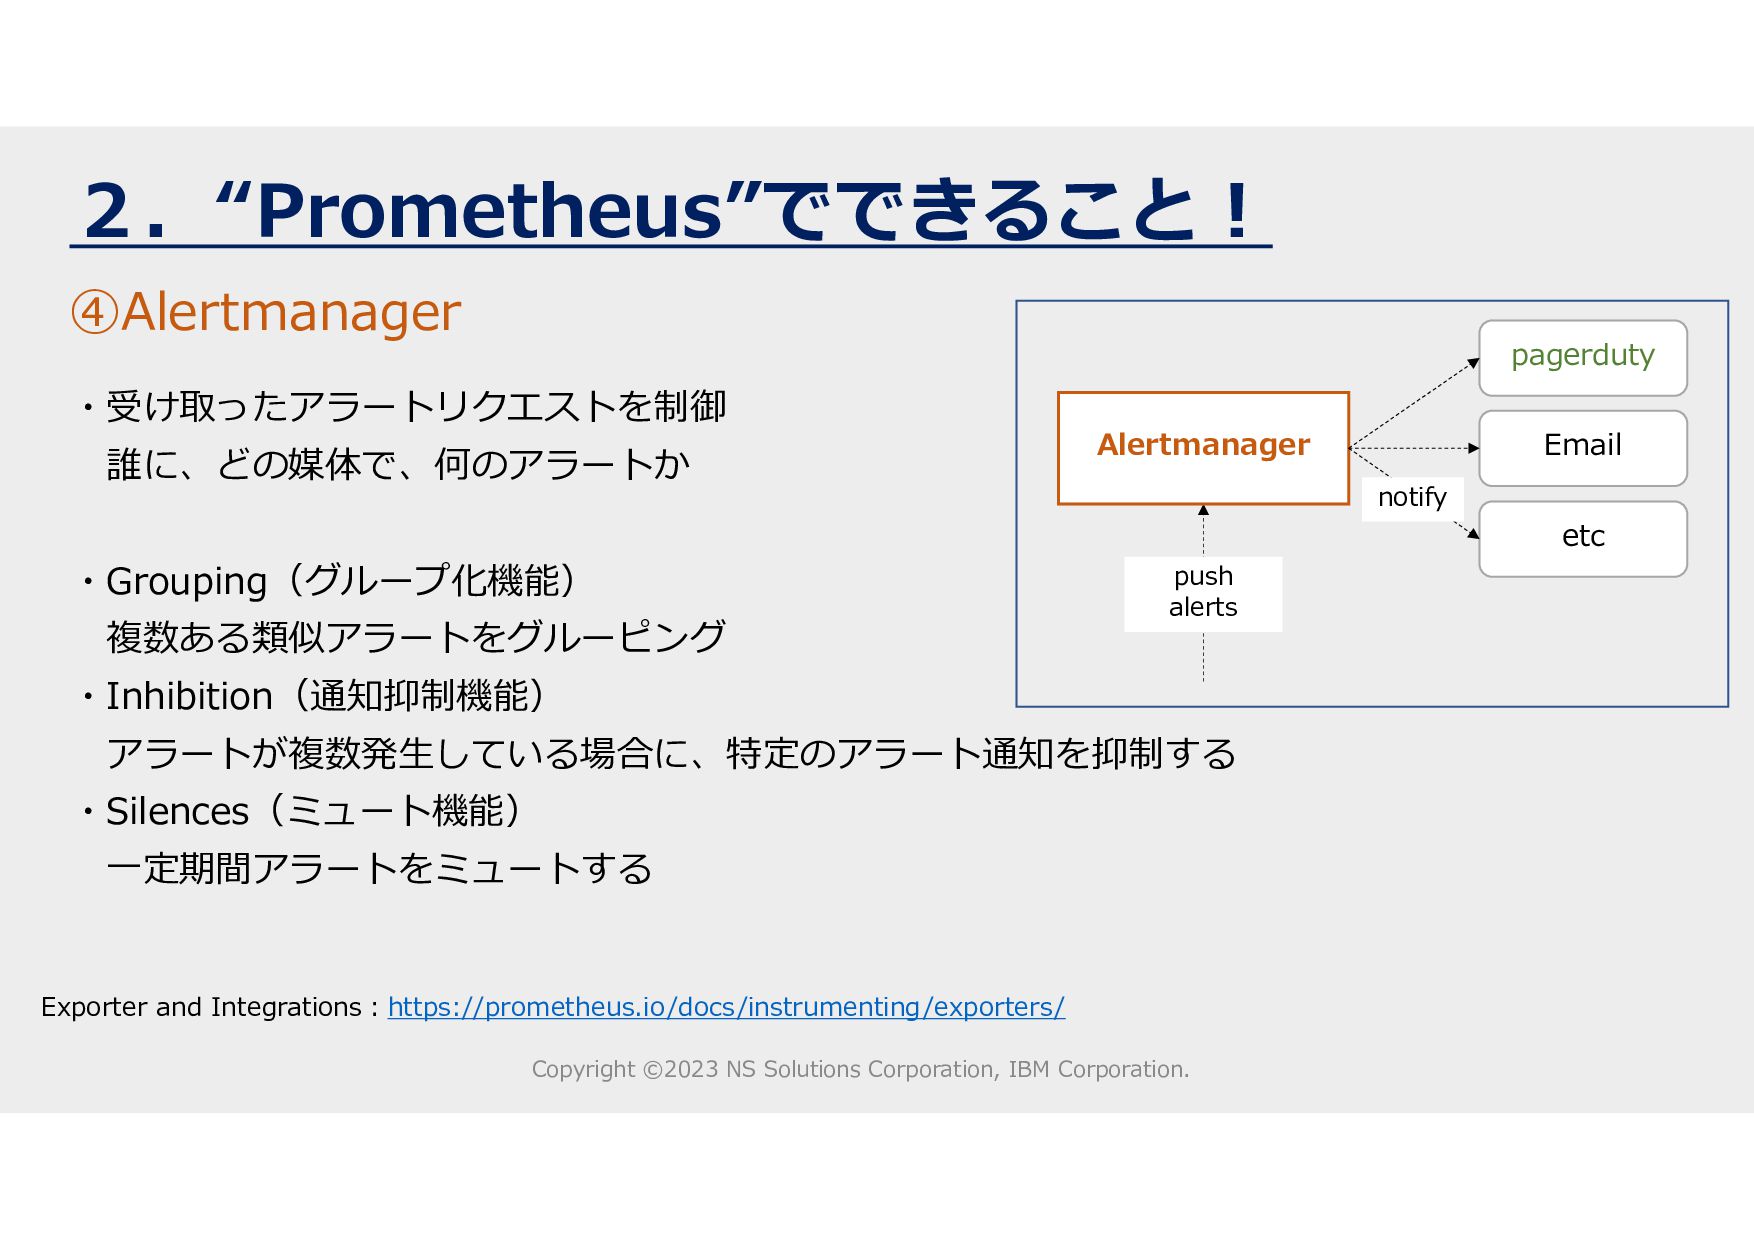
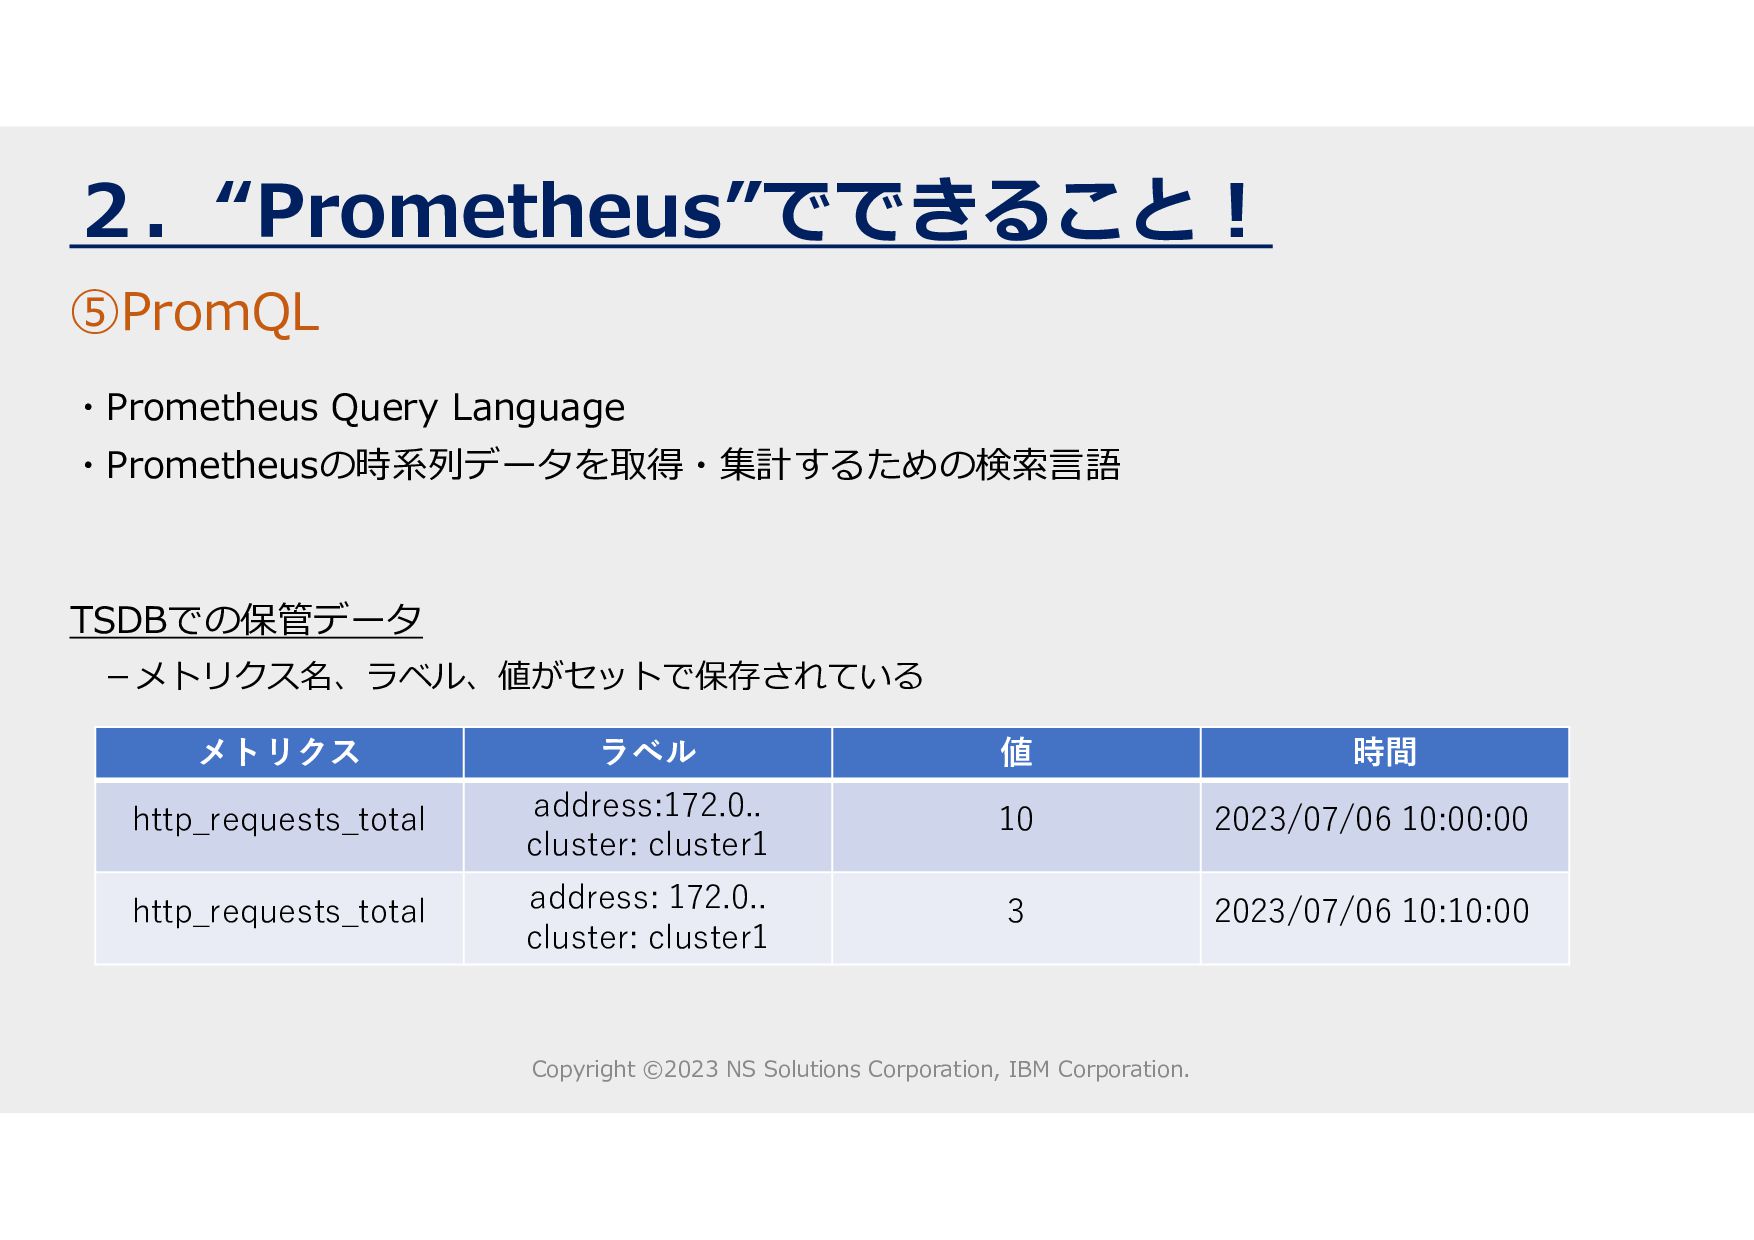
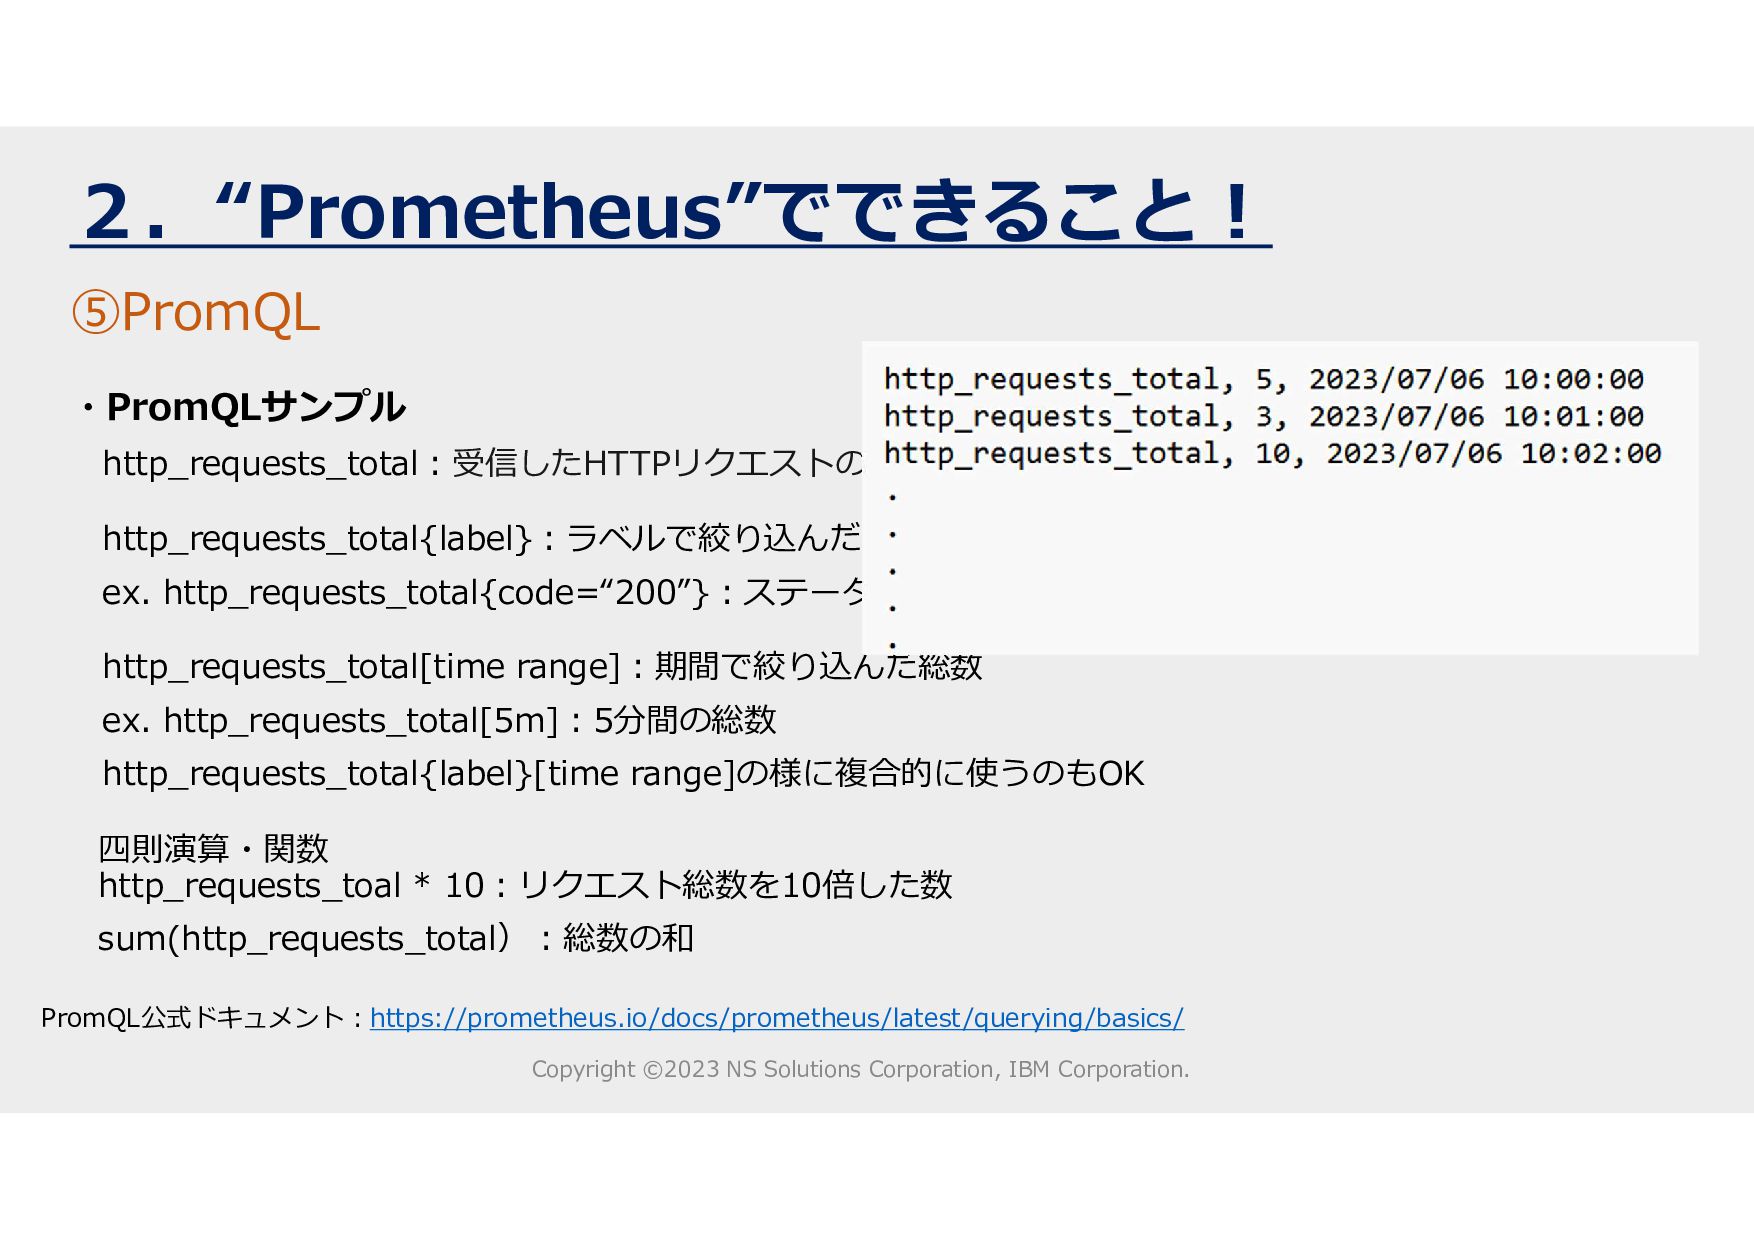
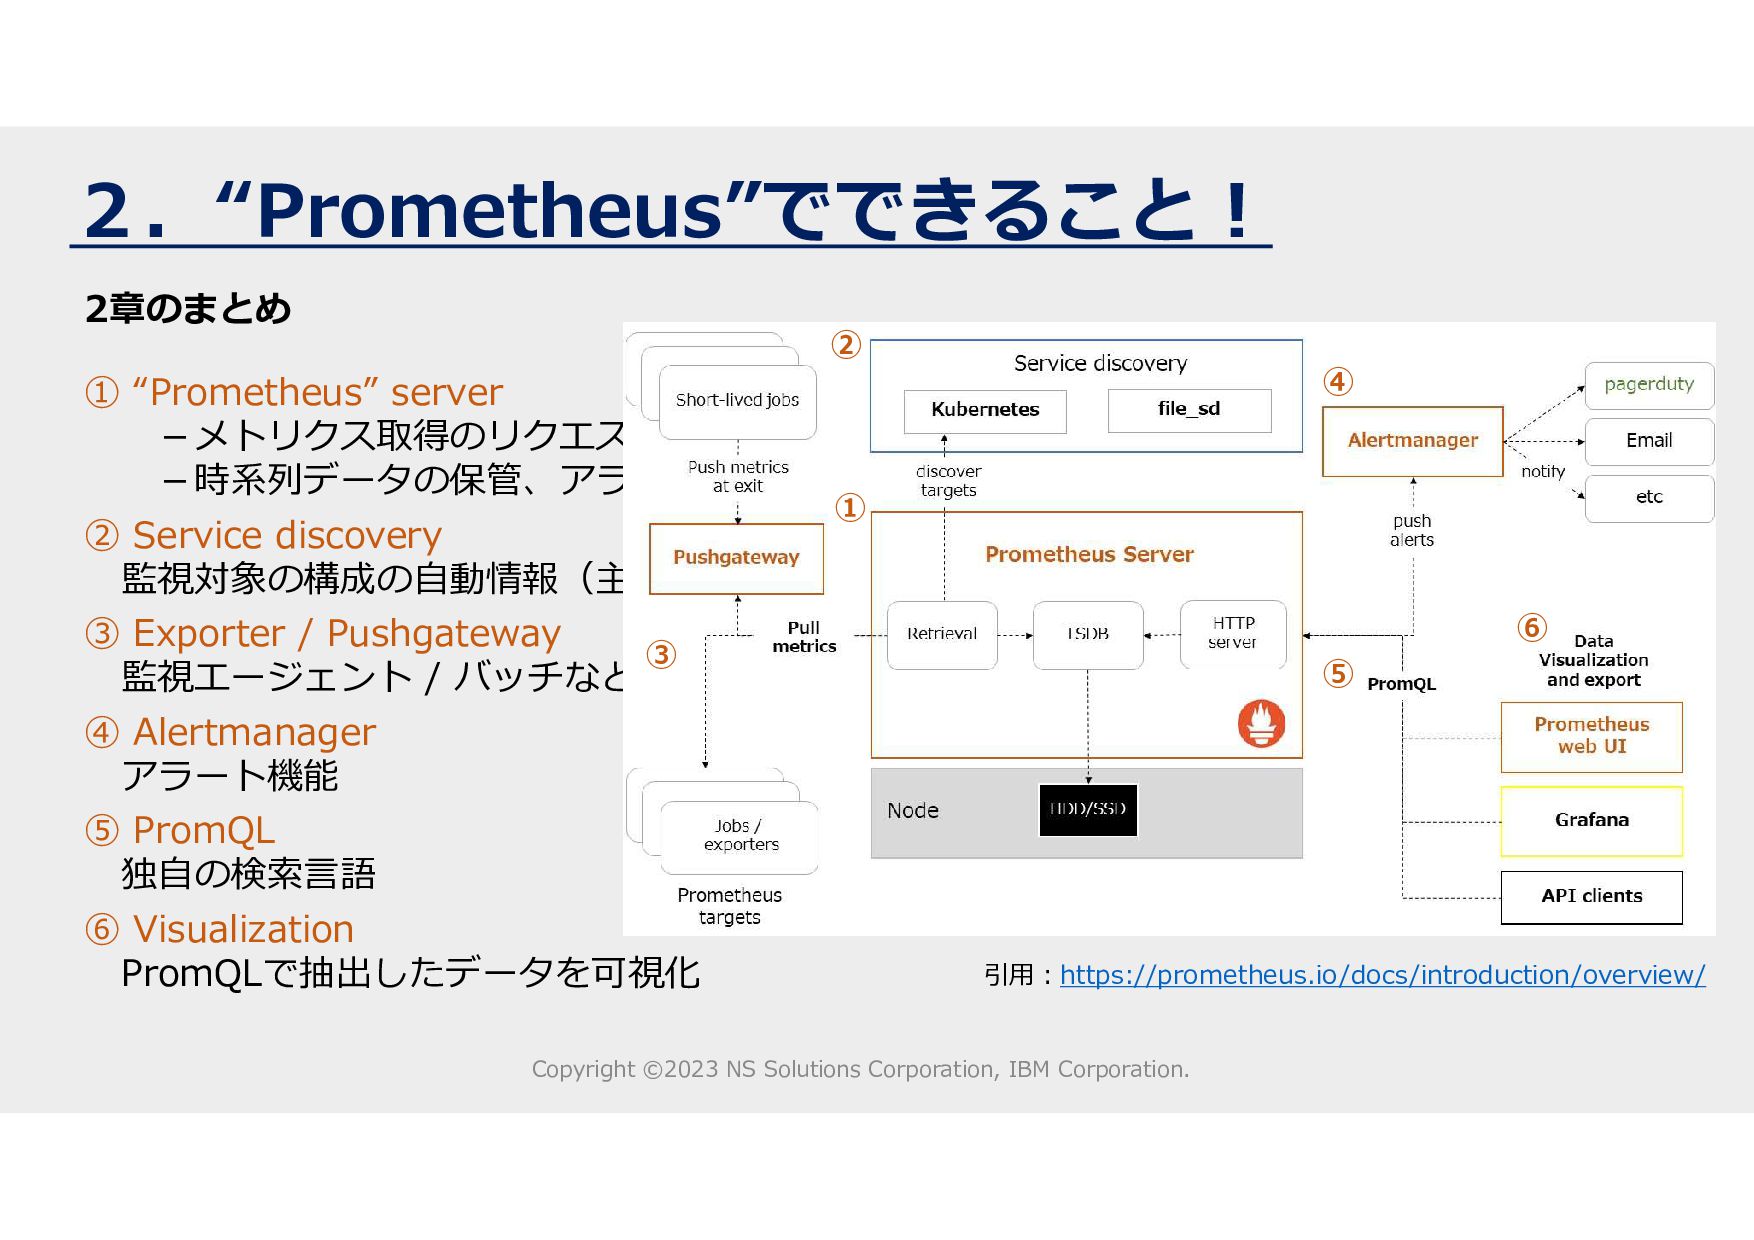
・Prometehusでどんなことができるの?
・実際の画面は?操作方法は?
をデモも交えながらご紹介させていただきました。

監視と言われても何が出来るのか分からなかった、PrometheusがOSSなのは知ってたけど後一歩が踏み出せない…
まずはどんなもので何ができるのかを知っていただけたら!

Shunsuke Tanaka

July 13, 2023
Tweet

Transcript

  1. 田中 俊介(たなか しゅんすけ) [email protected] <所属> 日本IBM カスタマーサクセスマネージャー <経歴> 開発ベンダーにてWebアプリケーション開発を約10年LinuxベースでJava,PHPでの開発案件 その後、新商品の設計・開発やオフショアベンダーの

    管理などに携わる 2022年4月に日本IBMに入社してCSMとして歩み始める <趣味など> スポーツ(観るのもやるのも)、特にサッカー・フットサル 旅行(元バックパッカーで約40か国に訪問) 自己紹介 Copyright ©2023 NS Solutions Corporation, IBM Corporation.
  2. 自己紹介 飯島 和之(いいじま かずゆき) [email protected] <所属> 日鉄ソリューションズ システム研究開発センター <経歴> 2014年に日鉄ソリューションズに入社後、性能管理の研究開発や、大規模負荷試験

    案件などを経験 2019年ごろよりクラウドネイティブ技術の研究開発に注力し、複数案件の設計・構 築・運用を担当 <趣味など> 猫(8歳)、ゲーム、音楽(たまにピアノ楽譜の作成、ごくまれに作曲) Copyright ©2023 NS Solutions Corporation, IBM Corporation.
  3. 自己紹介 矢田 浩平(やだ こうへい) [email protected] <所属> 日鉄ソリューションズ システム研究開発センター <経歴> 2020年に日鉄ソリューションズに入社、アジャイルでのクラウドシステム開

    発案件など経験 現在は“OpenTelemetry”を用いた監視ソリューションの構築案件に参画中 <趣味など> 映画(キューブリック)、音楽(ビートルズ)、町中華 Copyright ©2023 NS Solutions Corporation, IBM Corporation.
  4. 1.“Prometheus”とは? クラウド・コンテナ・“Kubernetes”などの利用により、 動的に増減する監視対象に対応する必要が出てきた 例: VM1 OS コンテナランタイム/K8s APP コンテナ APP

    コンテナ ・・ サーバ1 VM2 OS コンテナランタイム/K8s APP コンテナ APP コンテナ ・・ サーバ2 ・・ パブリッククラウドの 利用で、VMのスケーリ ングが容易になった Copyright ©2023 NS Solutions Corporation, IBM Corporation. コンテナの利用で監視対象 が容易にスケーリングされ るようになり、管理レイ ヤーが追加された
  5. 1.“Prometheus”とは? メトリクス取得のための、Pull型監視ソフトウェア 2012年にSoundCloud社によって開発、その後“CNCF”プロジェクトとなり、 現在では“Kubernetes”などと並んでGraduatedと位置付けられている(*1) Service discovery(後述)によって、動的に増減する監視対象を追跡できる メトリクスとは(*2) システムの状態に関して数値で出力されるデータのこと 以下の二つに大別される 1.

    数値として直接取得できるもの:(温度など) 2. 集計して意味のある数値に変換できるもの:(エラー数など) メトリクスはログなどとは異なり、個々のイベントの情報は持っていない。たとえばある 時間内のエラー数というメトリクスは、個々のエラーに関する情報を失う。 * 1 参考資料:https://www.cncf.io/projects/ * 2 参考資料:https://github.com/cncf/tag- observability/blob/main/whitepaper.md Copyright ©2023 NS Solutions Corporation, IBM Corporation.
  6. 1.“Prometheus”とは? リソースごとにExporterを用意することで、多様な監視対象を簡単に切り替えられる -> なければExporterを自作することもできる 引用:https://prometheus.io/docs/instrumenting/exporters/ Copyright ©2023 NS Solutions Corporation,

    IBM Corporation. •Databases •Aerospike exporter •ClickHouse exporter •Consul exporter (official) •Couchbase exporter •CouchDB exporter •Druid Exporter •Elasticsearch exporter •EventStore exporter •IoTDB exporter •KDB+ exporter •Memcached exporter (official) •MongoDB exporter •MongoDB query exporter •MSSQL server exporter •MySQL router exporter •MySQL server exporter (official) •OpenTSDB Exporter •Oracle DB Exporter •PgBouncer exporter •PostgreSQL exporter •Presto exporter •ProxySQL exporter •RavenDB exporter •Redis exporter •RethinkDB exporter •SQL exporter •Tarantool metric library •Twemproxy •Hardware related •apcupsd exporter •BIG-IP exporter •Bosch Sensortec BMP/BME exporter •Collins exporter •Dell Hardware OMSA exporter •Disk usage exporter •Fortigate exporter •IBM Z HMC exporter •IoT Edison exporter •InfiniBand exporter •IPMI exporter •knxd exporter •Modbus exporter •Netgear Cable Modem Exporter •Netgear Router exporter •Network UPS Tools (NUT) exporter •Node/system metrics exporter (official) •NVIDIA GPU exporter •ProSAFE exporter •Waveplus Radon Sensor Exporter •Weathergoose Climate Monitor Exporter •Windows exporter •Intel® Optane™ Persistent Memory Controller Exporter •HTTP •Apache exporter •HAProxy exporter (official) •Nginx metric library •Nginx VTS exporter •Passenger exporter •Squid exporter •Tinyproxy exporter •Varnish exporter •WebDriver exporter •Other monitoring systems •Akamai Cloudmonitor exporter •Alibaba Cloudmonitor exporter •AWS CloudWatch exporter (official) •Azure Monitor exporter •Cloud Foundry Firehose exporter •Collectd exporter (official) •Google Stackdriver exporter •Graphite exporter (official) •Heka dashboard exporter •Heka exporter •Huawei Cloudeye exporter •InfluxDB exporter (official) •ITM exporter •JavaMelody exporter •JMX exporter (official) •Munin exporter •Nagios / Naemon exporter •New Relic exporter •NRPE exporter •Osquery exporter •OTC CloudEye exporter •Pingdom exporter •Promitor (Azure Monitor) •scollector exporter •Sensu exporter •site24x7_exporter •SNMP exporter (official) •StatsD exporter (official) •TencentCloud monitor exporter •ThousandEyes exporter Exporter(一部抜粋)
  7. 2.“Prometheus”でできること! 引用:https://prometheus.io/docs/introduction/overview/ まずはアーキテクチャから! ① “Prometheus” server “Prometheus”本体 ① ② ③

    ④ ⑤ ⑥ Copyright ©2023 NS Solutions Corporation, IBM Corporation. ② Service discovery 監視対象の情報収集 ③ Exporter / Pushgateway 監視エージェント ④ Alertmanager アラート機能 ⑤ PromQL 独自のQuery Language ⑥ Visualization Web UI or Grafana or API
  8. 2.“Prometheus”でできること! ②Service discovery ・監視対象の情報を自動で収集 -設定はyamlファイルで記述できる ・主要なService Discovery(Kubernetes, AWS, Azure, …)をサポート

    ・Pull型のデメリットの一つを解消 Service discovery Kubernetes file_sd Copyright ©2023 NS Solutions Corporation, IBM Corporation. 対応しているSD一覧:https://prometheus.io/docs/prometheus/latest/configuration/configuration/ Sample
  9. 2.“Prometheus”でできること! ③Exporter / Pushgateway ・Exporter Prometheusの監視エージェント 数百種類のExporterが用意されている Exporter:https://prometheus.io/download/ Short-lived jobs

    Pushgateway Push metrics at exit Jobs / exporters Pull metrics Copyright ©2023 NS Solutions Corporation, IBM Corporation. ・設定するには… 公式サイトから対象サーバーにダウンロード、実行 自動で設定されるURLにアクセスするとメトリクスデータを取得 https://<対象のサーバ>:<ExporterのPort番号>/metrics
  10. 2.“Prometheus”でできること! ③Exporter / Pushgateway ・Exporterのサンプル node_exporter ポート 9100 Unix系のCPU、メモリ、ディスクI/O、ネットワーク、… 同じサーバ系のExporterとしてwindows_exporterなどがある

    Exporter and Integrations:https://prometheus.io/docs/instrumenting/exporters/ Copyright ©2023 NS Solutions Corporation, IBM Corporation. Short-lived jobs Pushgateway Push metrics at exit Jobs / exporters Pull metrics 【主なメトリクス】 node_cpu_seconds_total node_cpu_guest_seconds_total node_filesystem_avail_bytes node_filesystem_device_error node_filesystem_files node_disk_info node_disk_flush_requests_time_seconds_total node_disk_flush_requests_total node_disk_discards_merged_total …etc. 【主なメトリクス】 nginx_connections_accepted nginx_connections_active nginx_connections_hold nginx_connections_reading apache_access_total apache_cpu_load apache_up apache_workers …etc. Web系 exporter ポート 9110, 9113,… nginx_exporter, apache_exporter, …
  11. 2.“Prometheus”でできること! ⑤PromQL ・Prometheus Query Language ・Prometheusの時系列データを取得・集計するための検索言語 Copyright ©2023 NS Solutions

    Corporation, IBM Corporation. TSDBでの保管データ -メトリクス名、ラベル、値がセットで保存されている メトリクス ラベル 値 時間 http_requests_total address:172.0.. cluster: cluster1 10 2023/07/06 10:00:00 http_requests_total address: 172.0.. cluster: cluster1 3 2023/07/06 10:10:00
  12. 2.“Prometheus”でできること! ⑤PromQL ・PromQLサンプル http_requests_total:受信したHTTPリクエストの総数を返す(リターンデータは時系列ごと) PromQL公式ドキュメント:https://prometheus.io/docs/prometheus/latest/querying/basics/ Copyright ©2023 NS Solutions Corporation,

    IBM Corporation. http_requests_total{label}:ラベルで絞り込んだ総数 ex. http_requests_total{code=“200”}:ステータスコードとして200が返ってきた総数 http_requests_total[time range]:期間で絞り込んだ総数 ex. http_requests_total[5m]:5分間の総数 http_requests_total{label}[time range]の様に複合的に使うのもOK 四則演算・関数 http_requests_toal * 10:リクエスト総数を10倍した数 sum(http_requests_total):総数の和
  13. 2.“Prometheus”でできること! 引用:https://prometheus.io/docs/introduction/overview/ 2章のまとめ ① “Prometheus” server -メトリクス取得のリクエスト -時系列データの保管、アラートルールの評価 ② Service

    discovery 監視対象の構成の自動情報(主要な構成管理ツールをカバー) ③ Exporter / Pushgateway 監視エージェント / バッチなどの処理データも収集 ④ Alertmanager アラート機能 ⑤ PromQL 独自の検索言語 ⑥ Visualization PromQLで抽出したデータを可視化 ① ② ③ ④ ⑤ ⑥ Copyright ©2023 NS Solutions Corporation, IBM Corporation.
  14. QA Copyright ©2023 NS Solutions Corporation, IBM Corporation. Q.「Pull型とありますが、クラウド上に“Prometheus”を設置し、オンプレミスサーバの監視を行いたい場合、データは どのように取得するのでしょうか?

    Pushgatewayを使うのが一般的でしょうか?」 A. オンプレミスサーバとクラウド上でNATを介して接続する環境の前提で回答いたします。 オンプレミスサーバと同じネットワーク内(NATを介さない環境)に“Prometheus”を設置して、 Pushgatewayを利用しない構成が推奨されています。 ネットワークを分ける必要がある場合(NAT環境)はPushgatewayでの対応になる可能性がありますが、 Pushgatewayの利用にも注意事項がございますので公式ドキュメントを参考に運用方法をご検討ください。 (引用元:https://prometheus.io/docs/practices/pushing/) Q.「“Prometheus”とZabbixなど、複数の監視ツールを併用して使うような事例というのはあるんでしょうか? もし ある場合、どう使い分けているか教えてほしい。」 A. Public Cloud環境の場合、利用しているPublic Cloudが提供している監視サービスと監視ツールが 自然と併用されることになりますので、そのような事例が多いのではないかと考えます。 (Ex. Amazon Web ServicesのCloudWatchと“Prometheus”の場合、取得できるデータにも違いがあり相互にデータ 連携などをして補完している) Q. 「“Prometheus”の費用は?」 A. “Prometheus”はOSSになりますので製品の費用は無料になっています。 ただし、“Prometheus”を動作させるサーバ等はご準備いただく必要があります。 クラウドのマネージドサービスの場合は、その費用がかかる場合もございます。