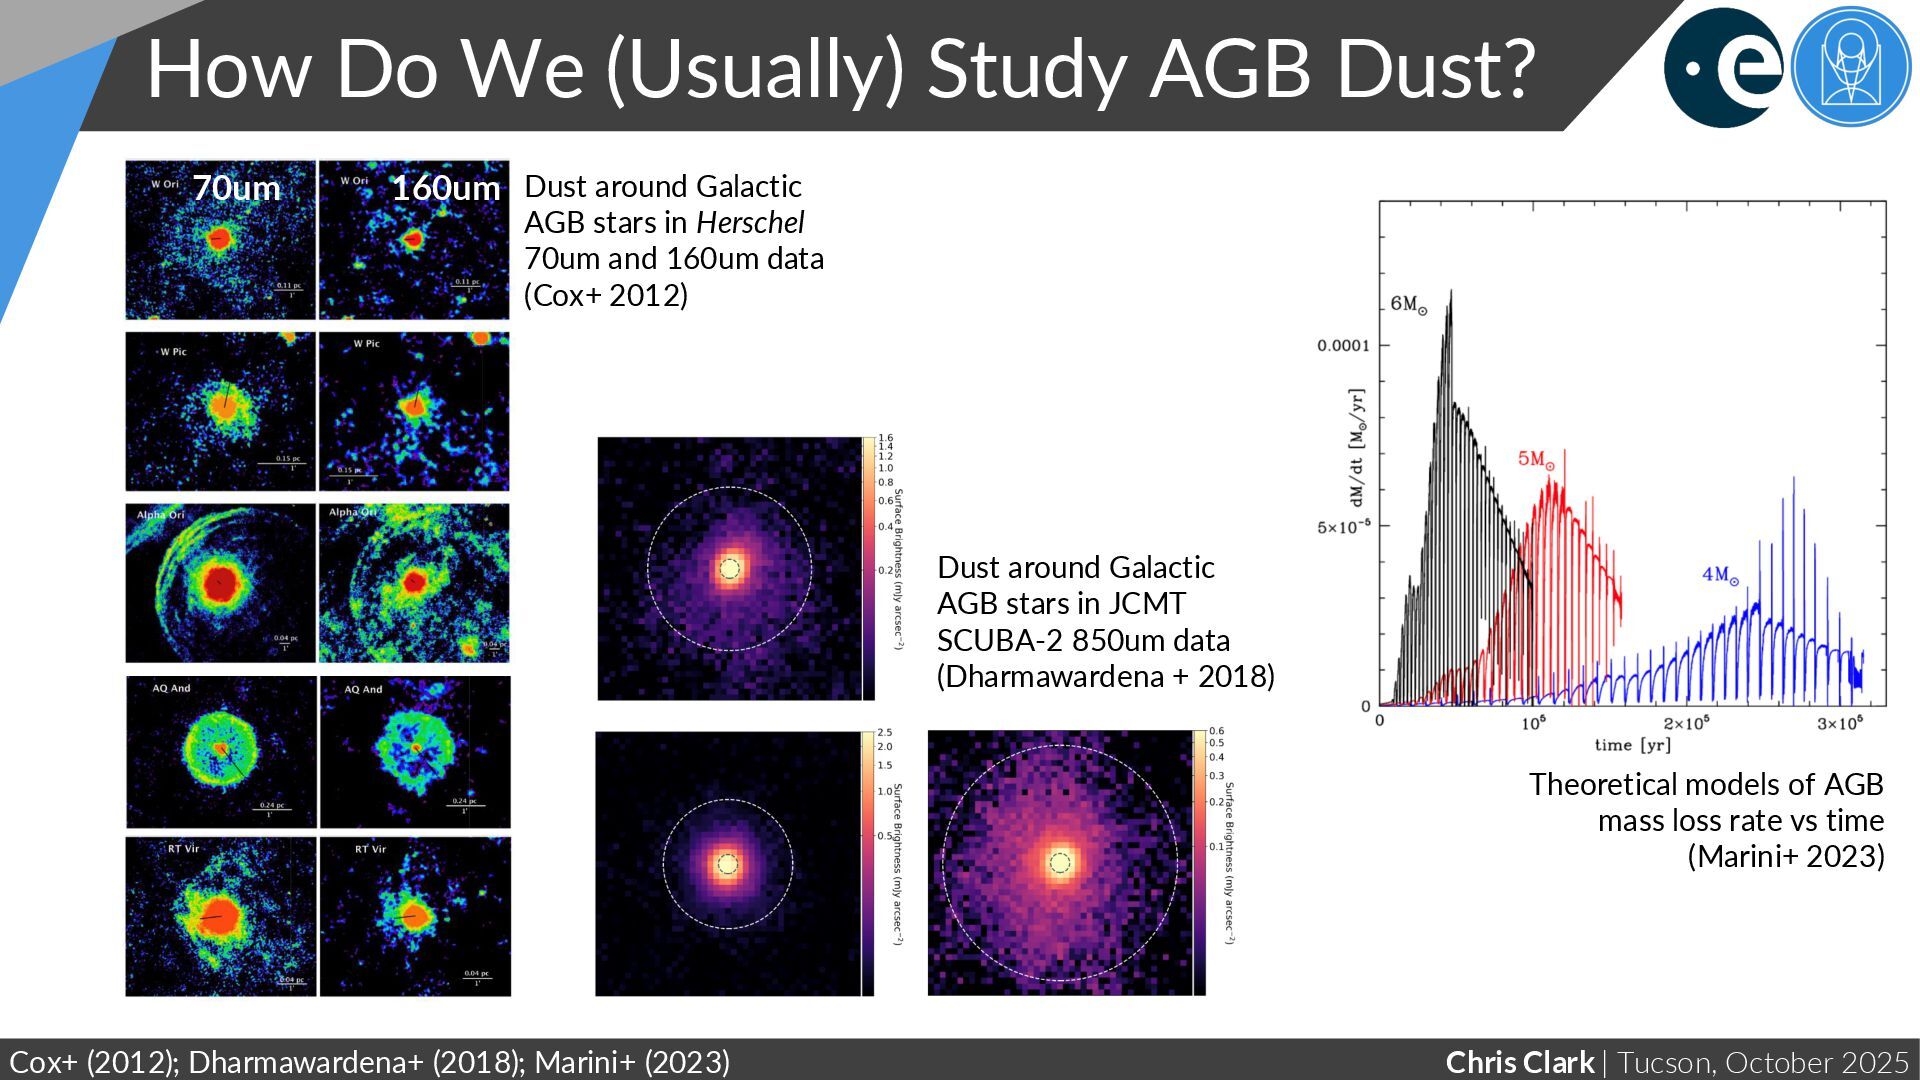
Study AGB Dust? Cox+ (2012); Dharmawardena+ (2018); Marini+ (2023) Dust around Galactic AGB stars in Herschel 70um and 160um data (Cox+ 2012) 70um 160um Theoretical models of AGB mass loss rate vs time (Marini+ 2023) Dust around Galactic AGB stars in JCMT SCUBA-2 850um data (Dharmawardena + 2018)
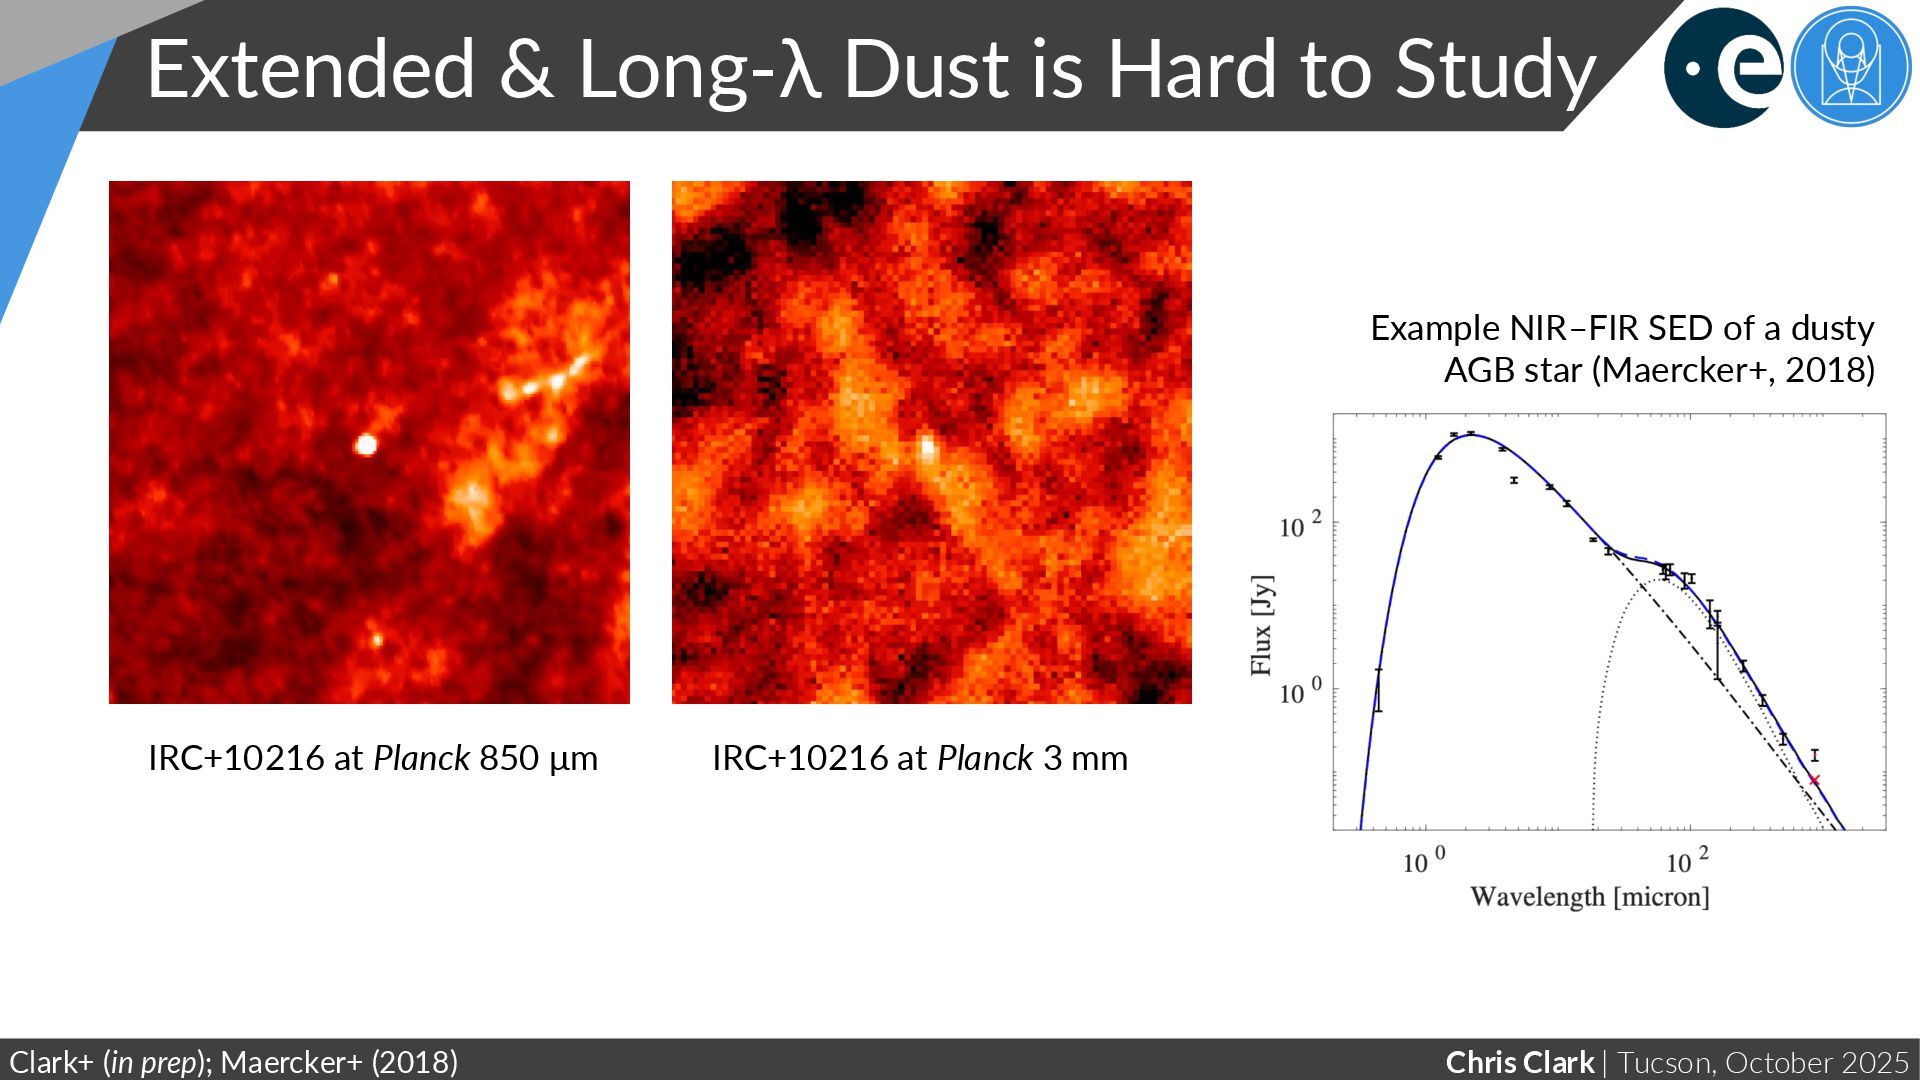
is Hard to Study Clark+ (in prep); Maercker+ (2018) IRC+10216 at Planck 850 μm IRC+10216 at Planck 3 mm Example NIR–FIR SED of a dusty AGB star (Maercker+, 2018)
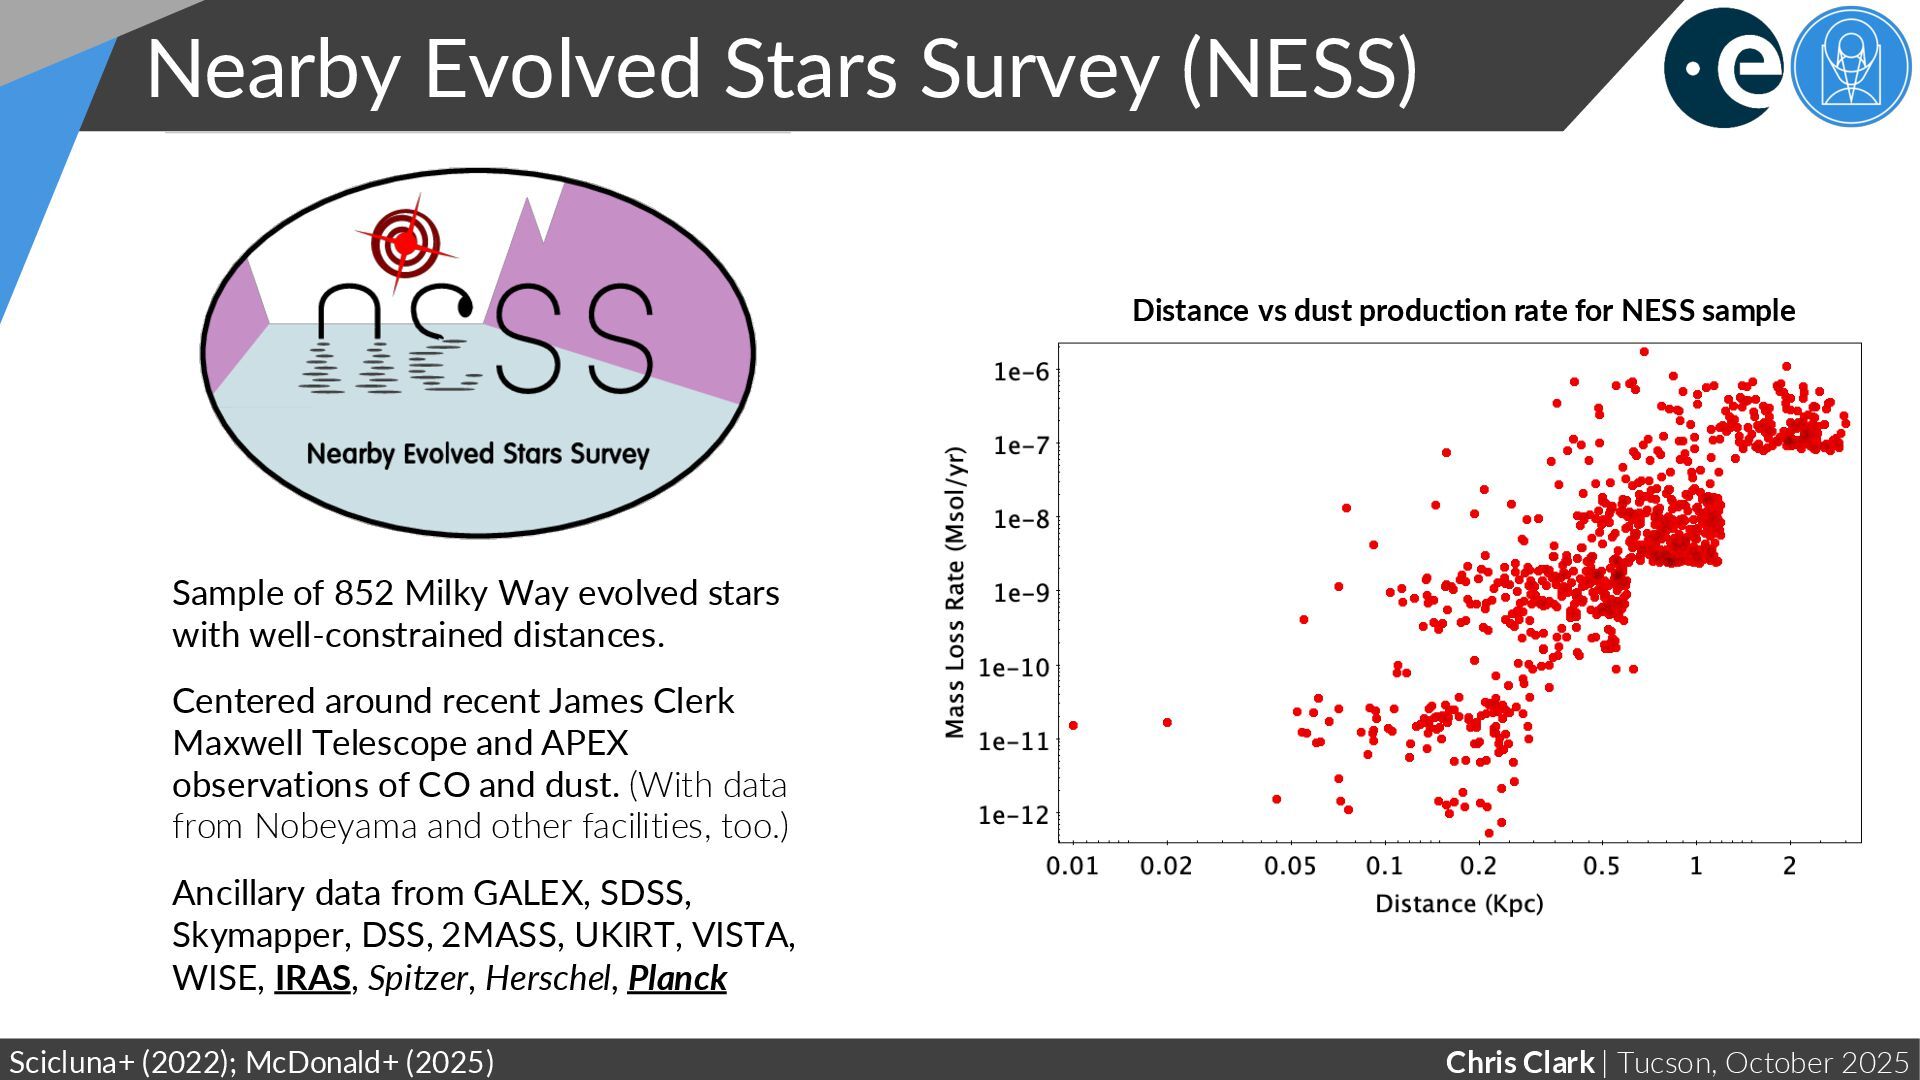
(NESS) Scicluna+ (2022); McDonald+ (2025) Sample of 852 Milky Way evolved stars with well-constrained distances. Centered around recent James Clerk Maxwell Telescope and APEX observations of CO and dust. (With data from Nobeyama and other facilities, too.) Ancillary data from GALEX, SDSS, Skymapper, DSS, 2MASS, UKIRT, VISTA, WISE, IRAS, Spitzer, Herschel, Planck Distance vs dust production rate for NESS sample
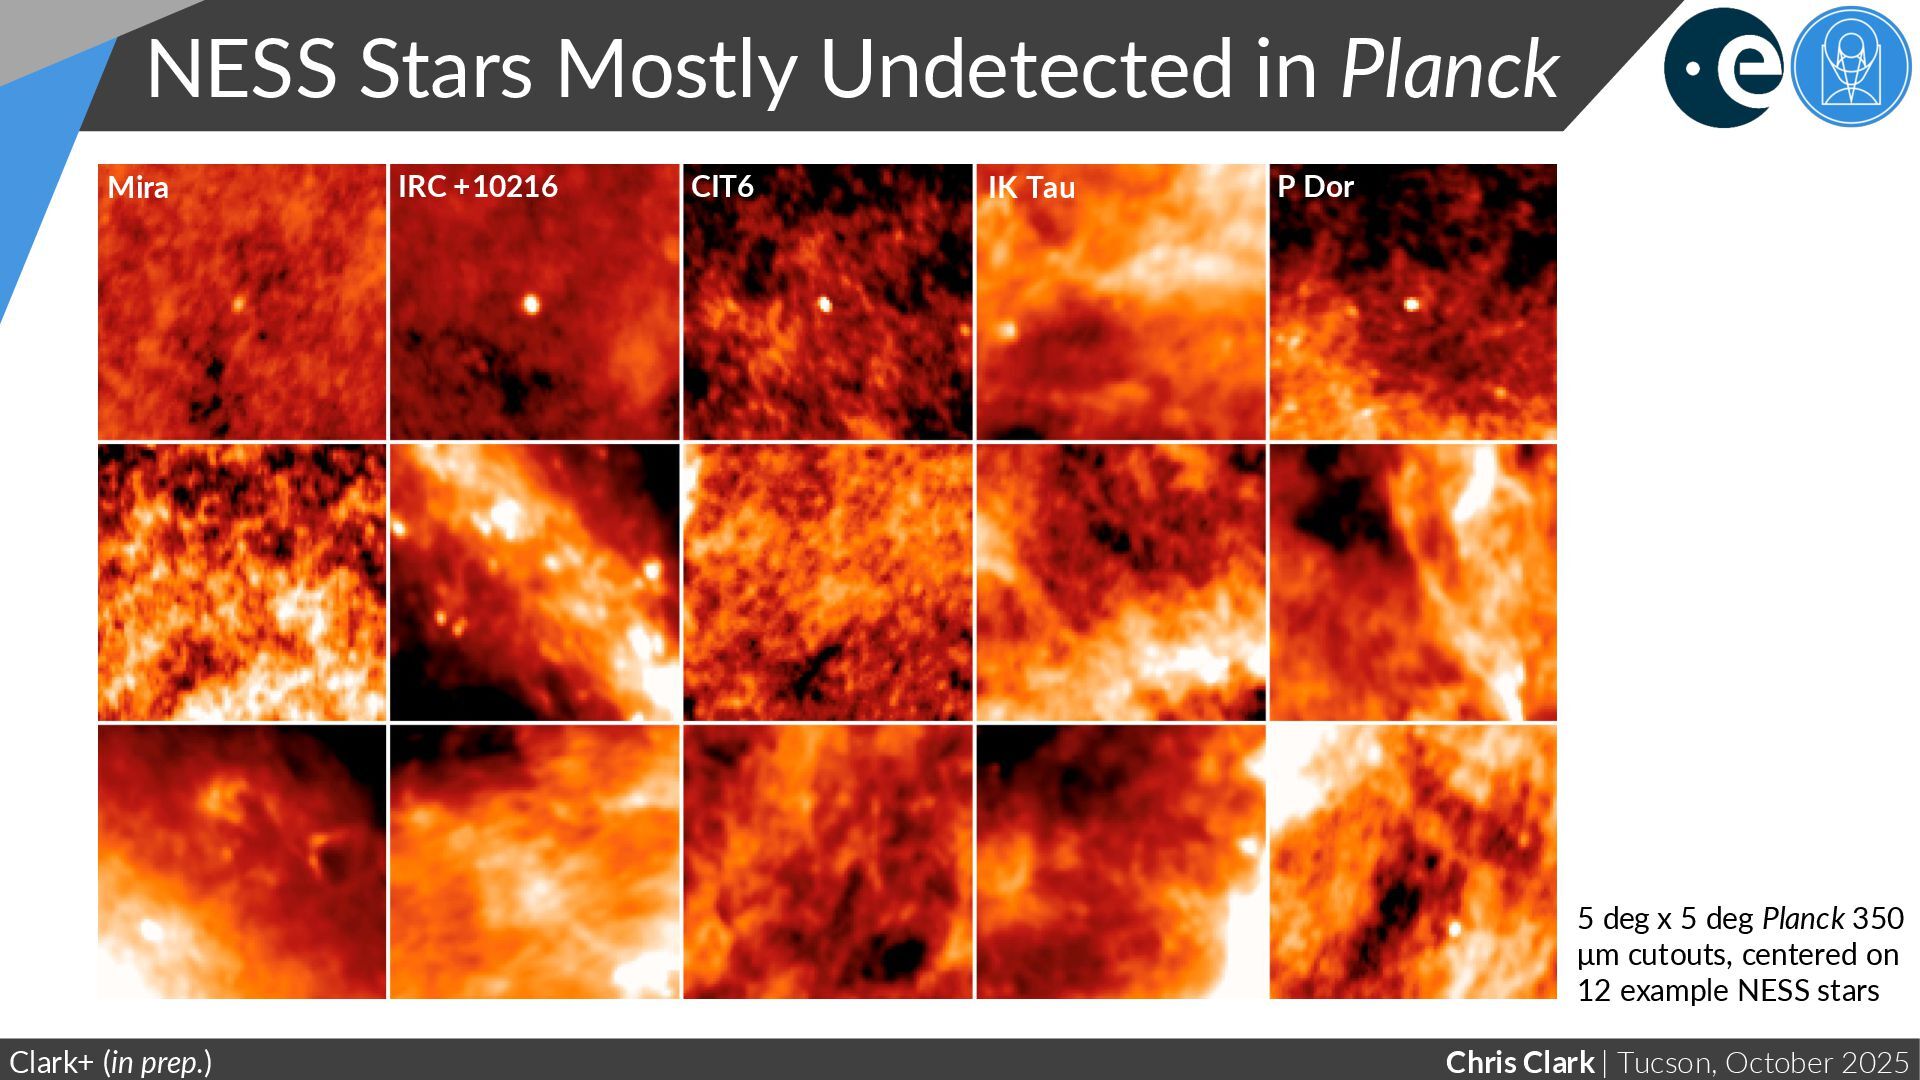
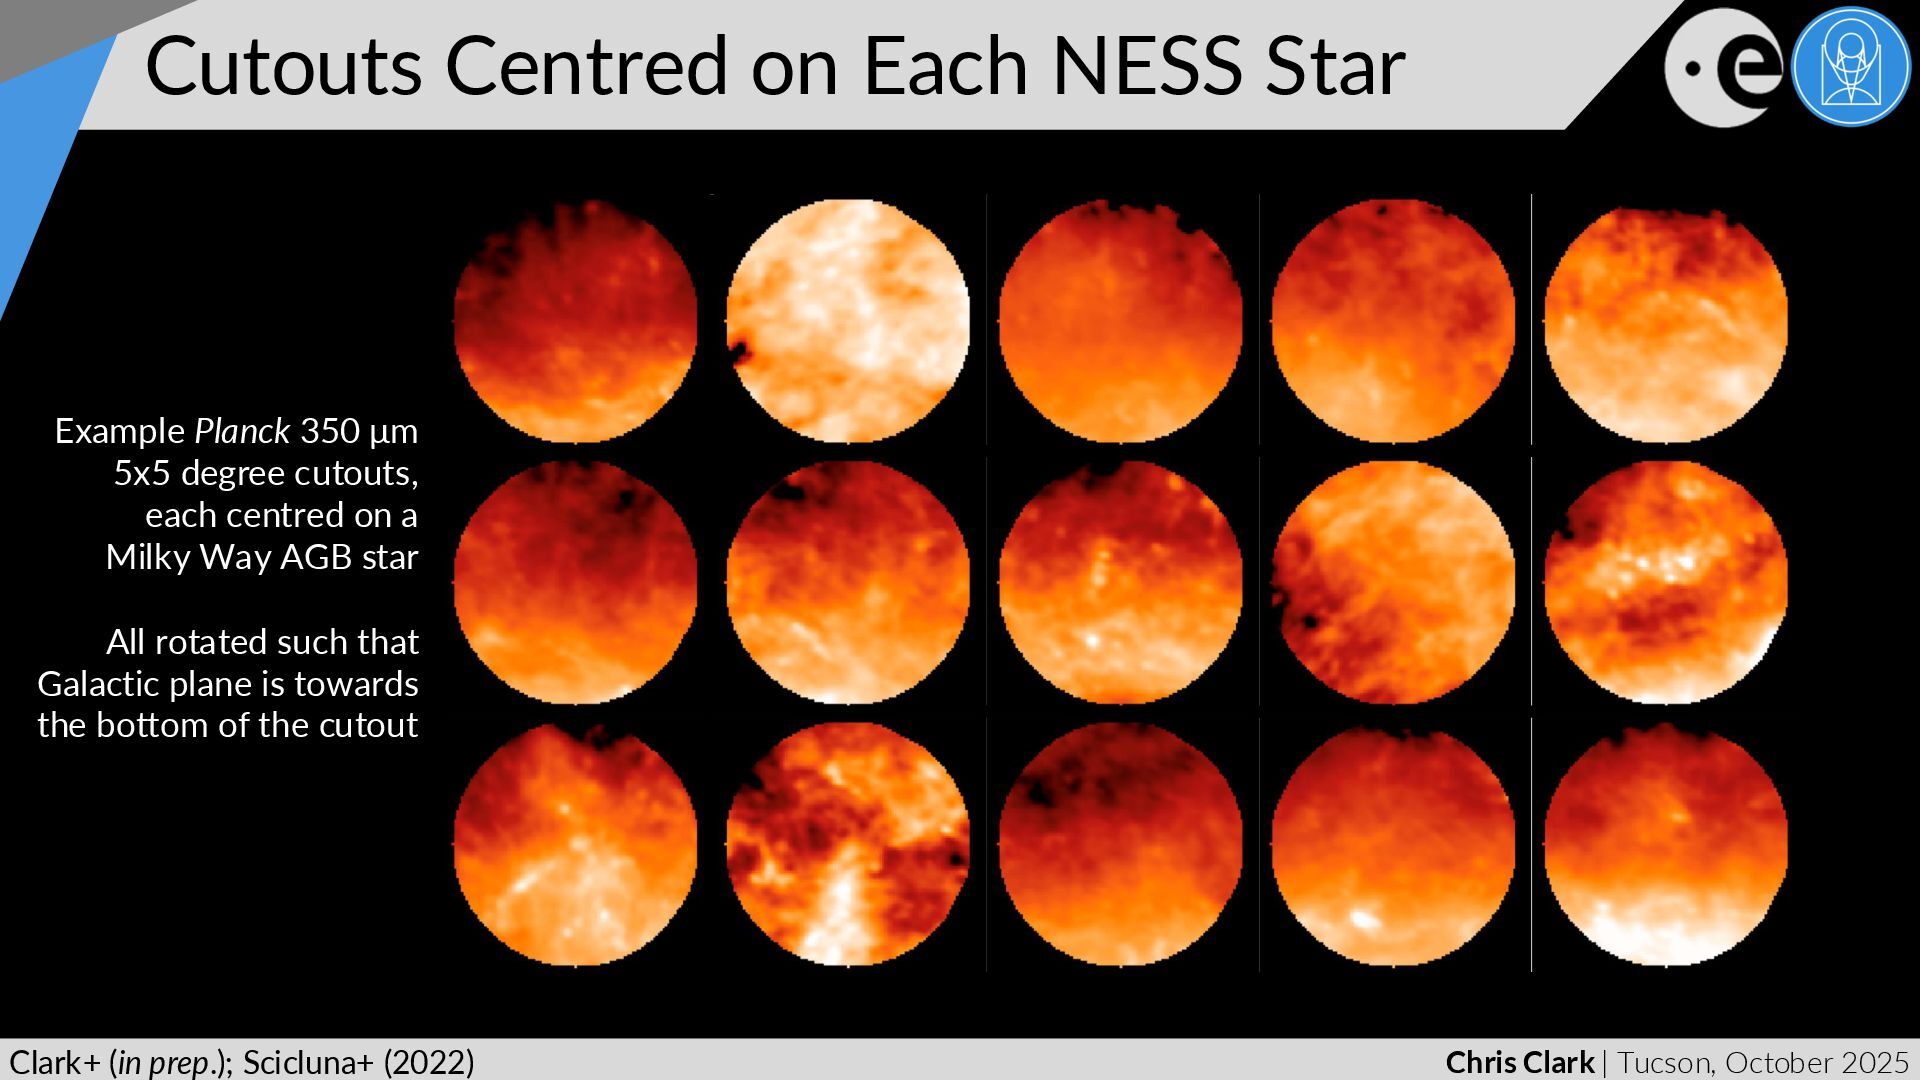
NESS Star Clark+ (in prep.); Scicluna+ (2022) Example Planck 350 μm 5x5 degree cutouts, each centred on a Milky Way AGB star All rotated such that Galactic plane is towards the bottom of the cutout
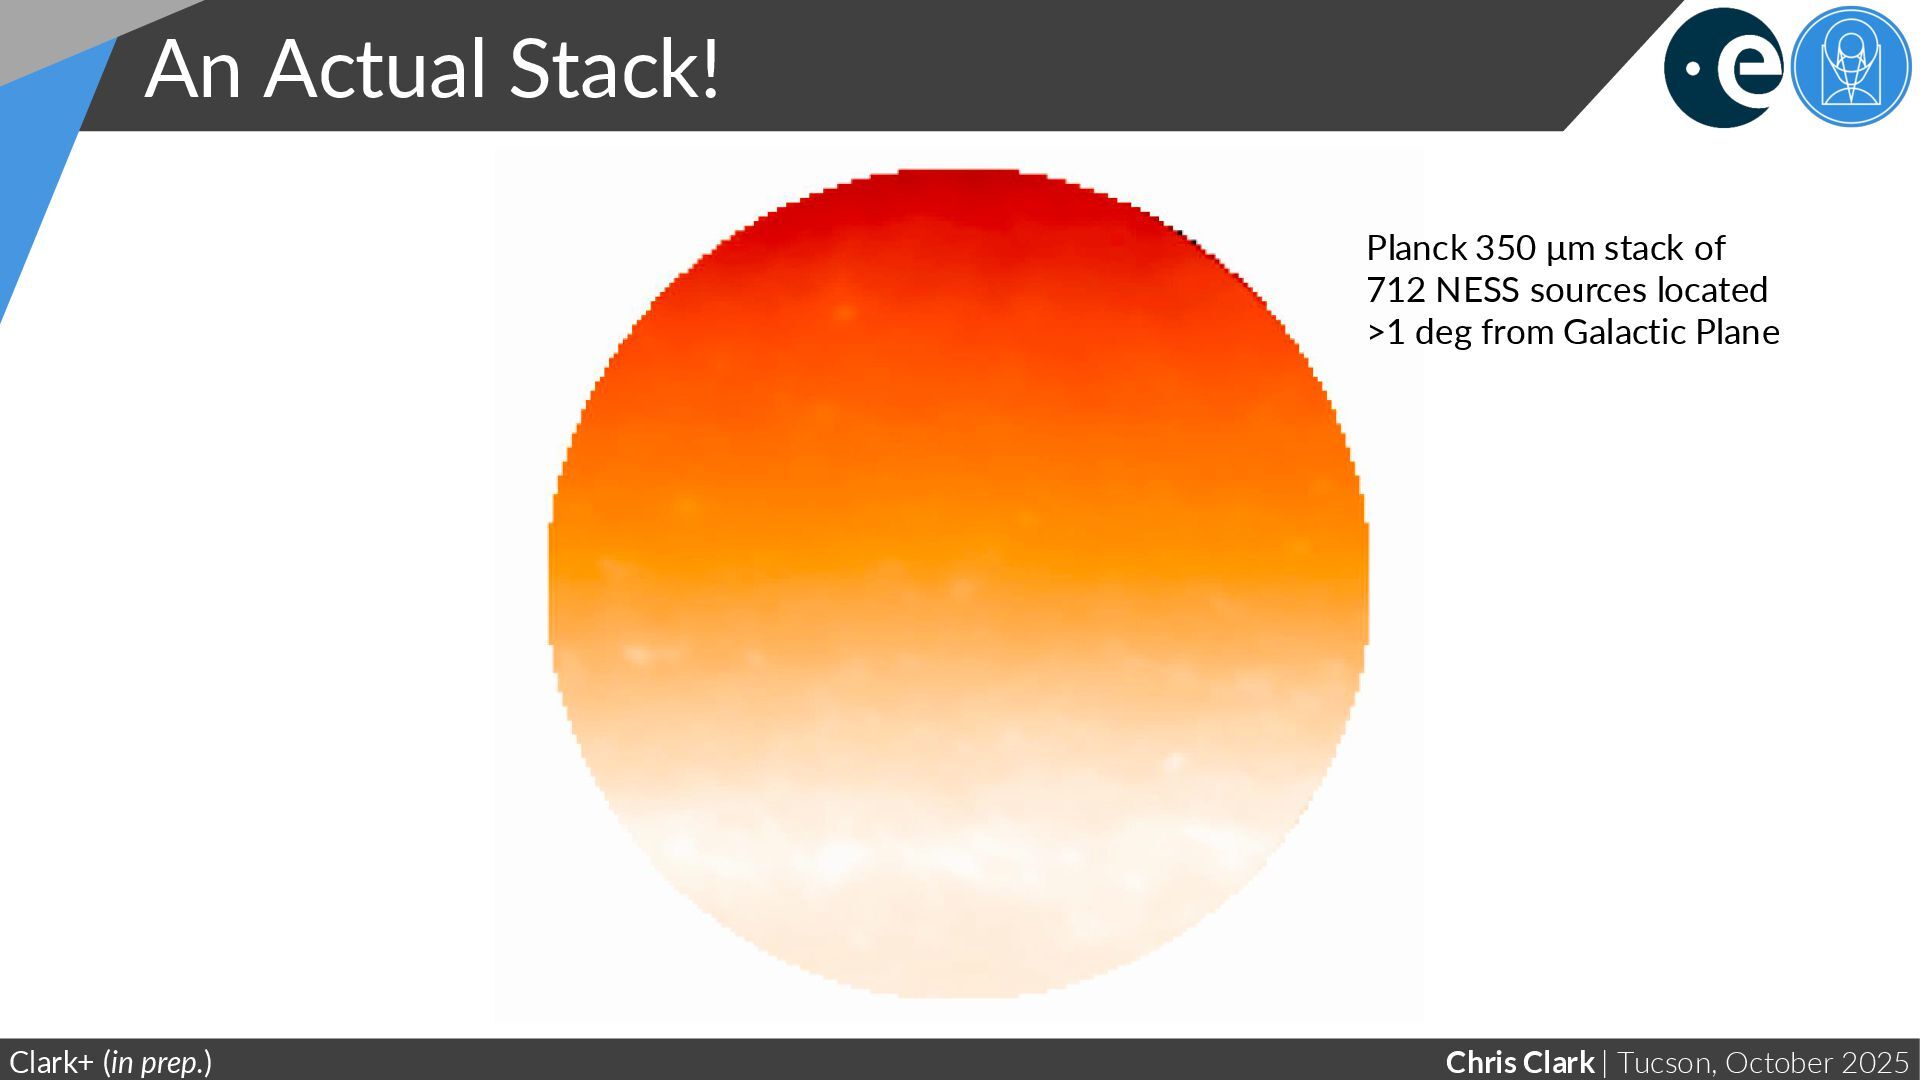
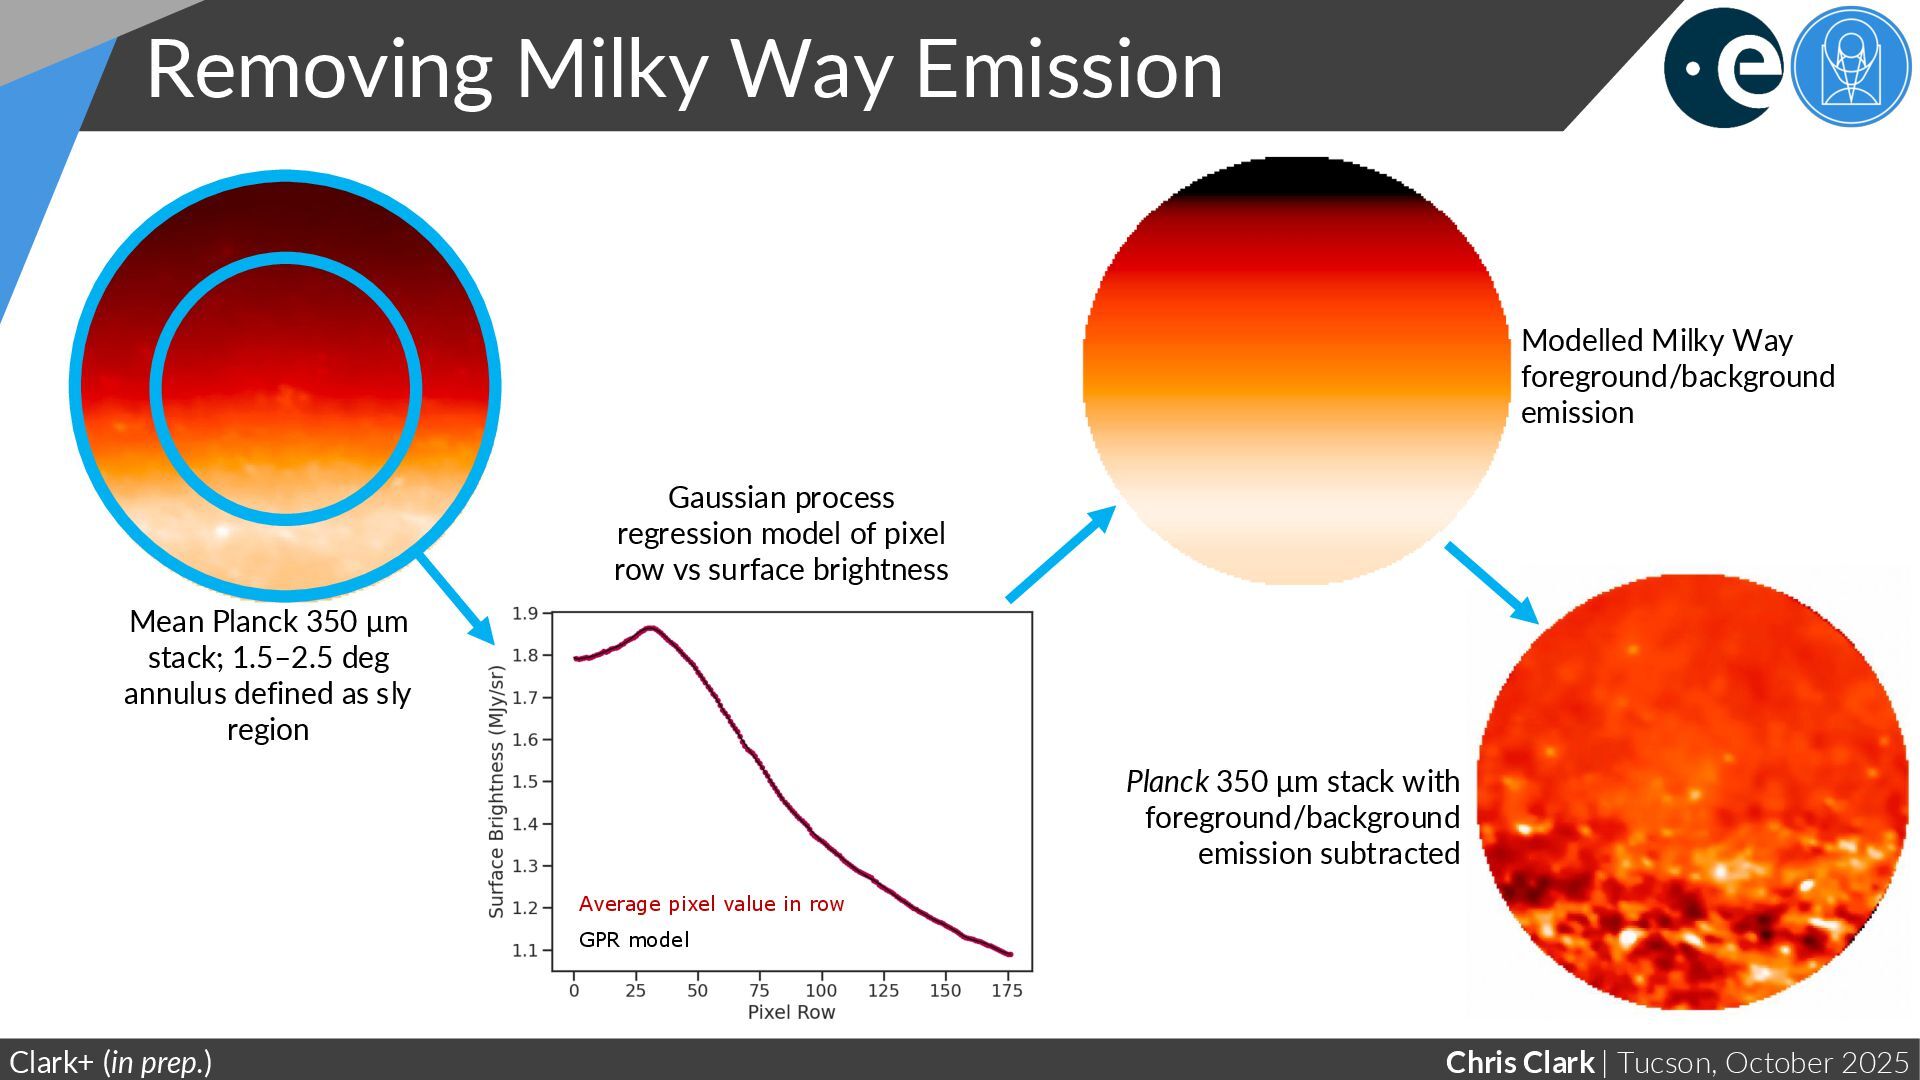
Clark+ (in prep.) Planck 350 μm stack with foreground/background emission subtracted Gaussian process regression model of pixel row vs surface brightness Mean Planck 350 μm stack; 1.5–2.5 deg annulus defined as sly region Average pixel value in row GPR model Modelled Milky Way foreground/background emission
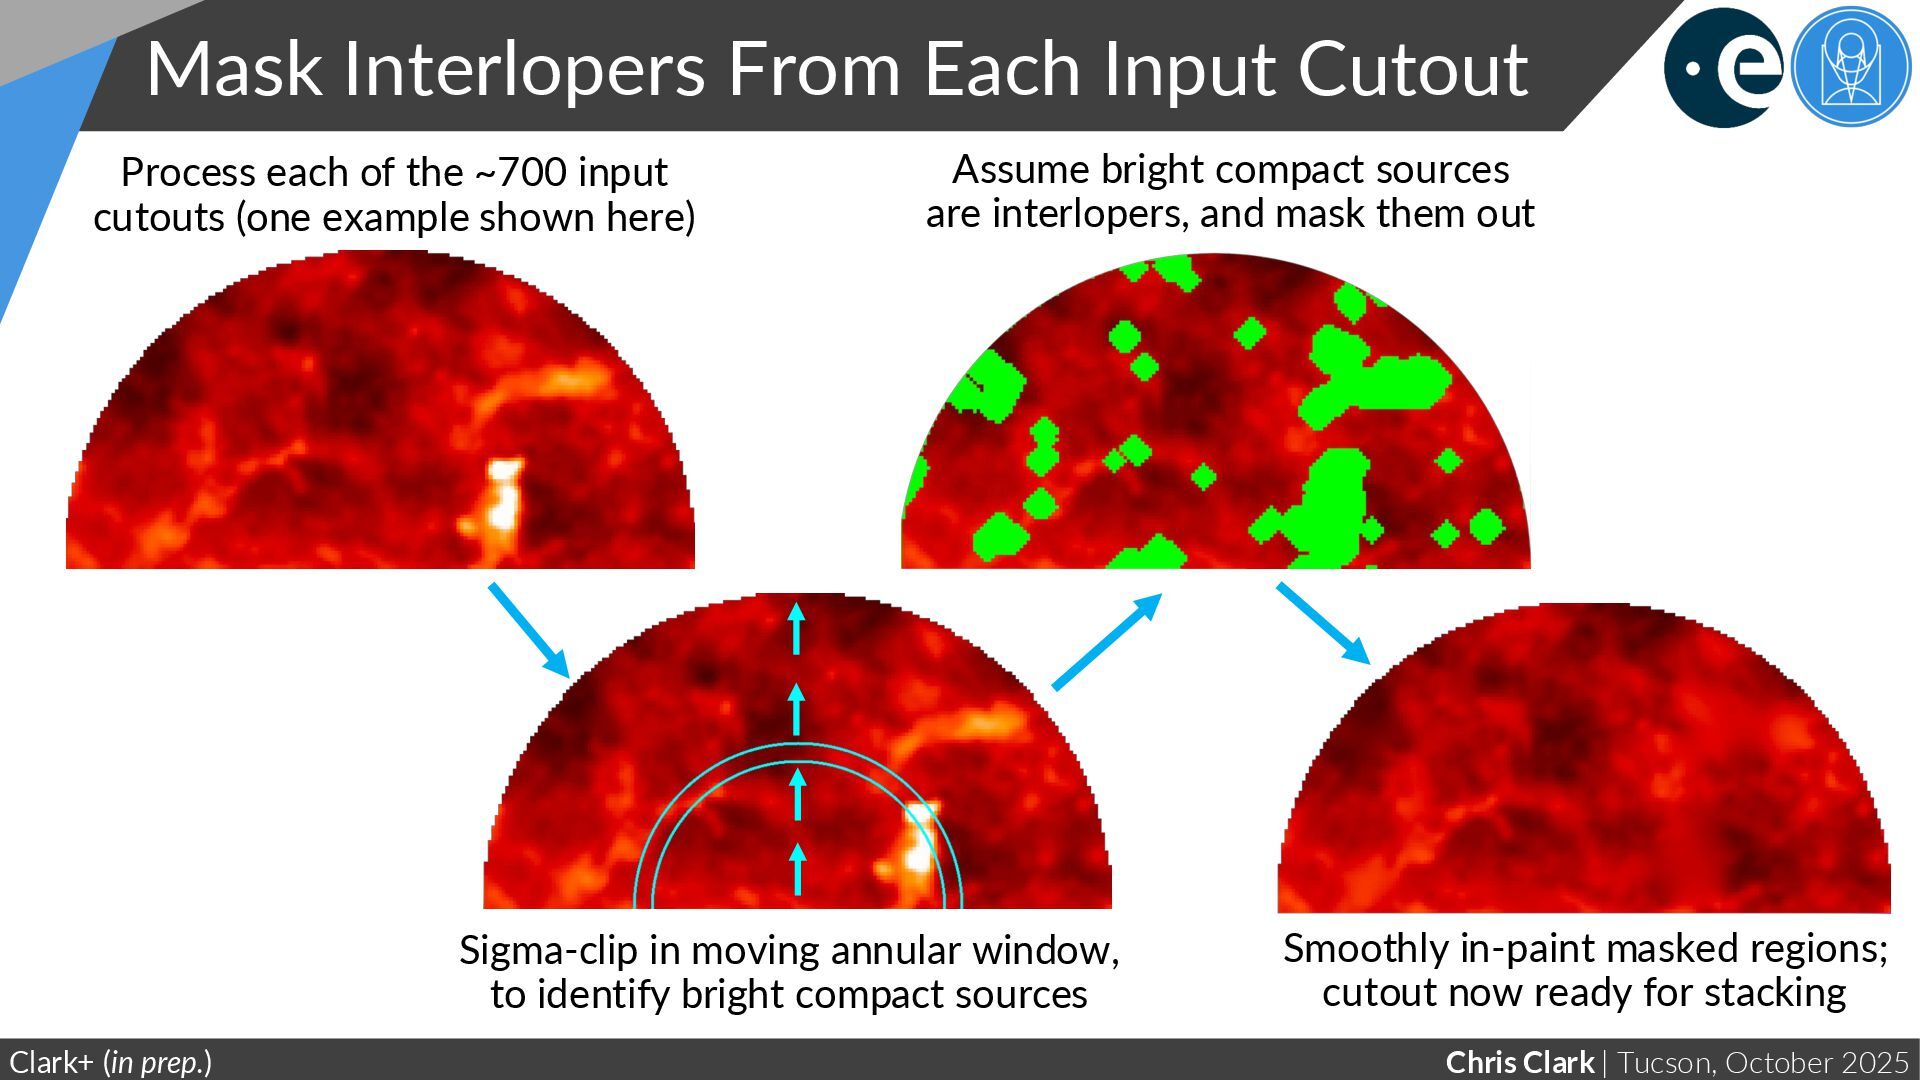
Input Cutout Clark+ (in prep.) Sigma-clip in moving annular window, to identify bright compact sources Process each of the ~700 input cutouts (one example shown here) Assume bright compact sources are interlopers, and mask them out Smoothly in-paint masked regions; cutout now ready for stacking
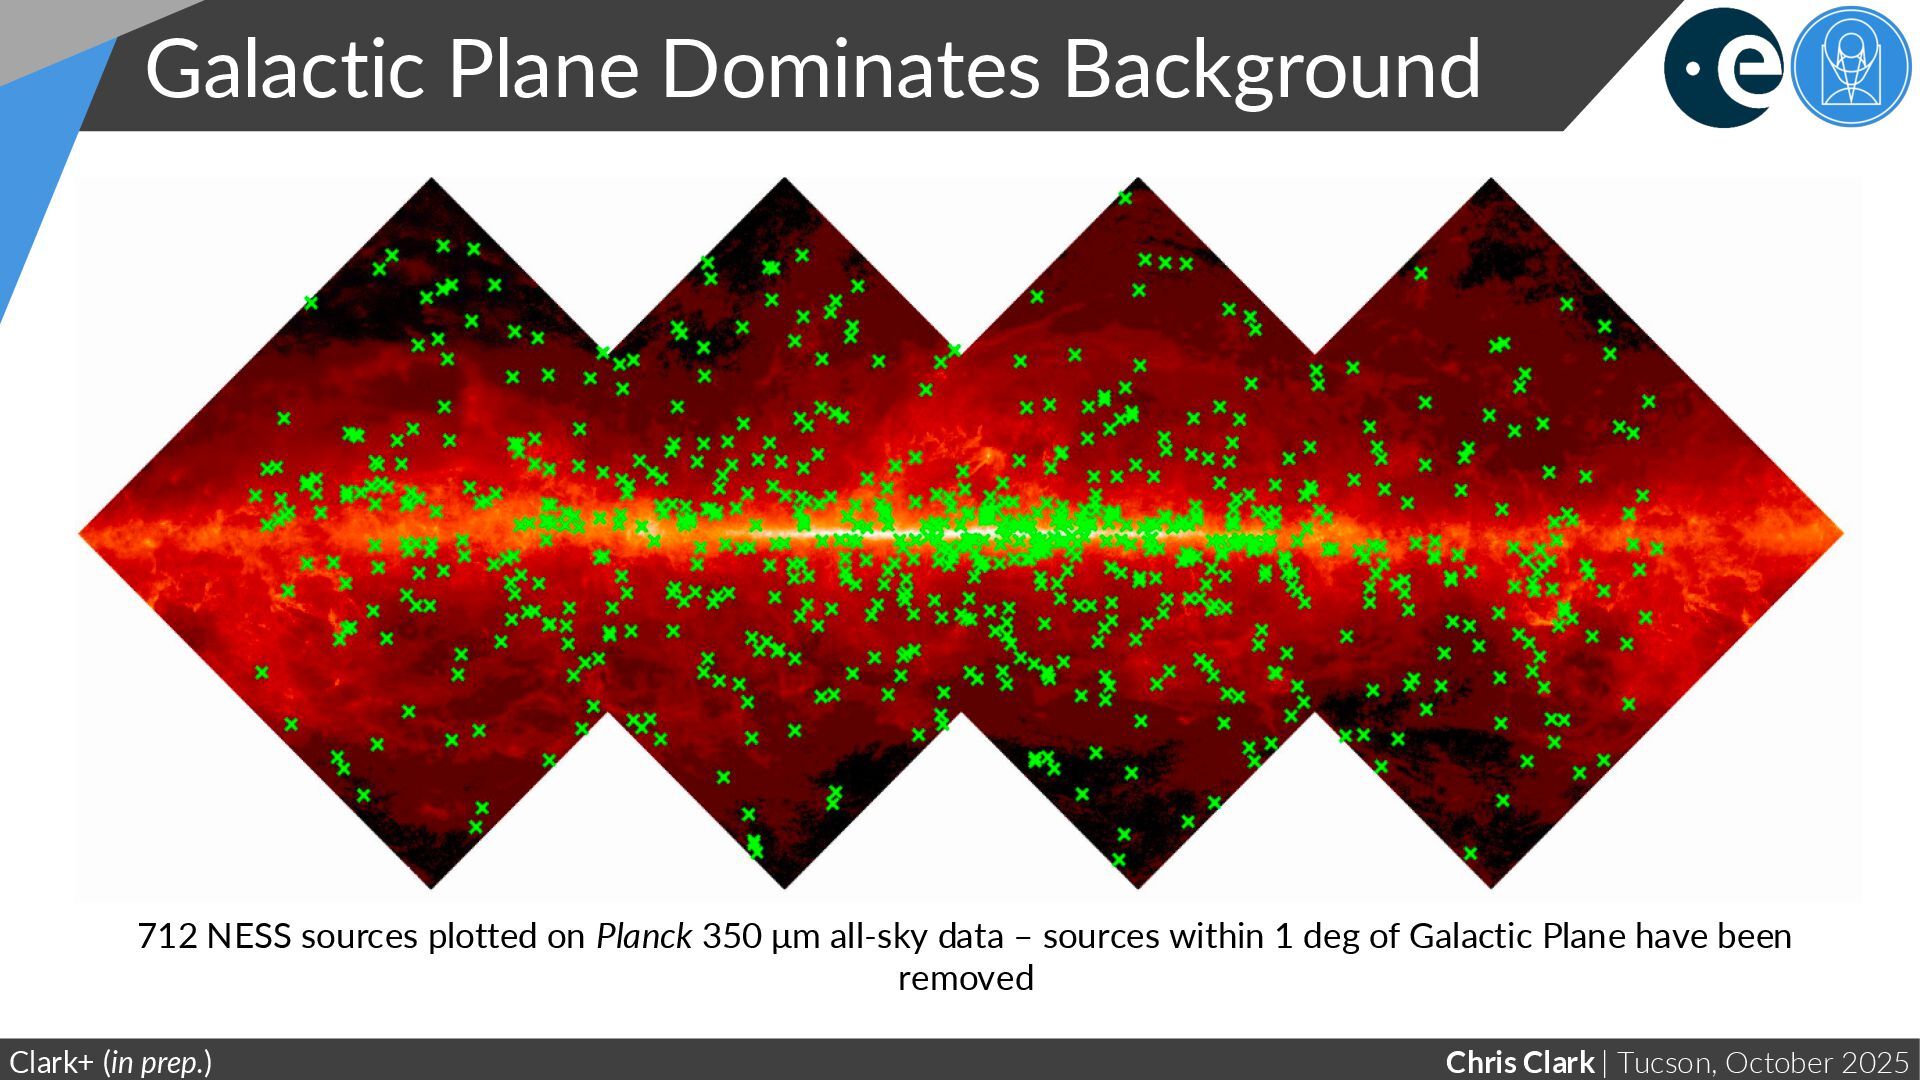
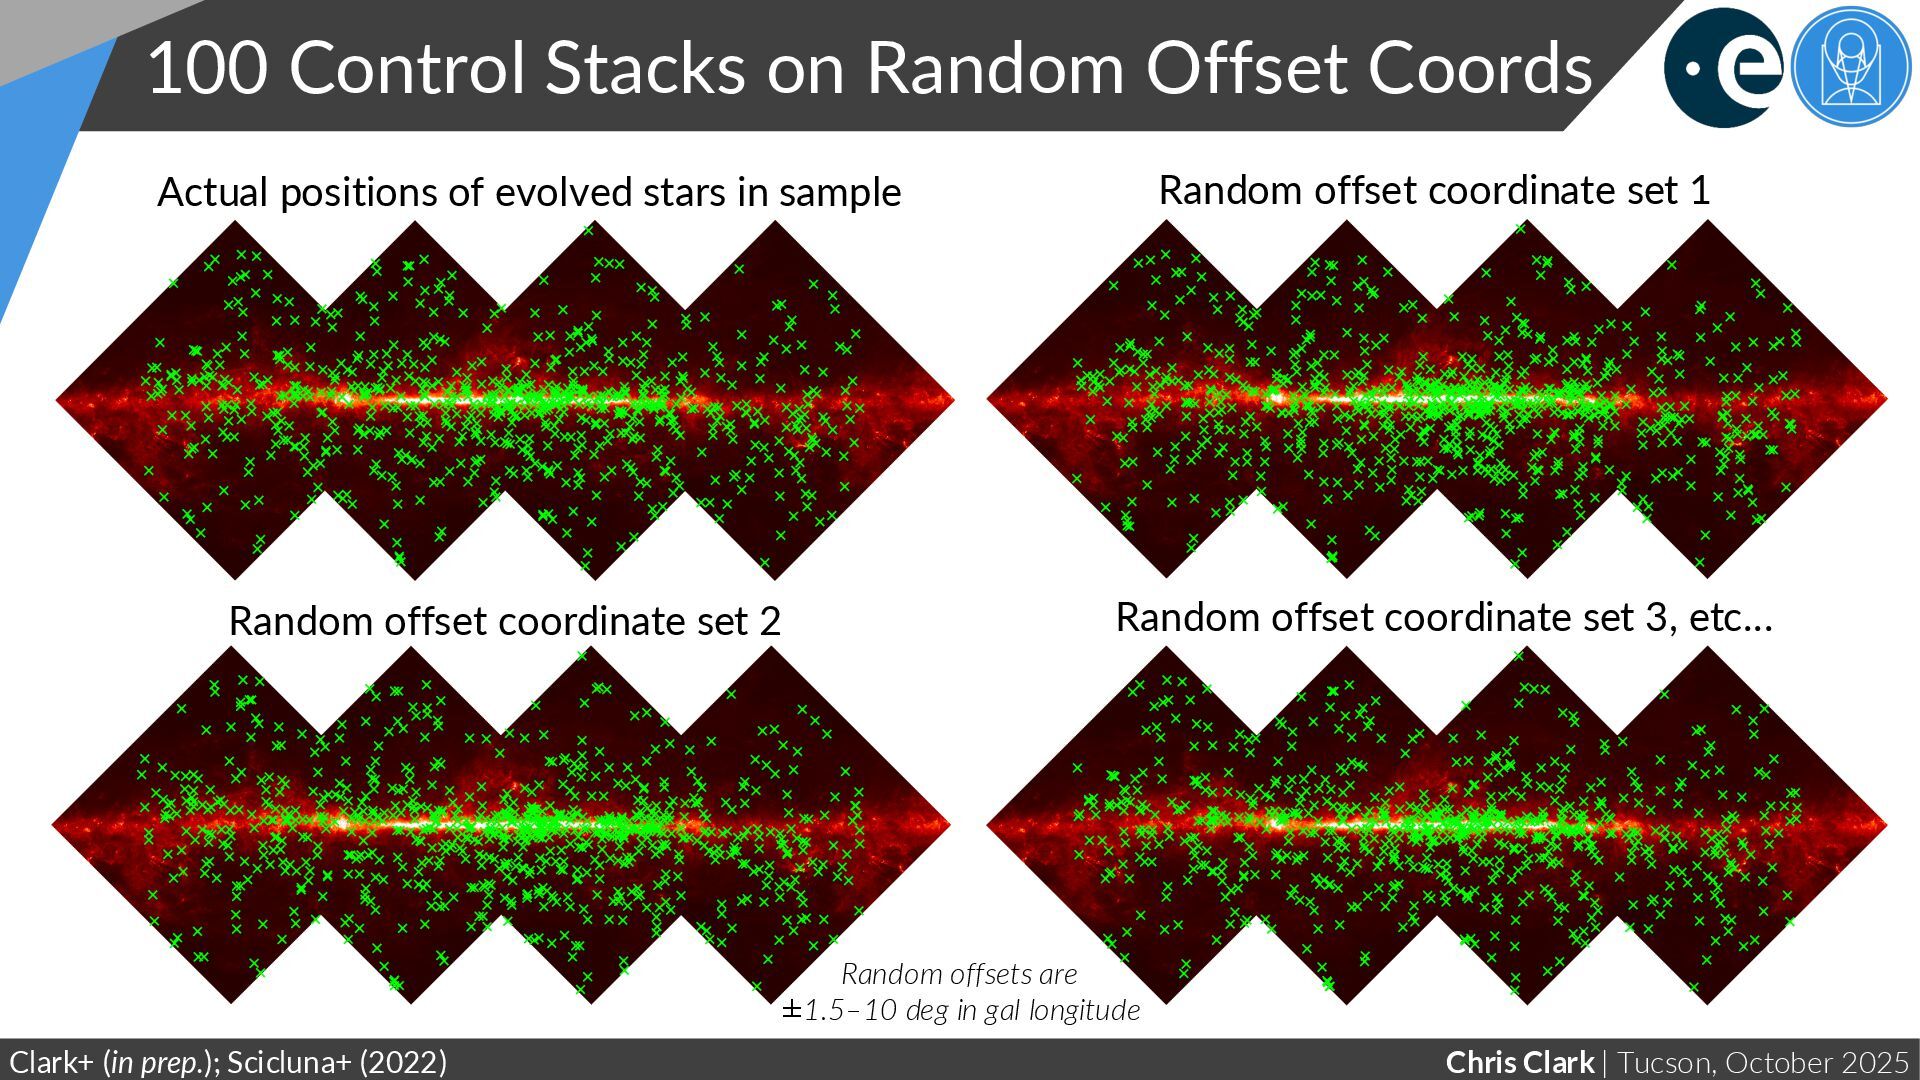
Random Offset Coords Clark+ (in prep.); Scicluna+ (2022) Actual positions of evolved stars in sample Random offset coordinate set 1 Random offset coordinate set 2 Random offset coordinate set 3, etc… Random offsets are ±1.5–10 deg in gal longitude
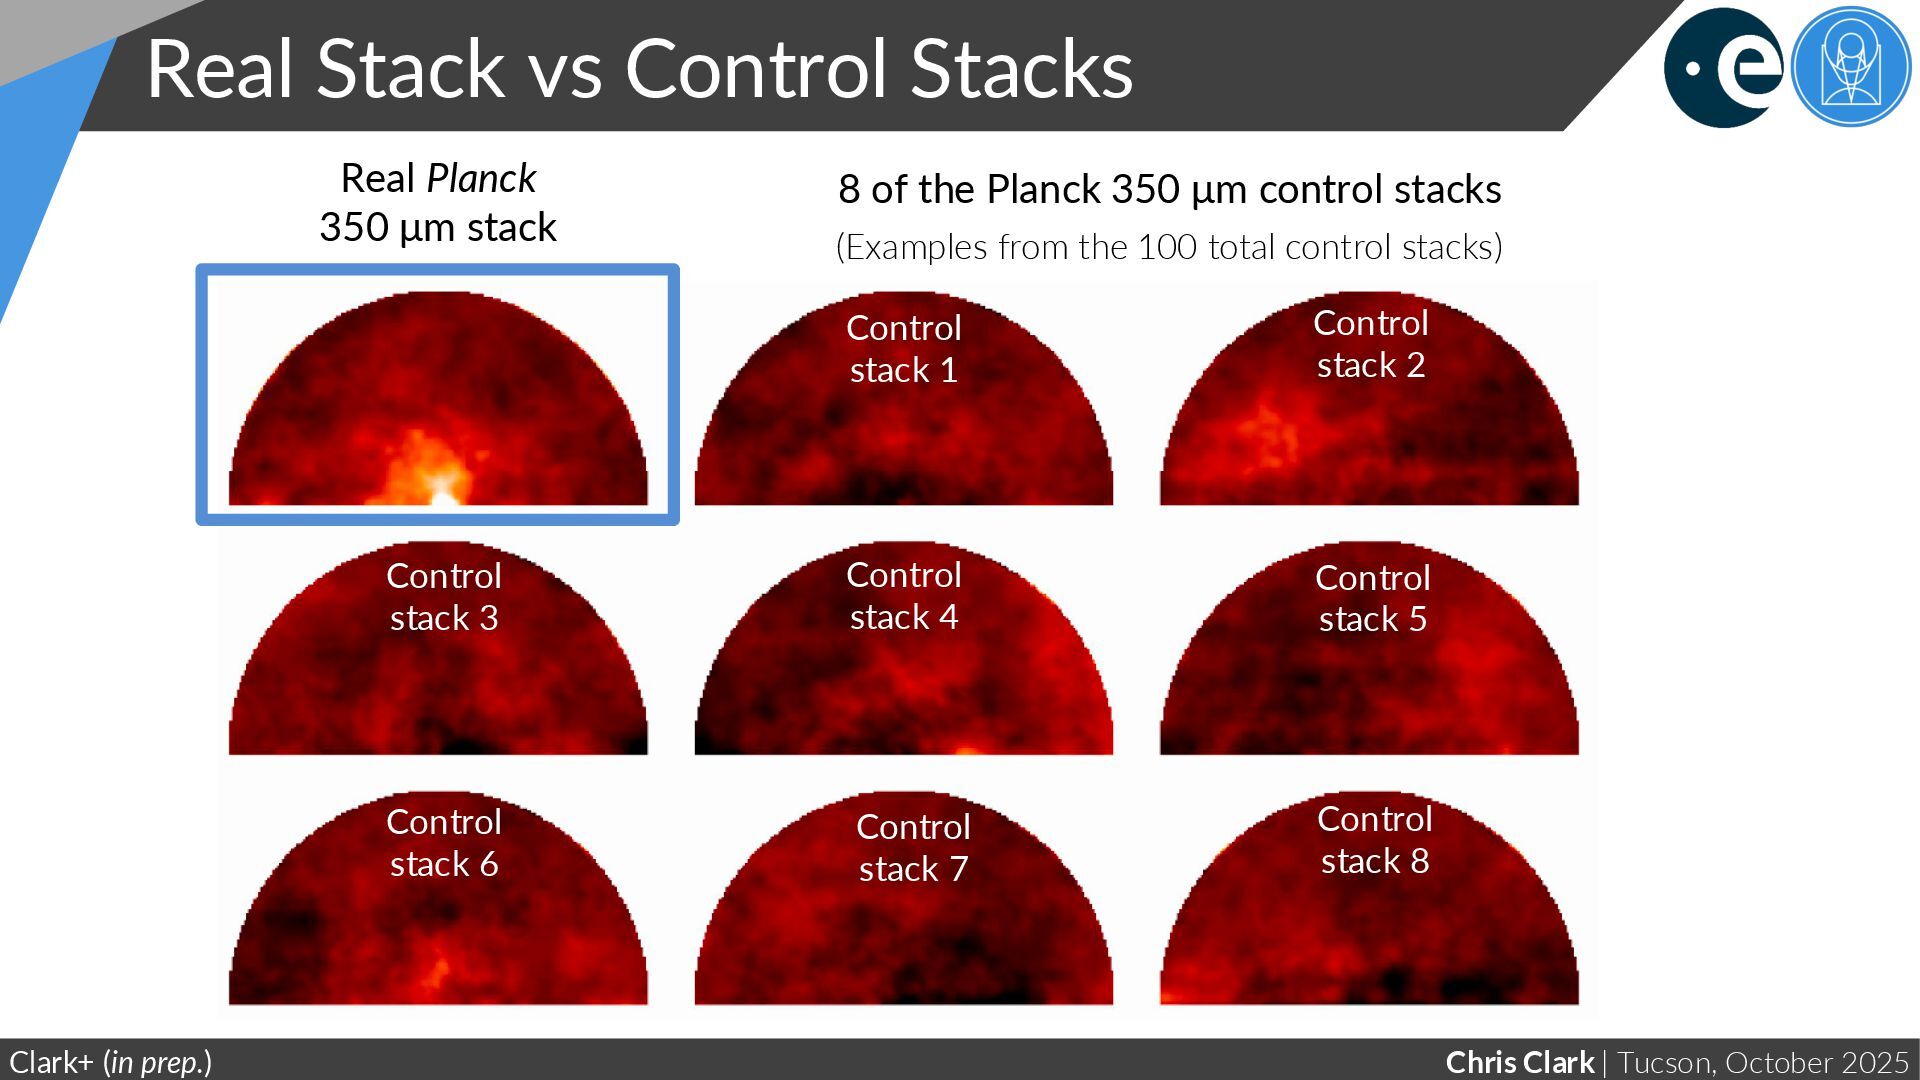
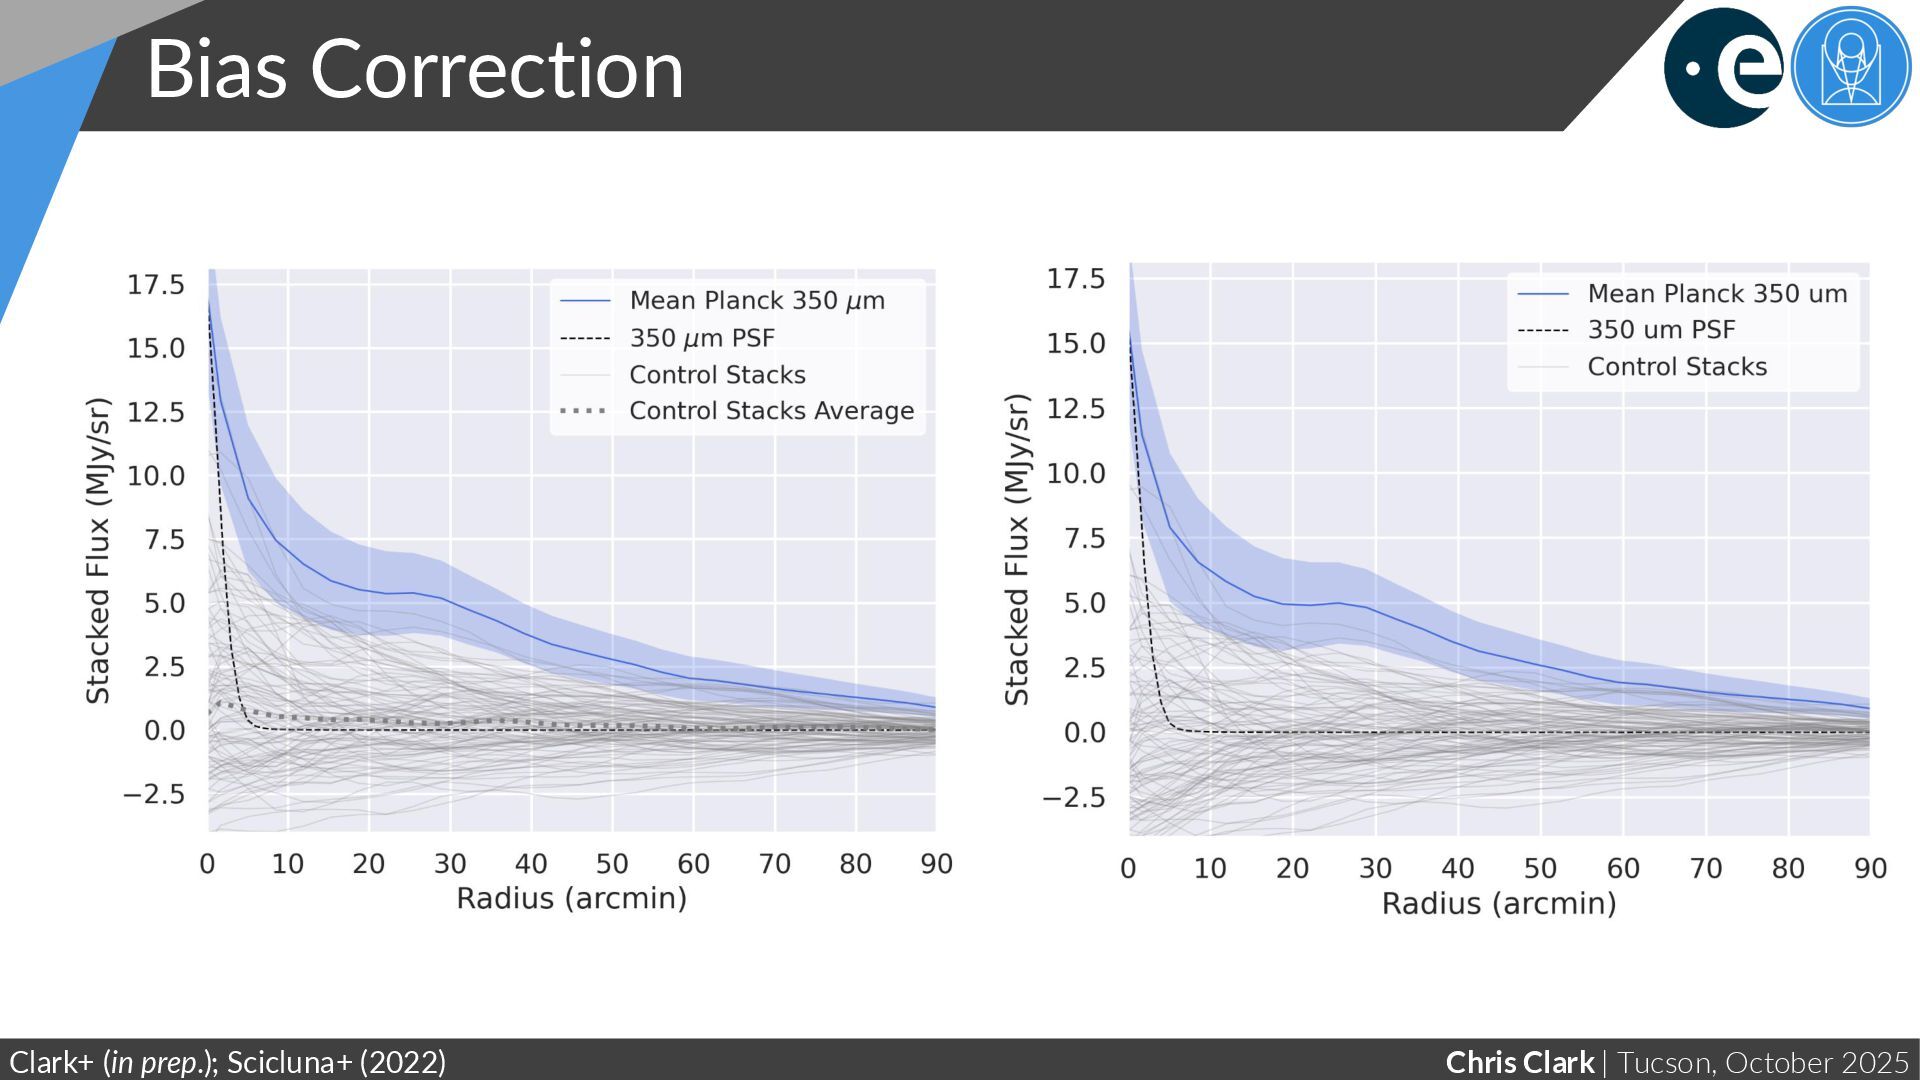
Stacks Clark+ (in prep.) Real Planck 350 μm stack 8 of the Planck 350 μm control stacks (Examples from the 100 total control stacks) Control stack 1 Control stack 2 Control stack 3 Control stack 4 Control stack 5 Control stack 6 Control stack 7 Control stack 8
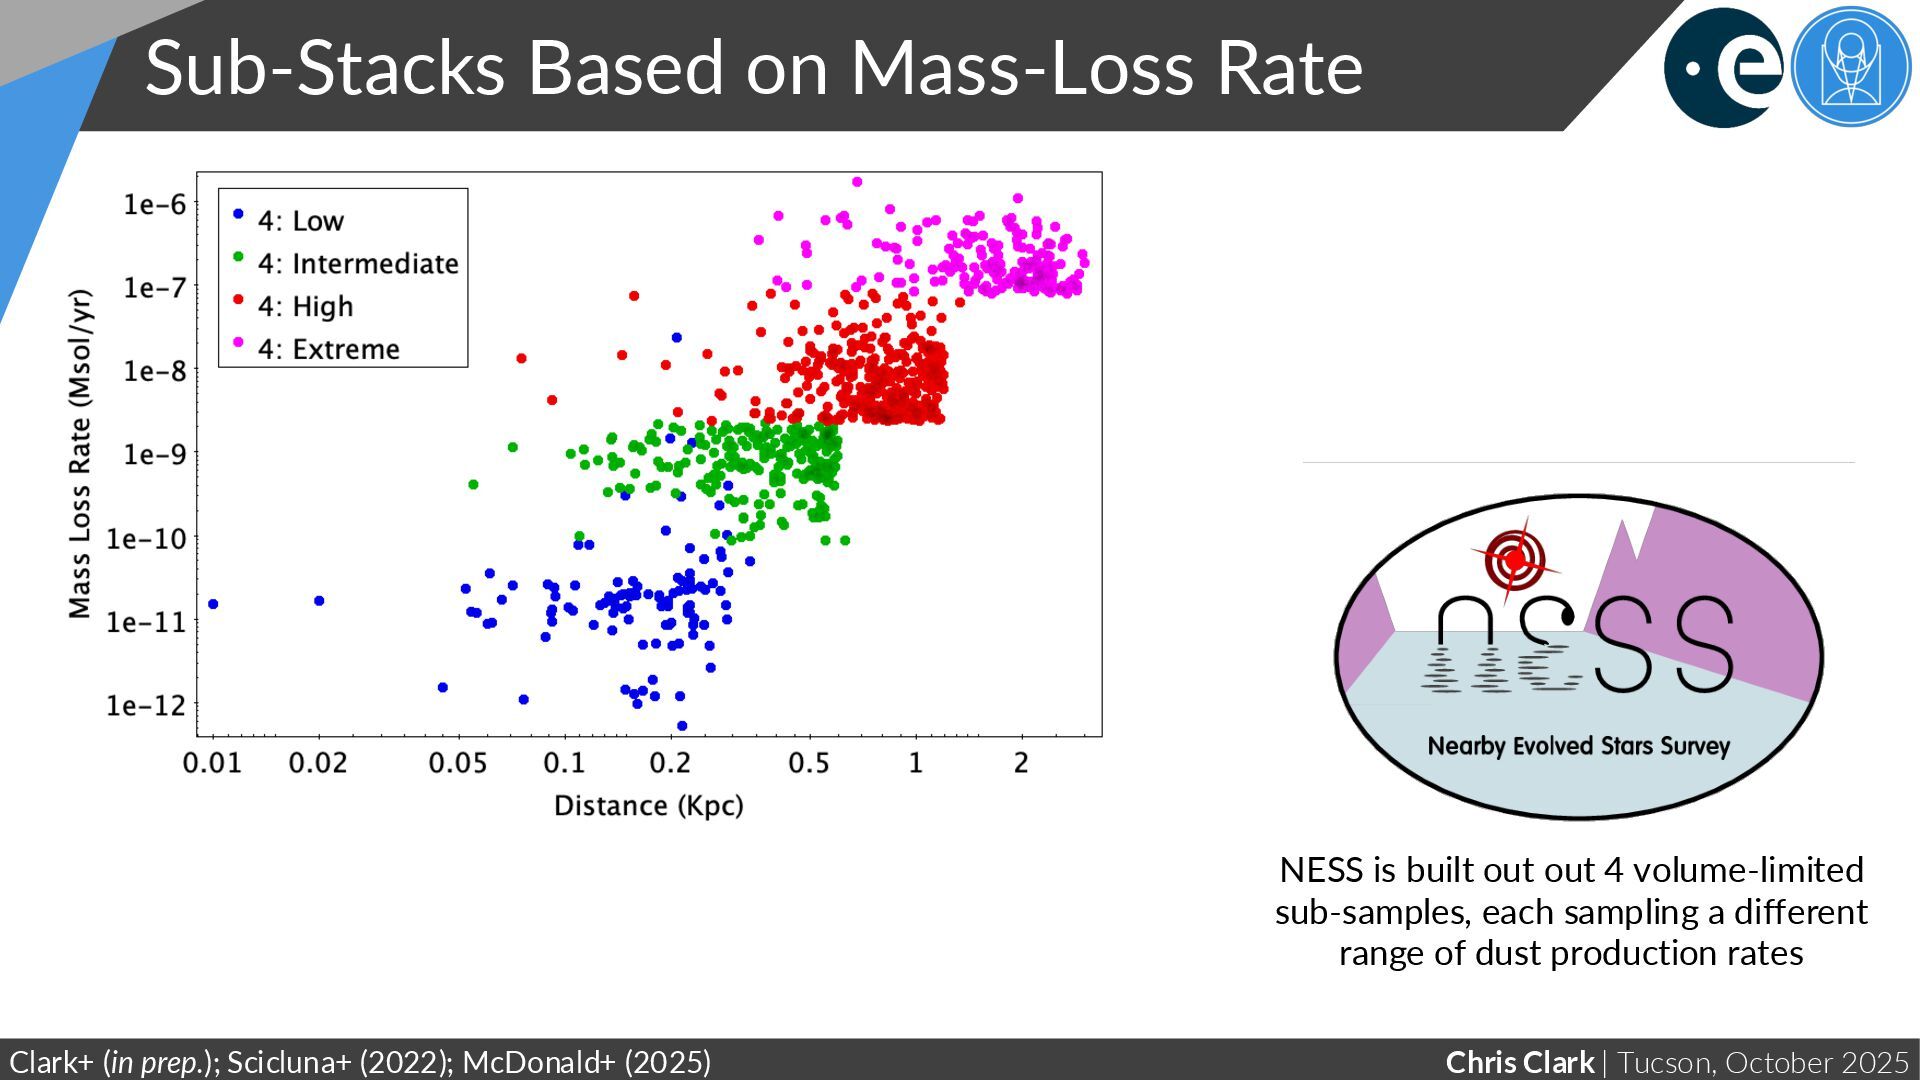
Rate Clark+ (in prep.); Scicluna+ (2022); McDonald+ (2025) NESS is built out out 4 volume-limited sub-samples, each sampling a different range of dust production rates
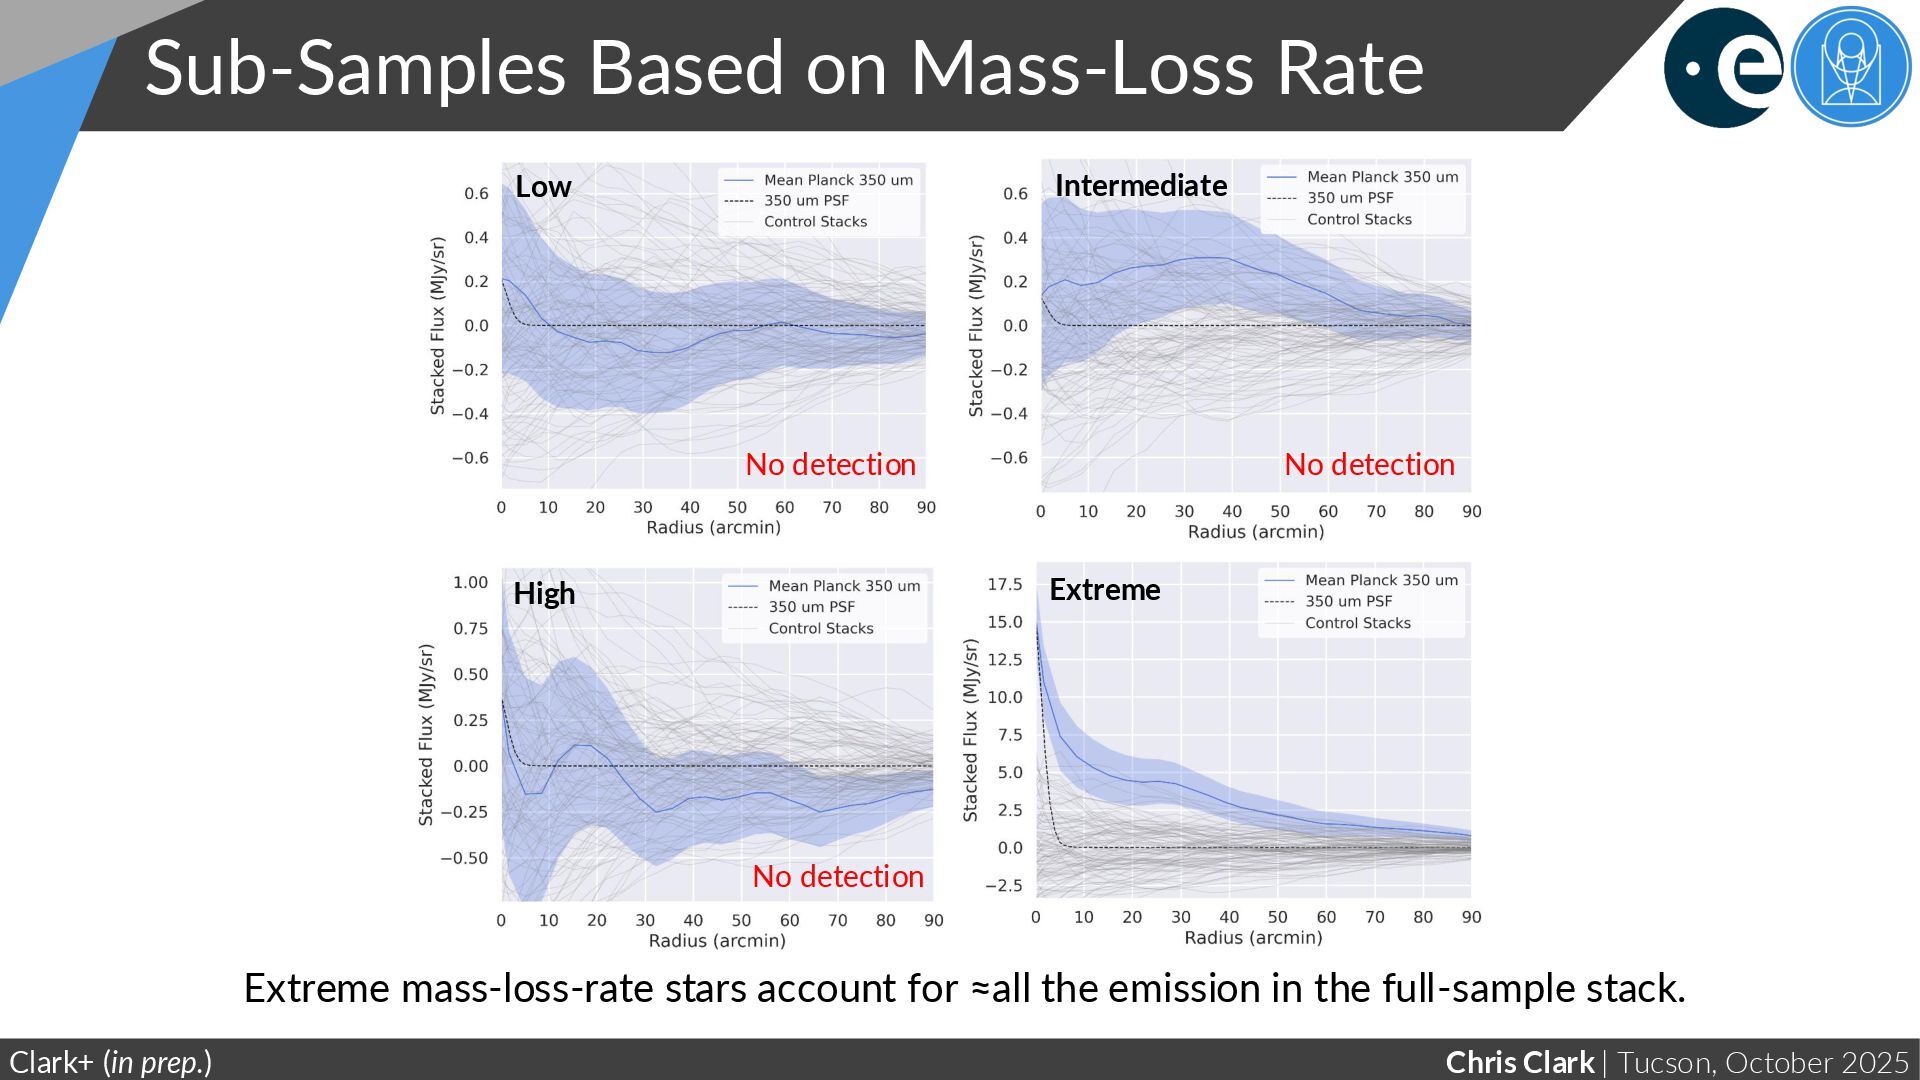
Rate Clark+ (in prep.) Extreme mass-loss-rate stars account for ≈all the emission in the full-sample stack. Low High Extreme Intermediate No detection No detection No detection
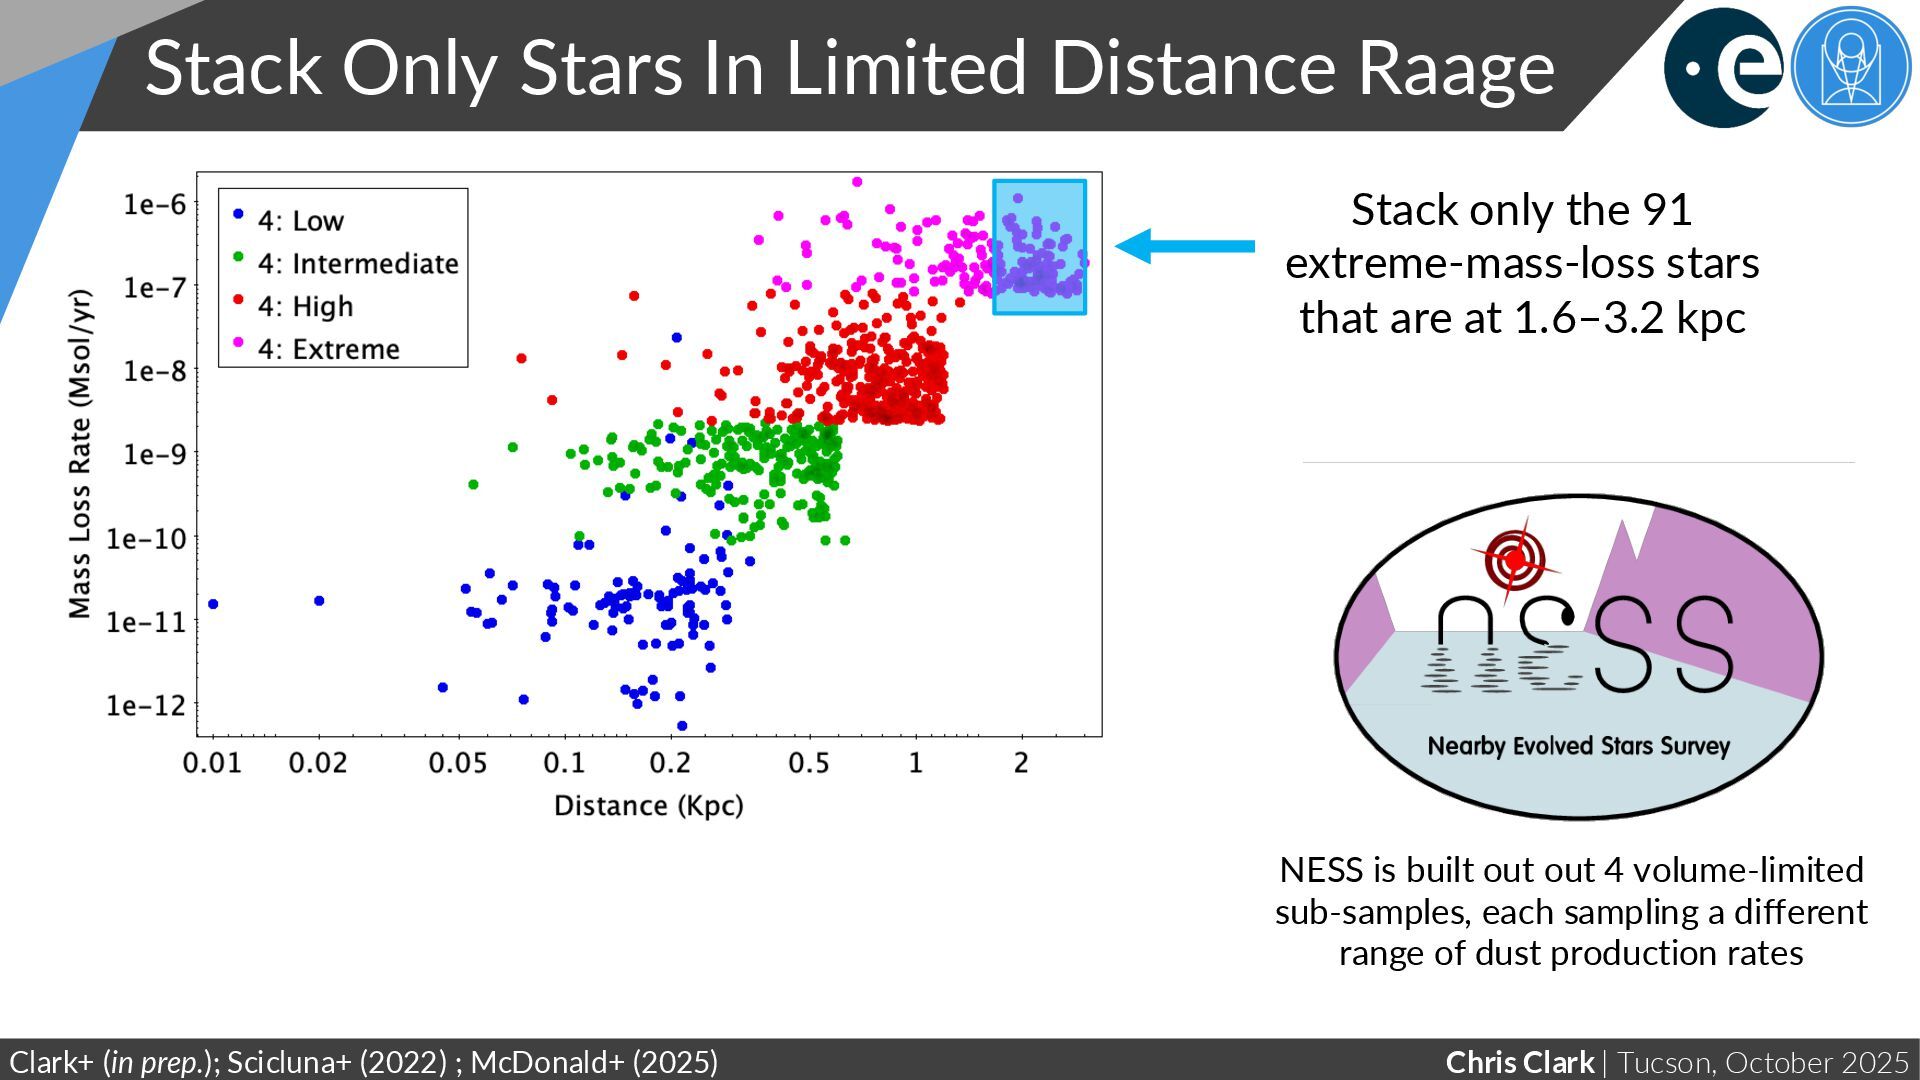
Limited Distance Raage Clark+ (in prep.); Scicluna+ (2022) ; McDonald+ (2025) NESS is built out out 4 volume-limited sub-samples, each sampling a different range of dust production rates Stack only the 91 extreme-mass-loss stars that are at 1.6–3.2 kpc
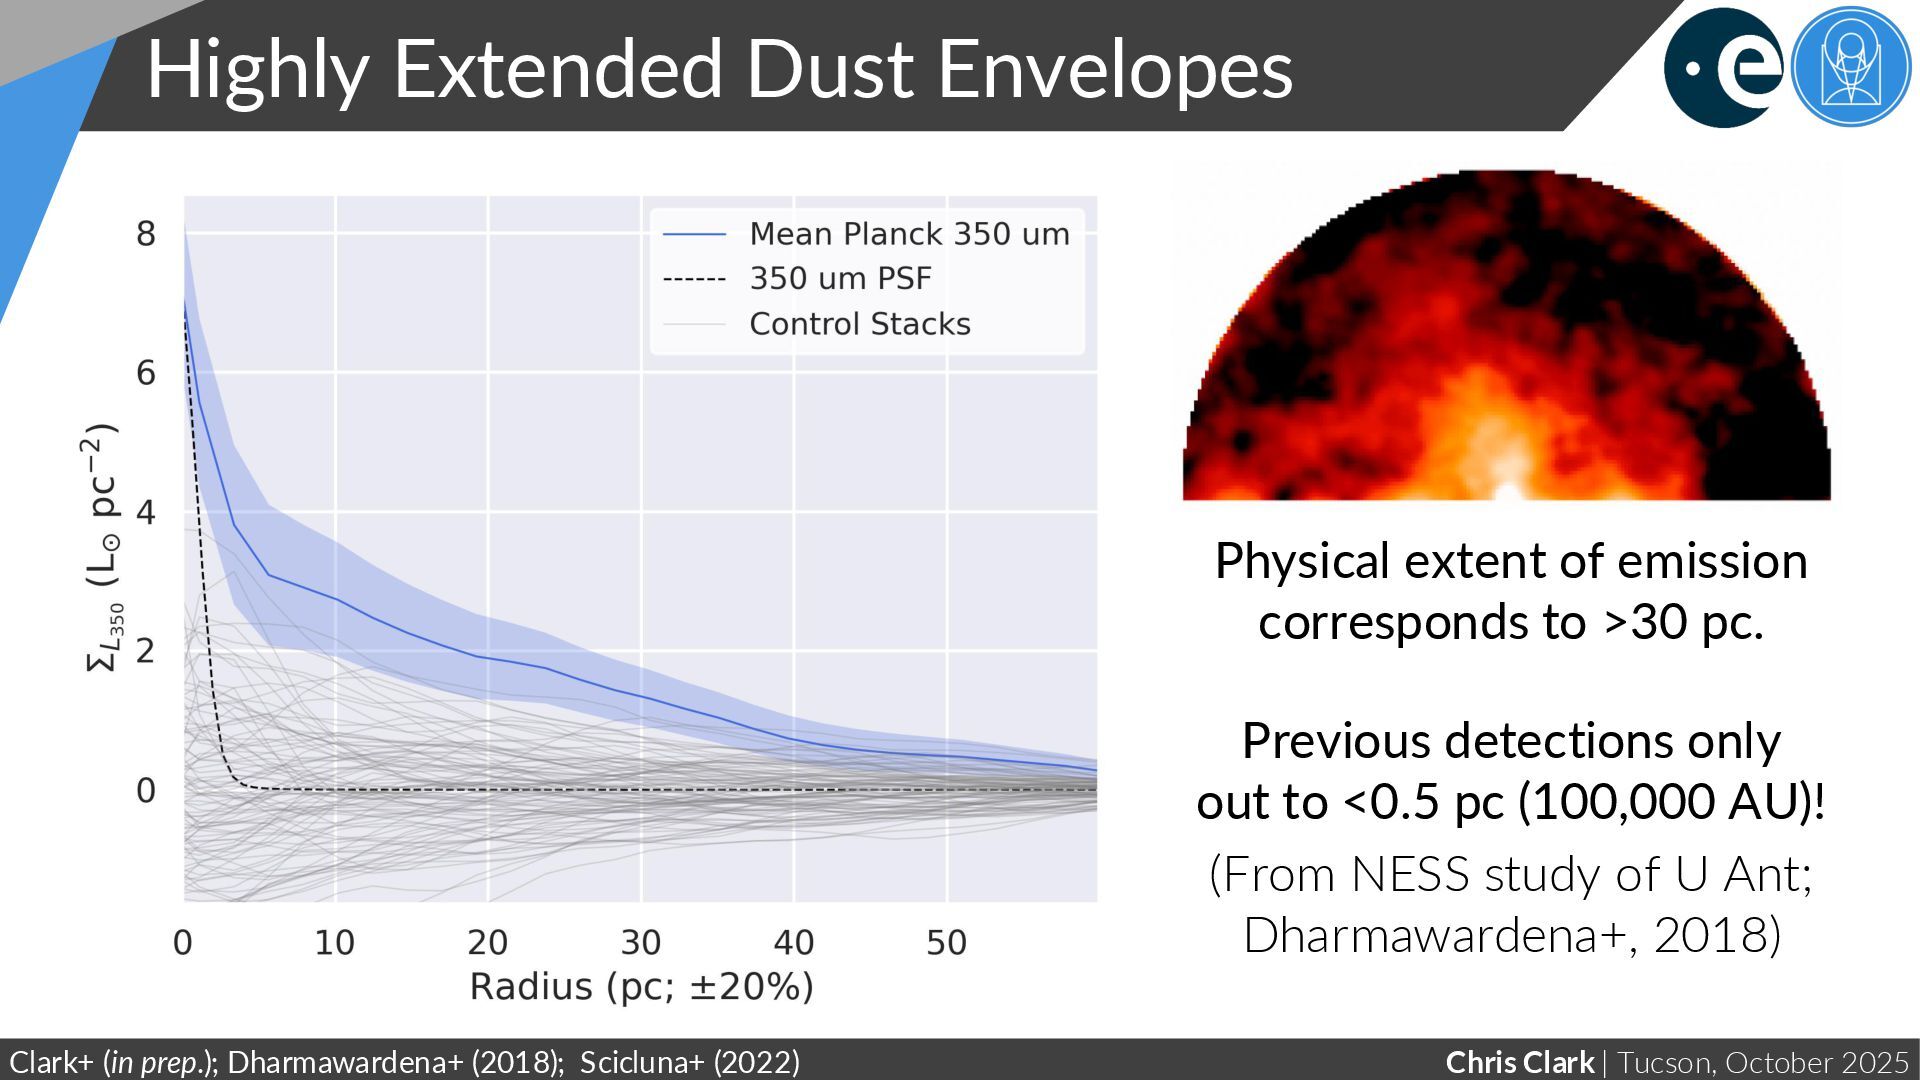
Clark+ (in prep.); Dharmawardena+ (2018); Scicluna+ (2022) Physical extent of emission corresponds to >30 pc. Previous detections only out to <0.5 pc (100,000 AU)! (From NESS study of U Ant; Dharmawardena+, 2018)
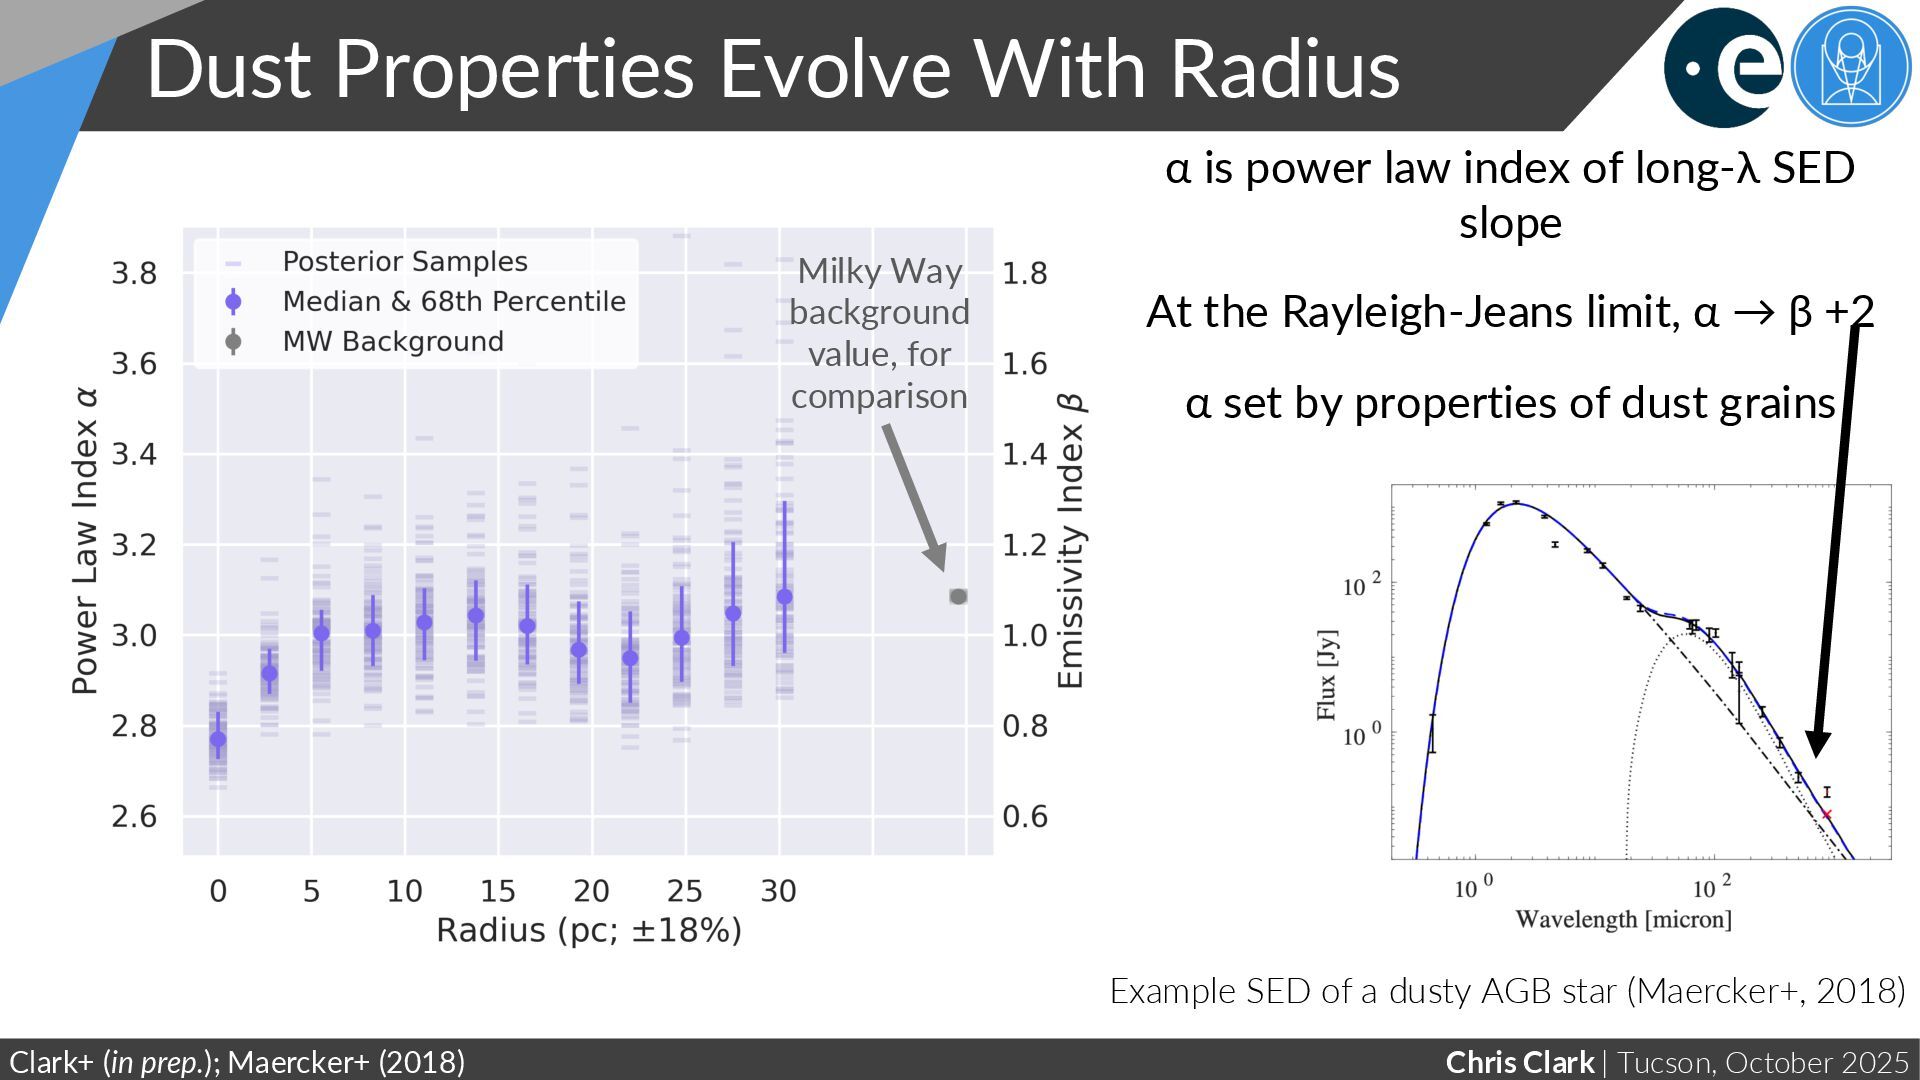
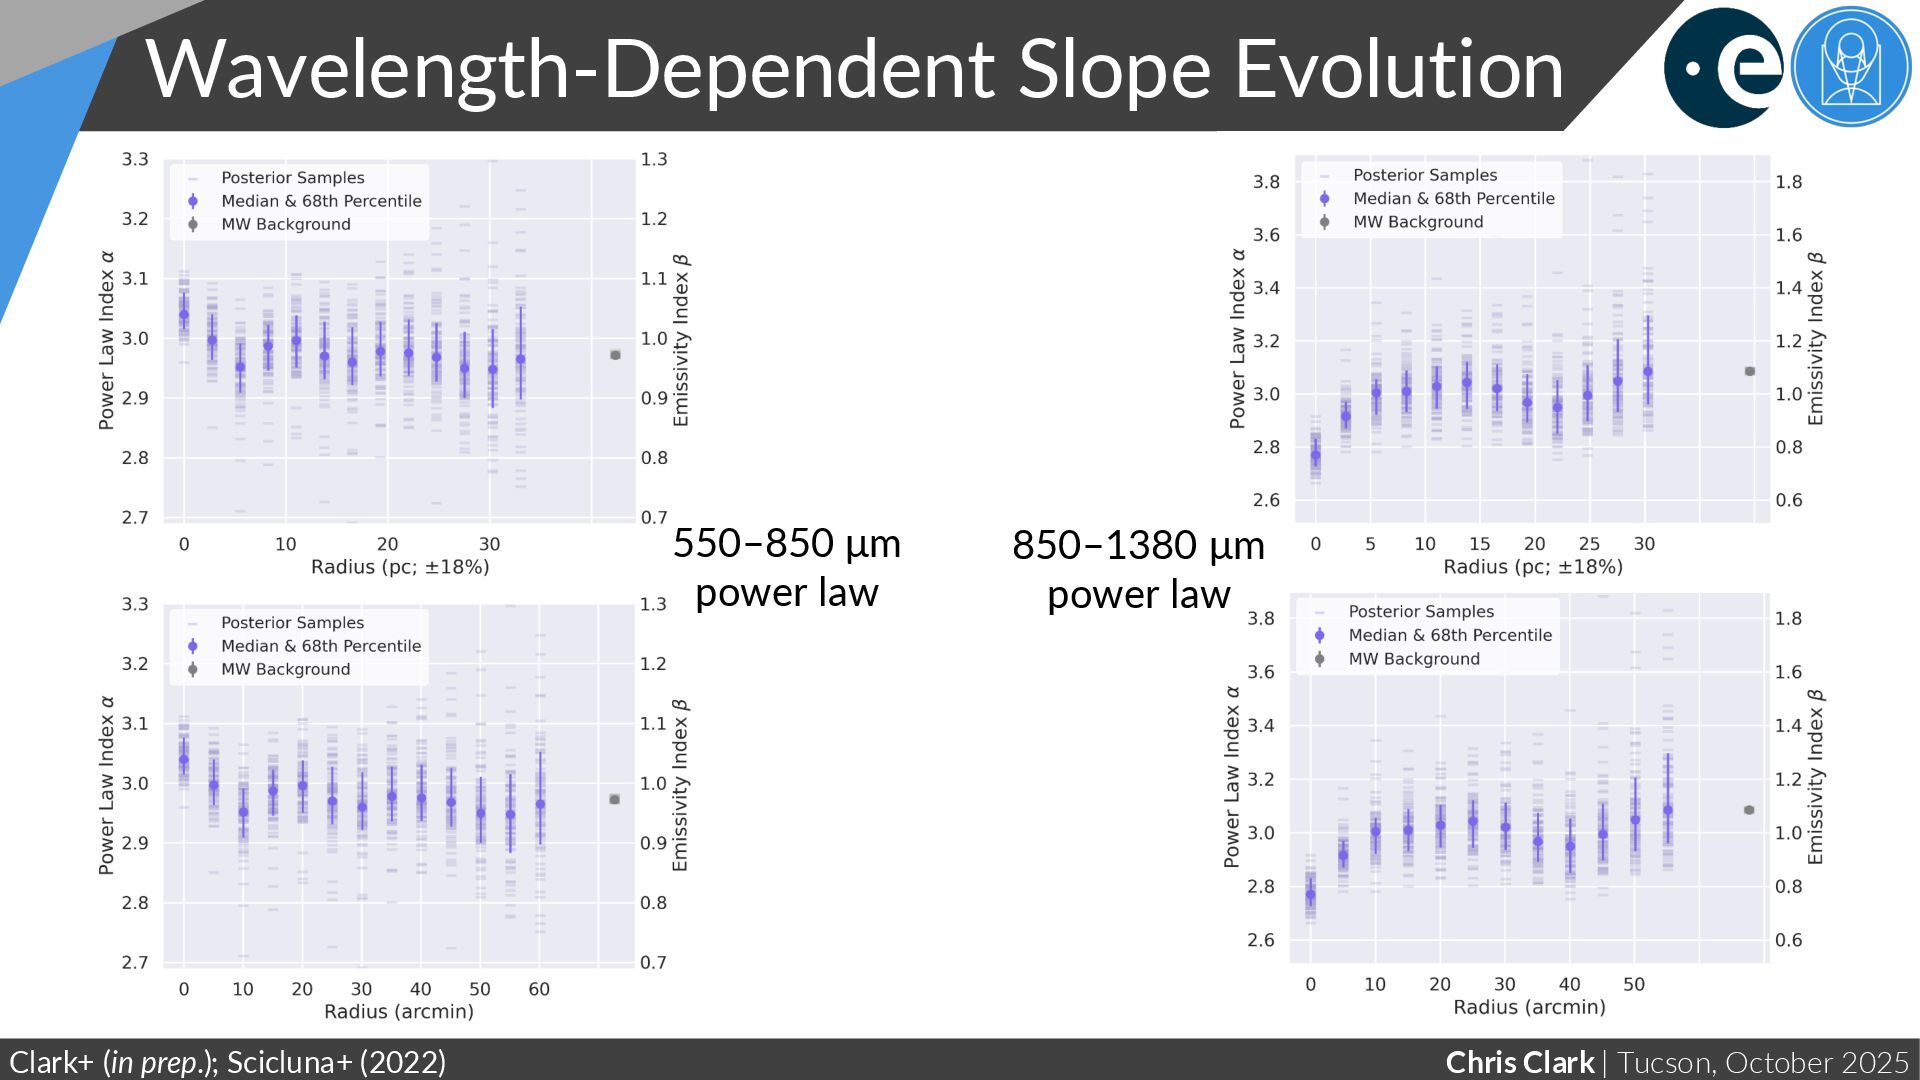
Radius Clark+ (in prep.); Maercker+ (2018) α is power law index of long-λ SED slope At the Rayleigh-Jeans limit, α → β +2 α set by properties of dust grains Milky Way background value, for comparison Example SED of a dusty AGB star (Maercker+, 2018)
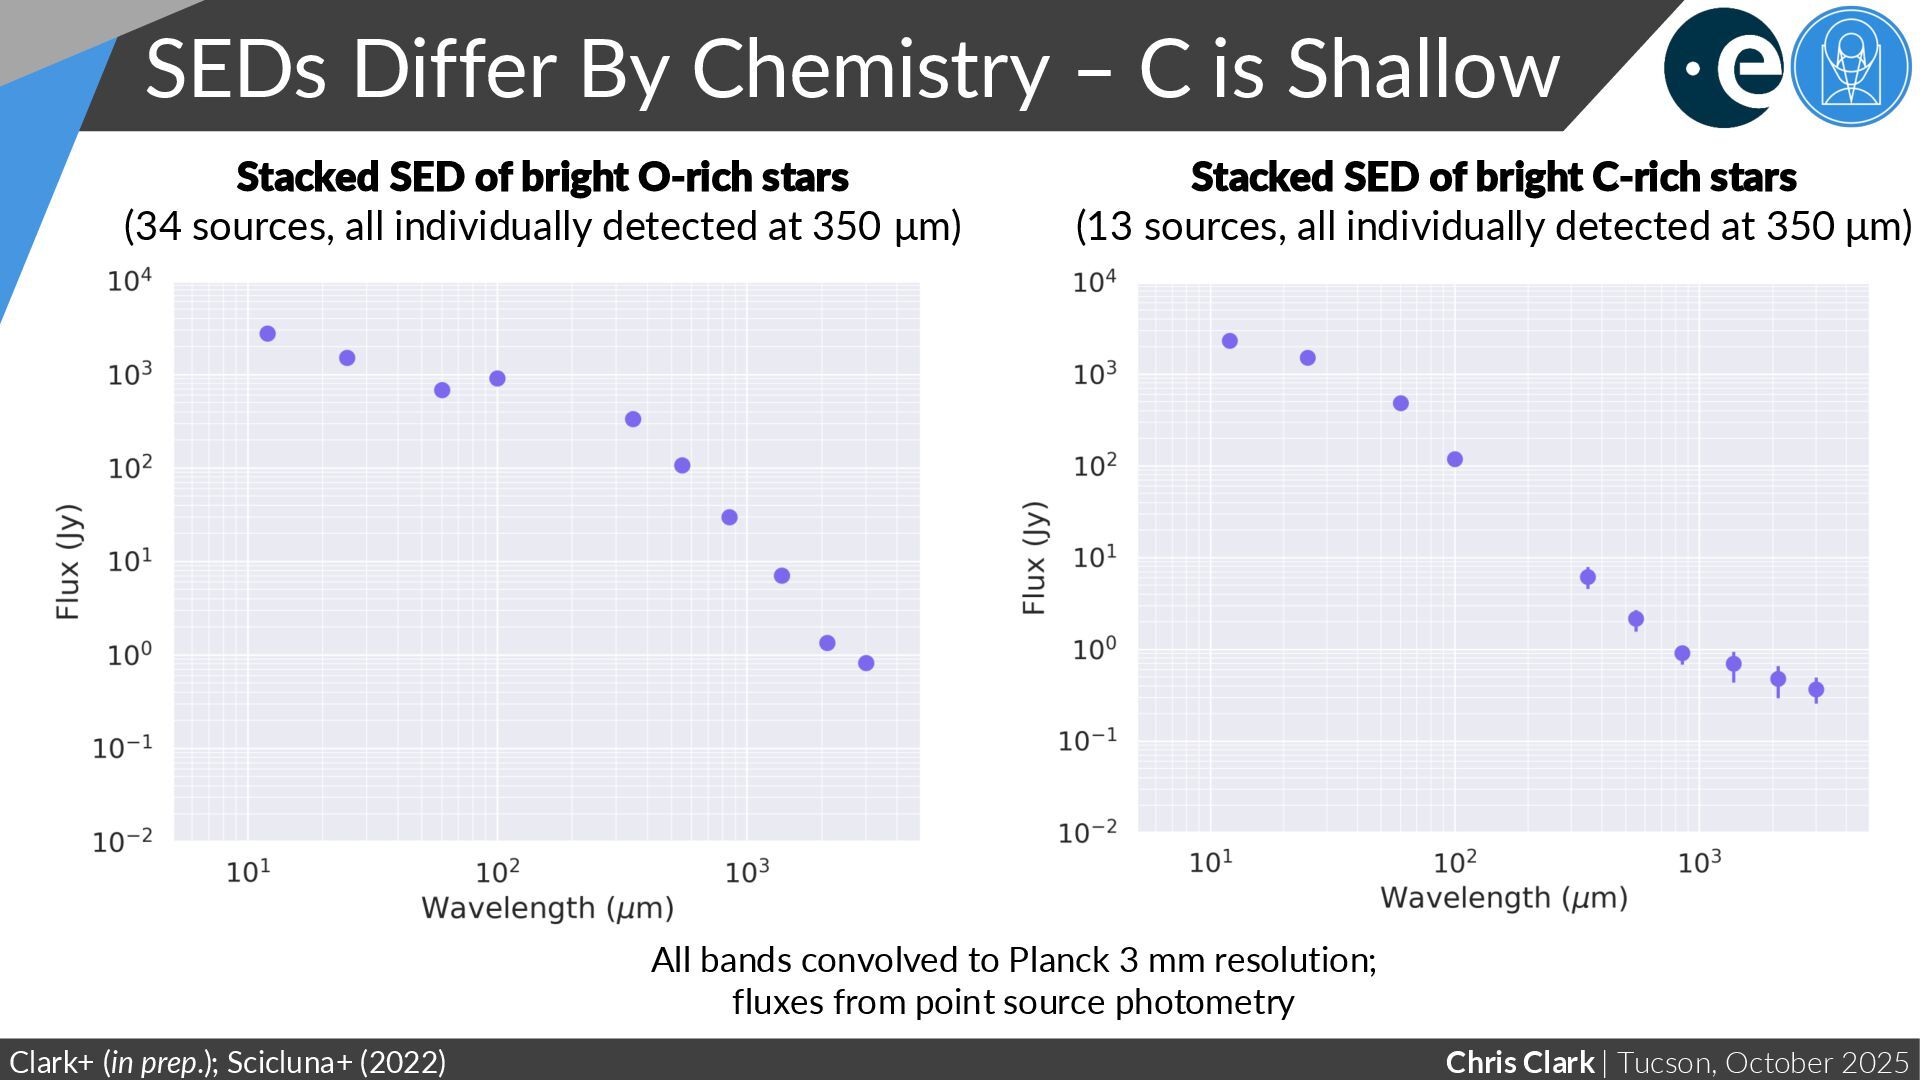
– C is Shallow Clark+ (in prep.); Scicluna+ (2022) All bands convolved to Planck 3 mm resolution; fluxes from point source photometry Stacked SED of bright O-rich stars (34 sources, all individually detected at 350 μm) Stacked SED of bright C-rich stars (13 sources, all individually detected at 350 μm)
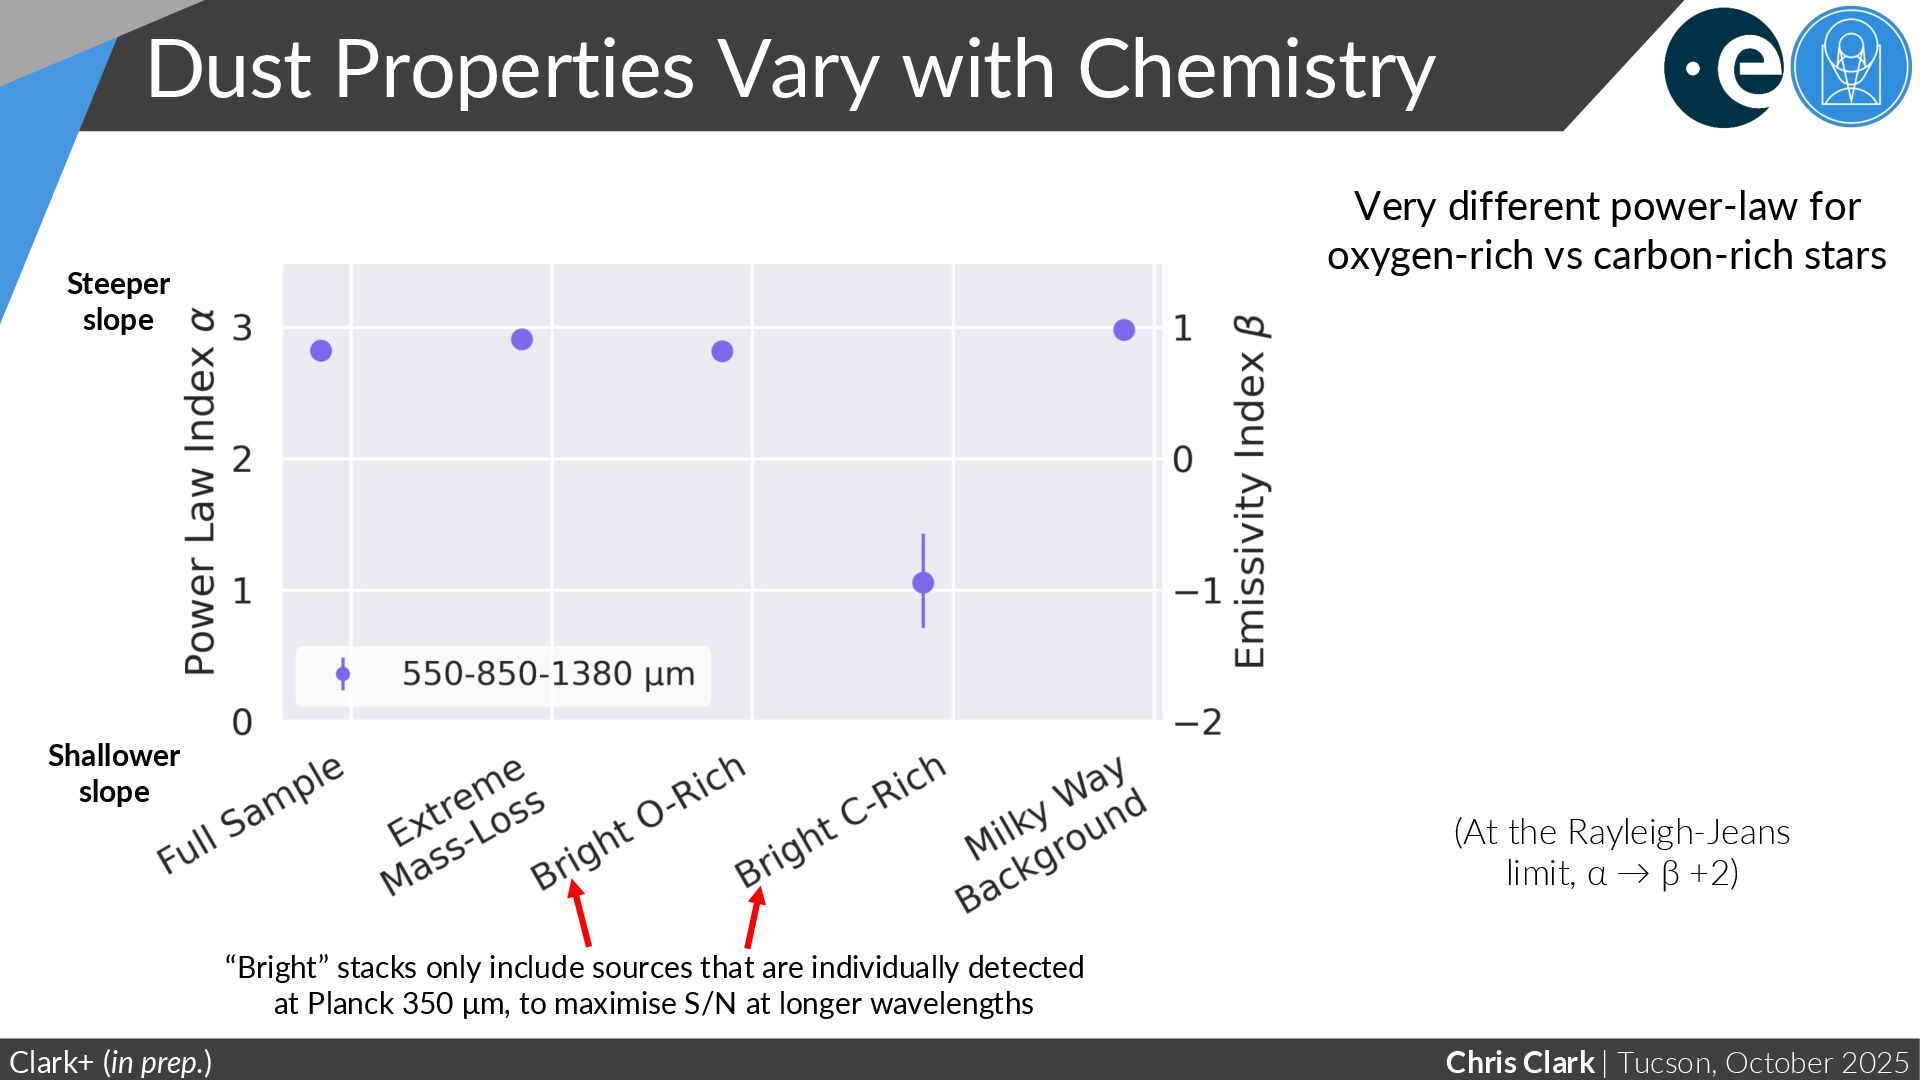
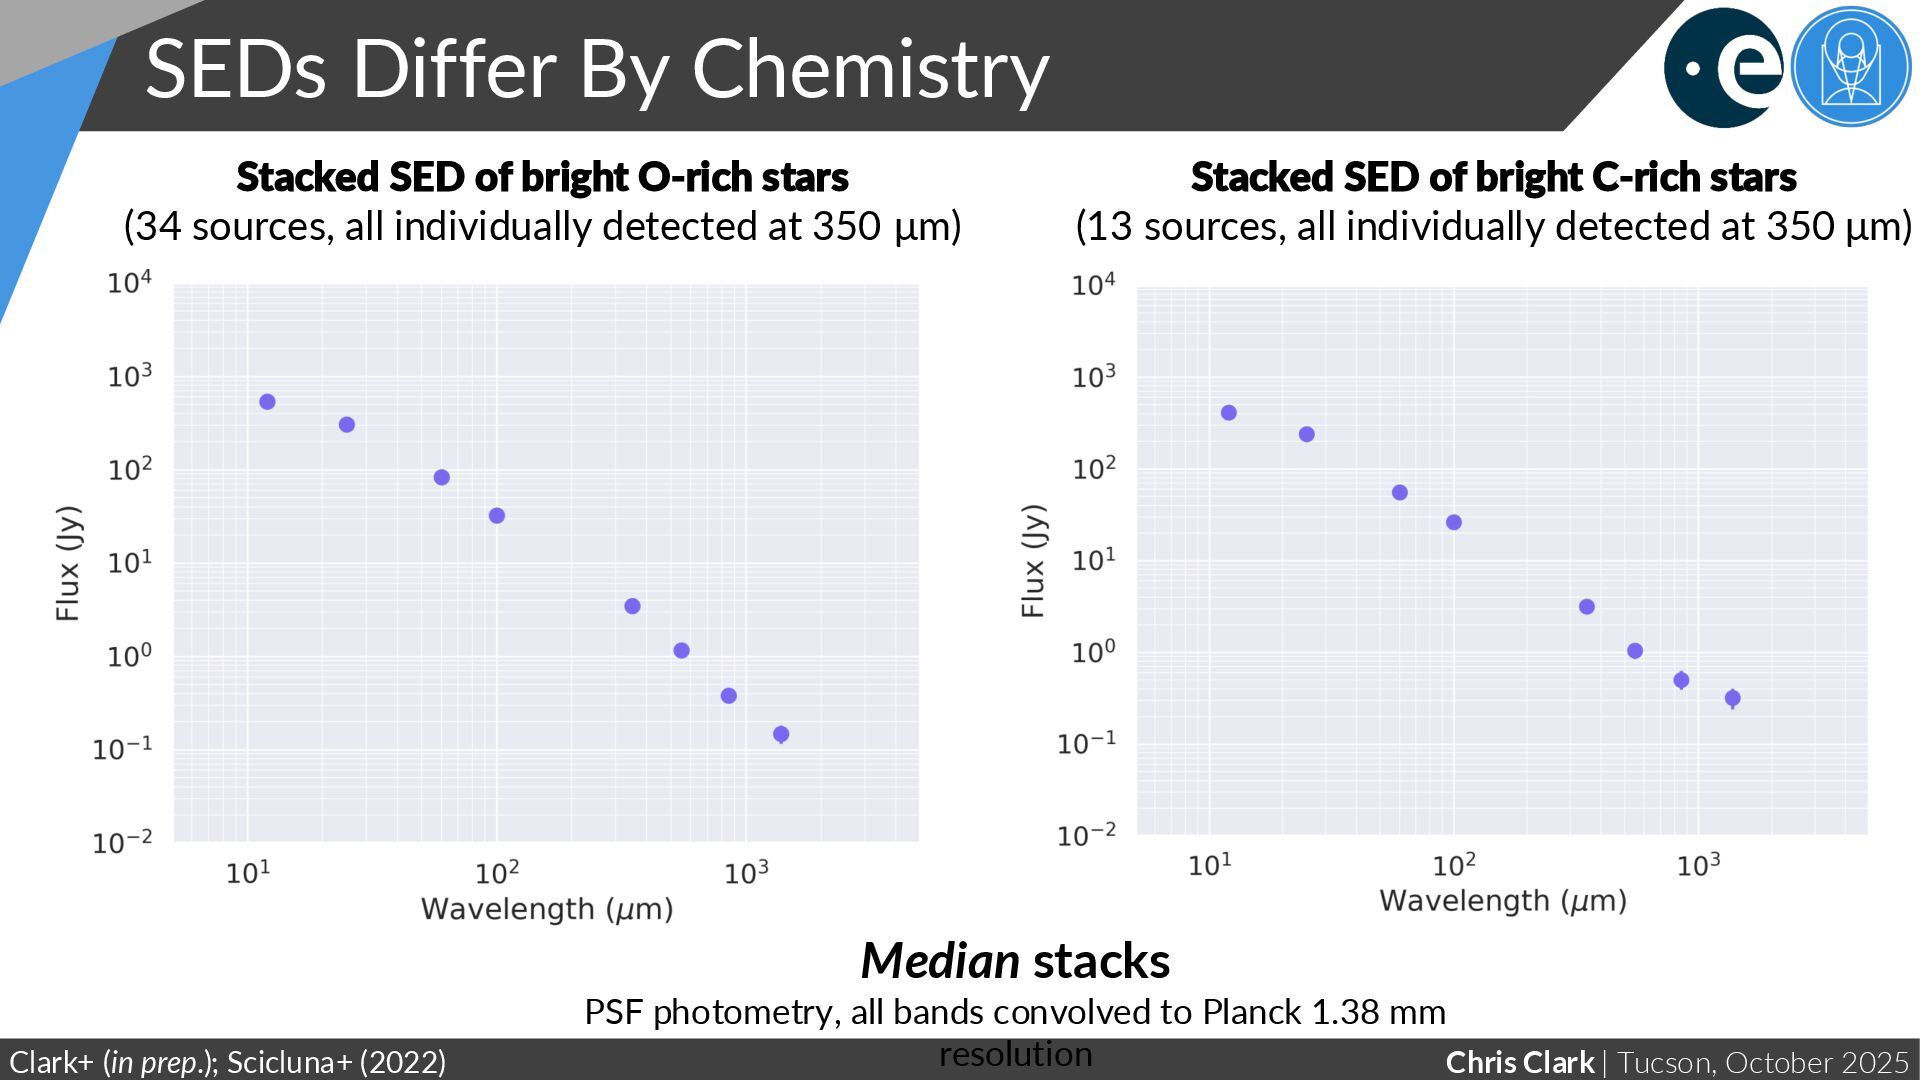
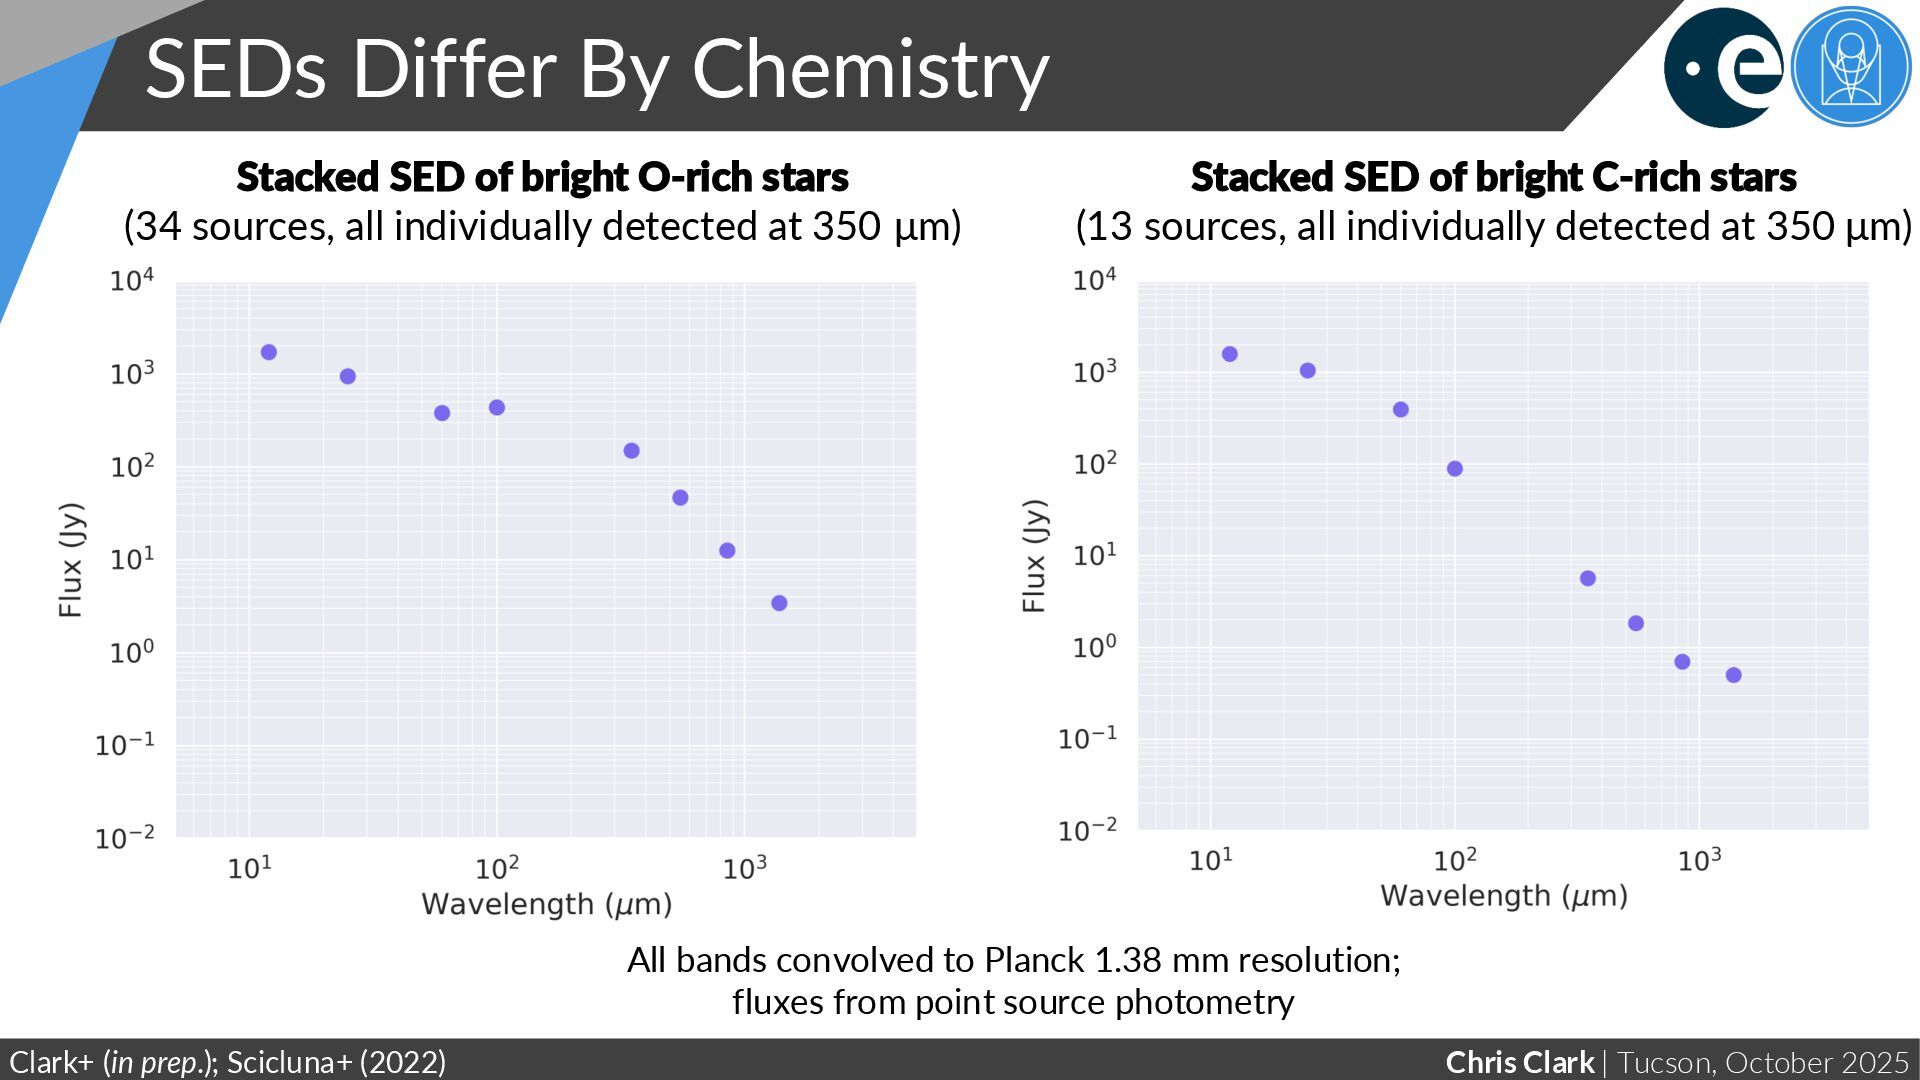
Chemistry Clark+ (in prep.) Steeper slope Shallower slope Very different power-law for oxygen-rich vs carbon-rich stars “Bright” stacks only include sources that are individually detected at Planck 350 μm, to maximise S/N at longer wavelengths (At the Rayleigh-Jeans limit, α → β +2)
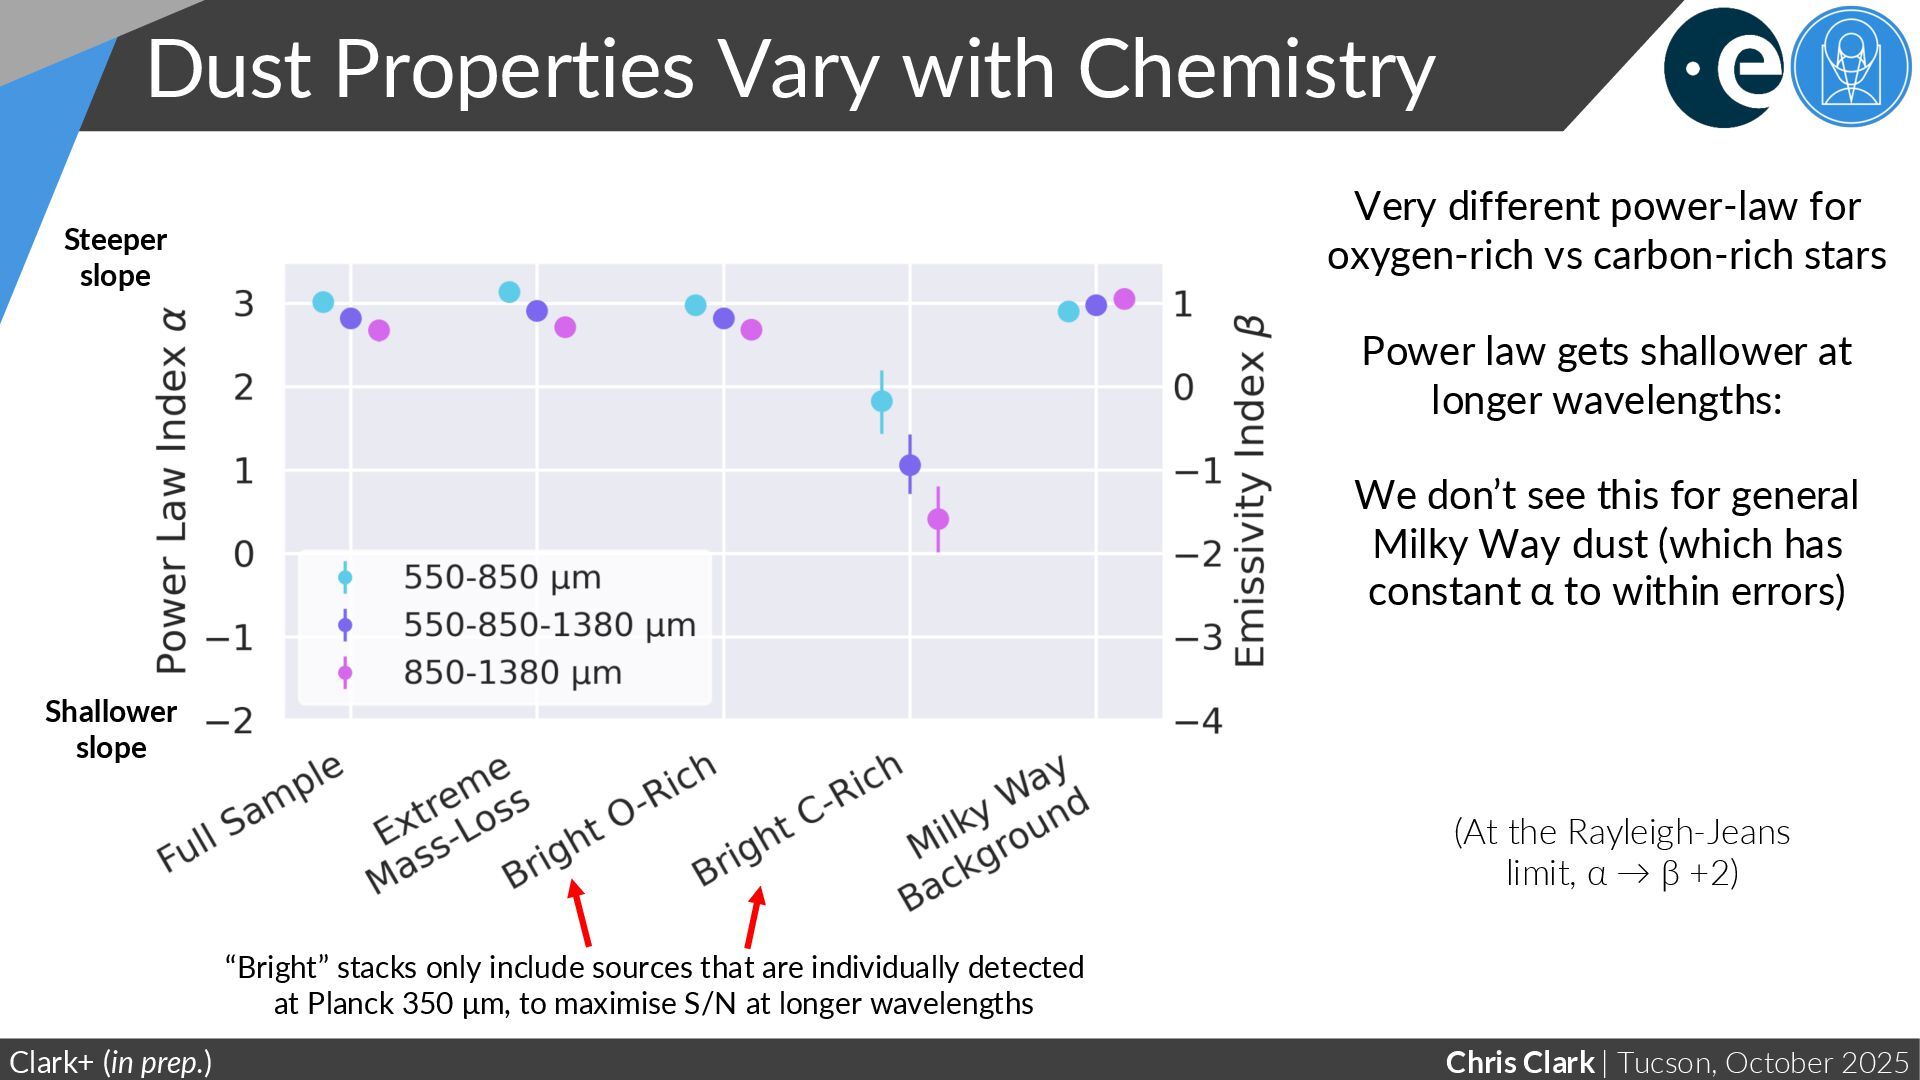
Chemistry Clark+ (in prep.) (At the Rayleigh-Jeans limit, α → β +2) Very different power-law for oxygen-rich vs carbon-rich stars Power law gets shallower at longer wavelengths: We don’t see this for general Milky Way dust (which has constant α to within errors) Steeper slope Shallower slope “Bright” stacks only include sources that are individually detected at Planck 350 μm, to maximise S/N at longer wavelengths
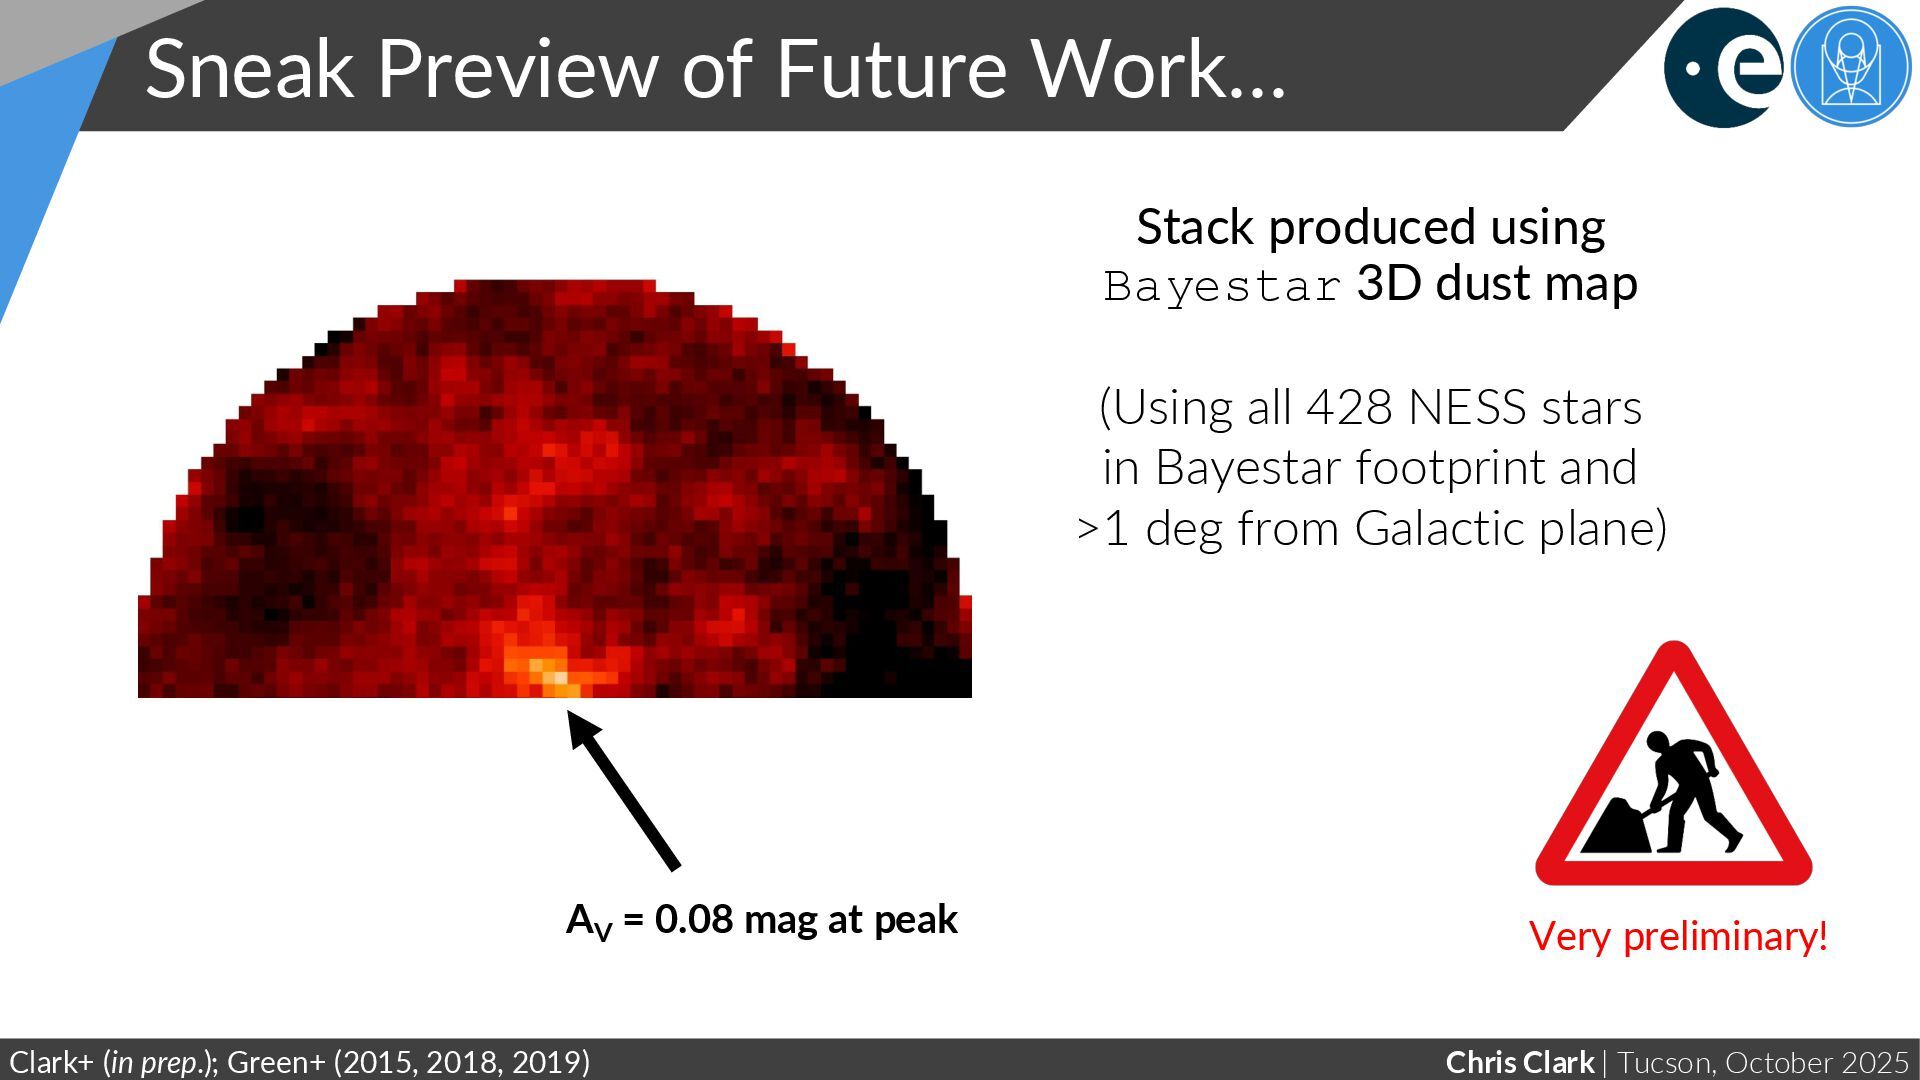
Work… Clark+ (in prep.); Green+ (2015, 2018, 2019) Stack produced using Bayestar 3D dust map (Using all 428 NESS stars in Bayestar footprint and >1 deg from Galactic plane) AV = 0.08 mag at peak Very preliminary!
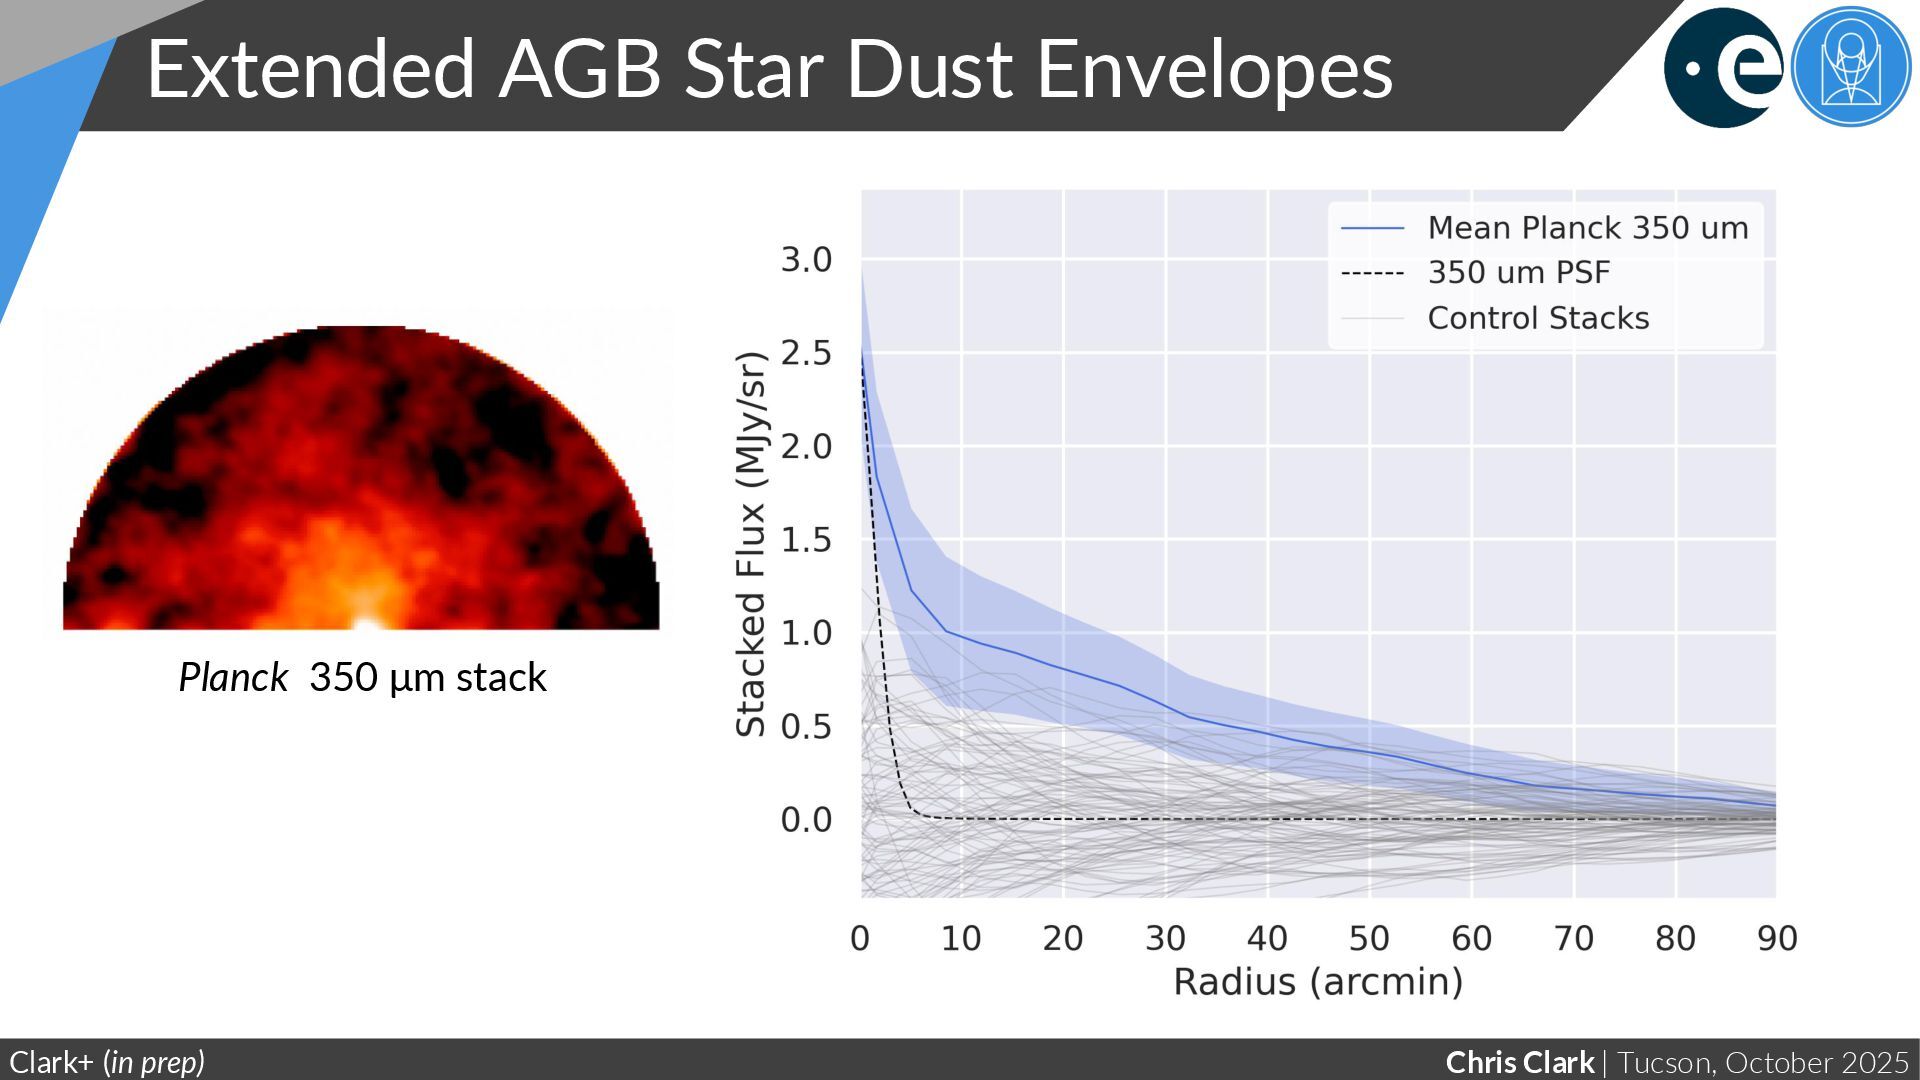
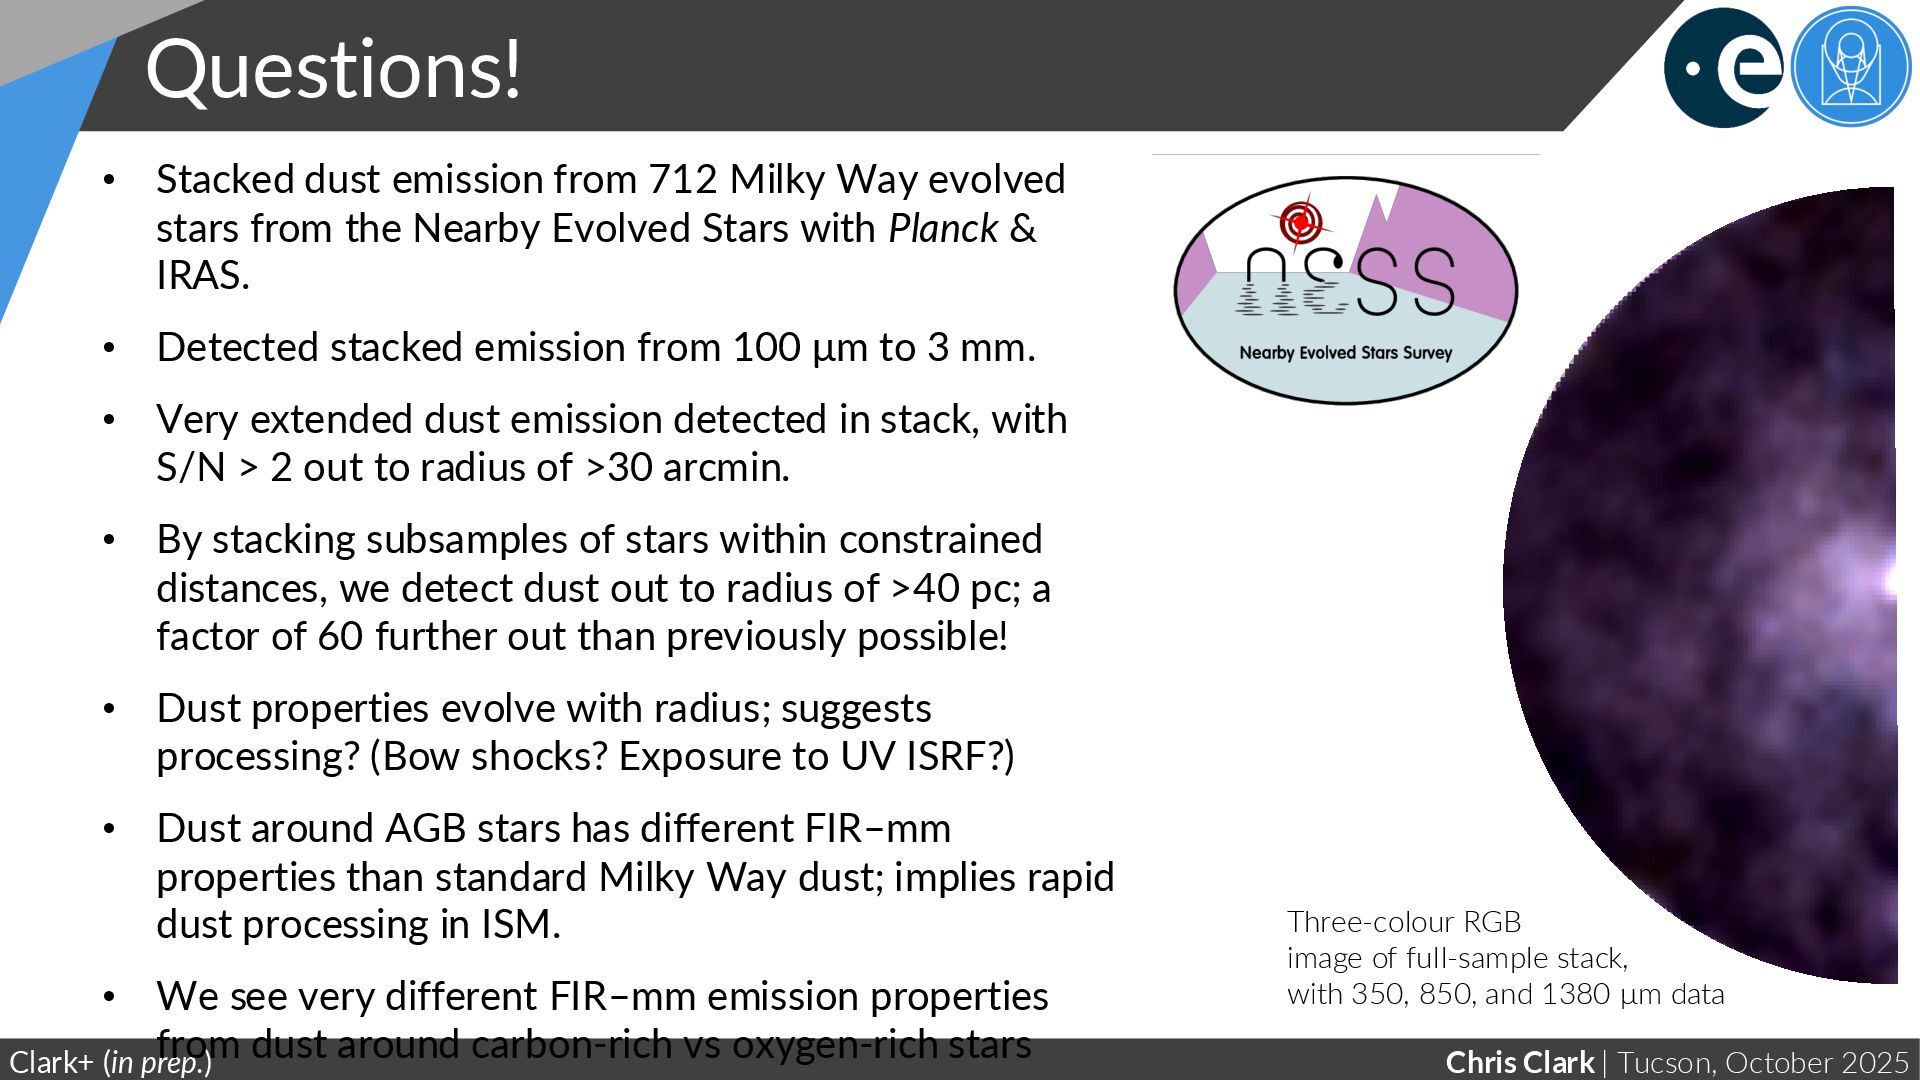
Three-colour RGB image of full-sample stack, with 350, 850, and 1380 μm data • Stacked dust emission from 712 Milky Way evolved stars from the Nearby Evolved Stars with Planck & IRAS. • Detected stacked emission from 100 μm to 3 mm. • Very extended dust emission detected in stack, with S/N > 2 out to radius of >30 arcmin. • By stacking subsamples of stars within constrained distances, we detect dust out to radius of >40 pc; a factor of 60 further out than previously possible! • Dust properties evolve with radius; suggests processing? (Bow shocks? Exposure to UV ISRF?) • Dust around AGB stars has different FIR–mm properties than standard Milky Way dust; implies rapid dust processing in ISM. • We see very different FIR–mm emission properties from dust around carbon-rich vs oxygen-rich stars
Clark+ (in prep.); Scicluna+ (2022) Median stacks PSF photometry, all bands convolved to Planck 1.38 mm resolution Stacked SED of bright O-rich stars (34 sources, all individually detected at 350 μm) Stacked SED of bright C-rich stars (13 sources, all individually detected at 350 μm)
Clark+ (in prep.); Scicluna+ (2022) All bands convolved to Planck 1.38 mm resolution; fluxes from point source photometry Stacked SED of bright O-rich stars (34 sources, all individually detected at 350 μm) Stacked SED of bright C-rich stars (13 sources, all individually detected at 350 μm)