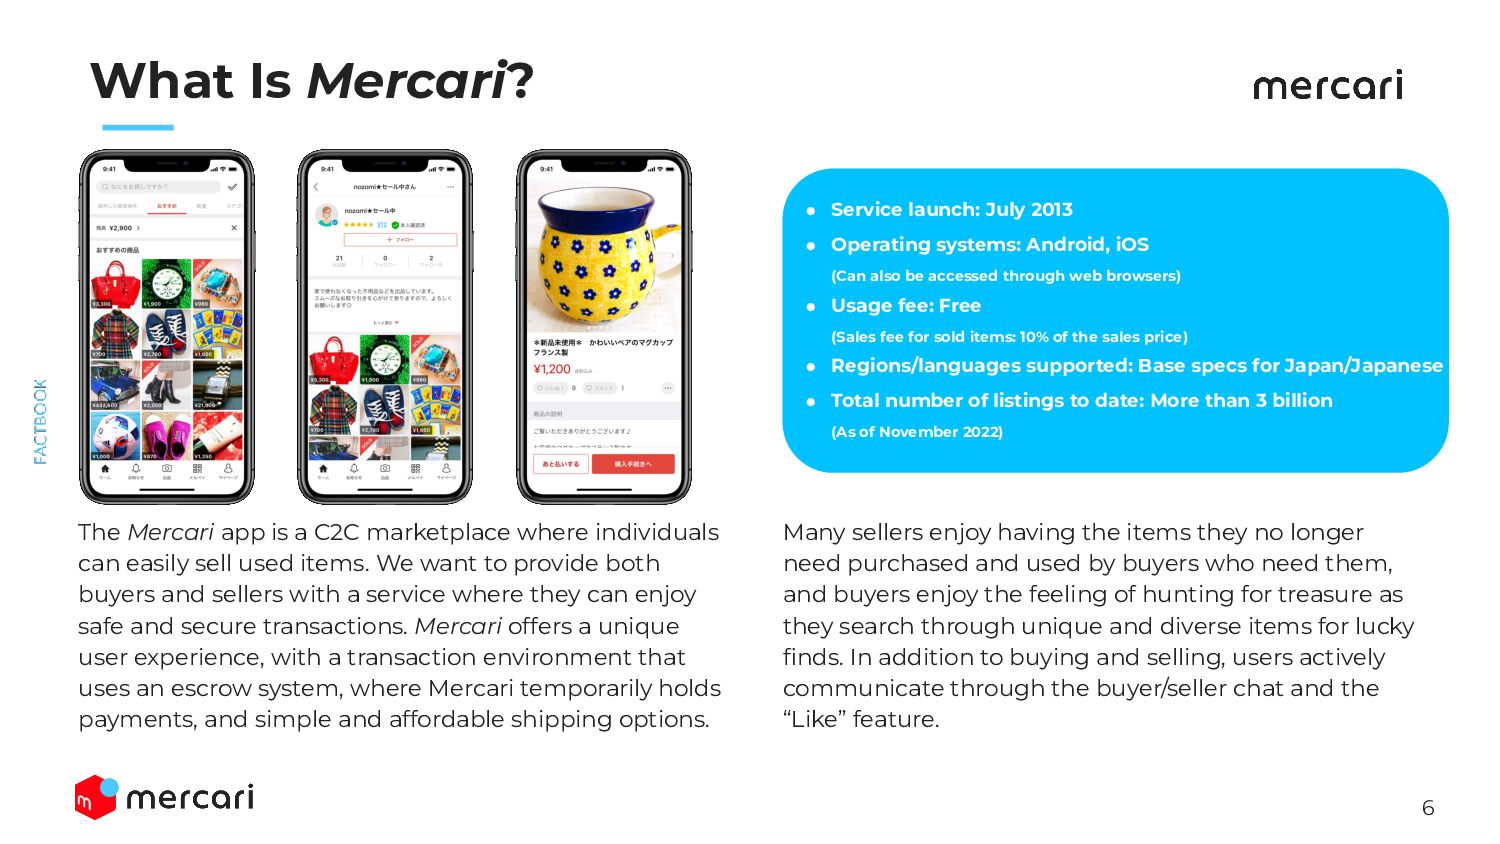
• Operating systems: Android, iOS (Can also be accessed through web browsers) • Usage fee: Free (Sales fee for sold items: 10% of the sales price) • Regions/languages supported: Base specs for Japan/Japanese • Total number of listings to date: More than 3 billion (As of November 2022) Many sellers enjoy having the items they no longer need purchased and used by buyers who need them, and buyers enjoy the feeling of hunting for treasure as they search through unique and diverse items for lucky finds. In addition to buying and selling, users actively communicate through the buyer/seller chat and the “Like” feature. The Mercari app is a C2C marketplace where individuals can easily sell used items. We want to provide both buyers and sellers with a service where they can enjoy safe and secure transactions. Mercari offers a unique user experience, with a transaction environment that uses an escrow system, where Mercari temporarily holds payments, and simple and affordable shipping options.
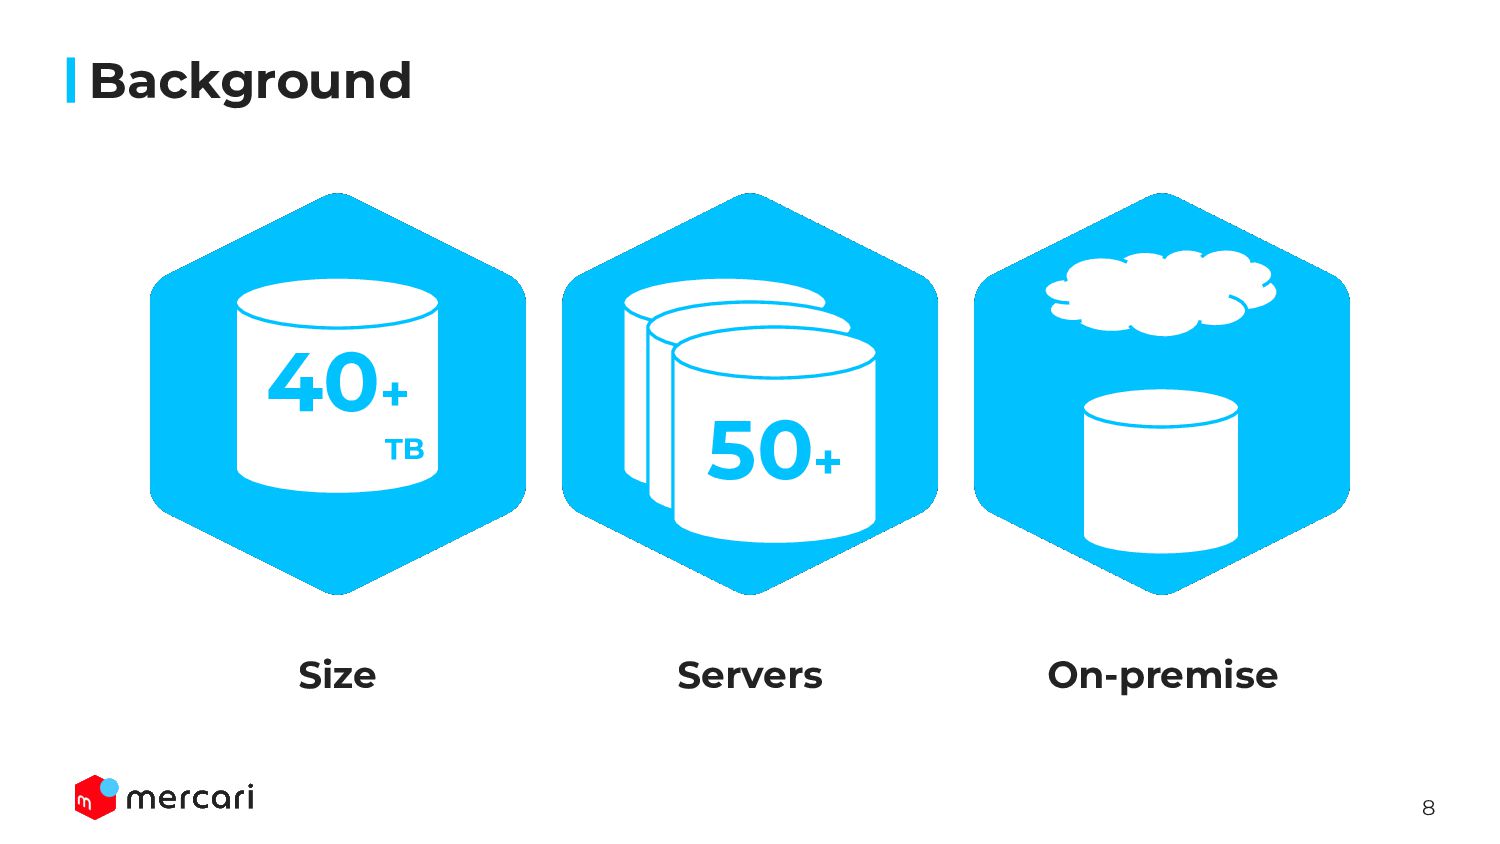
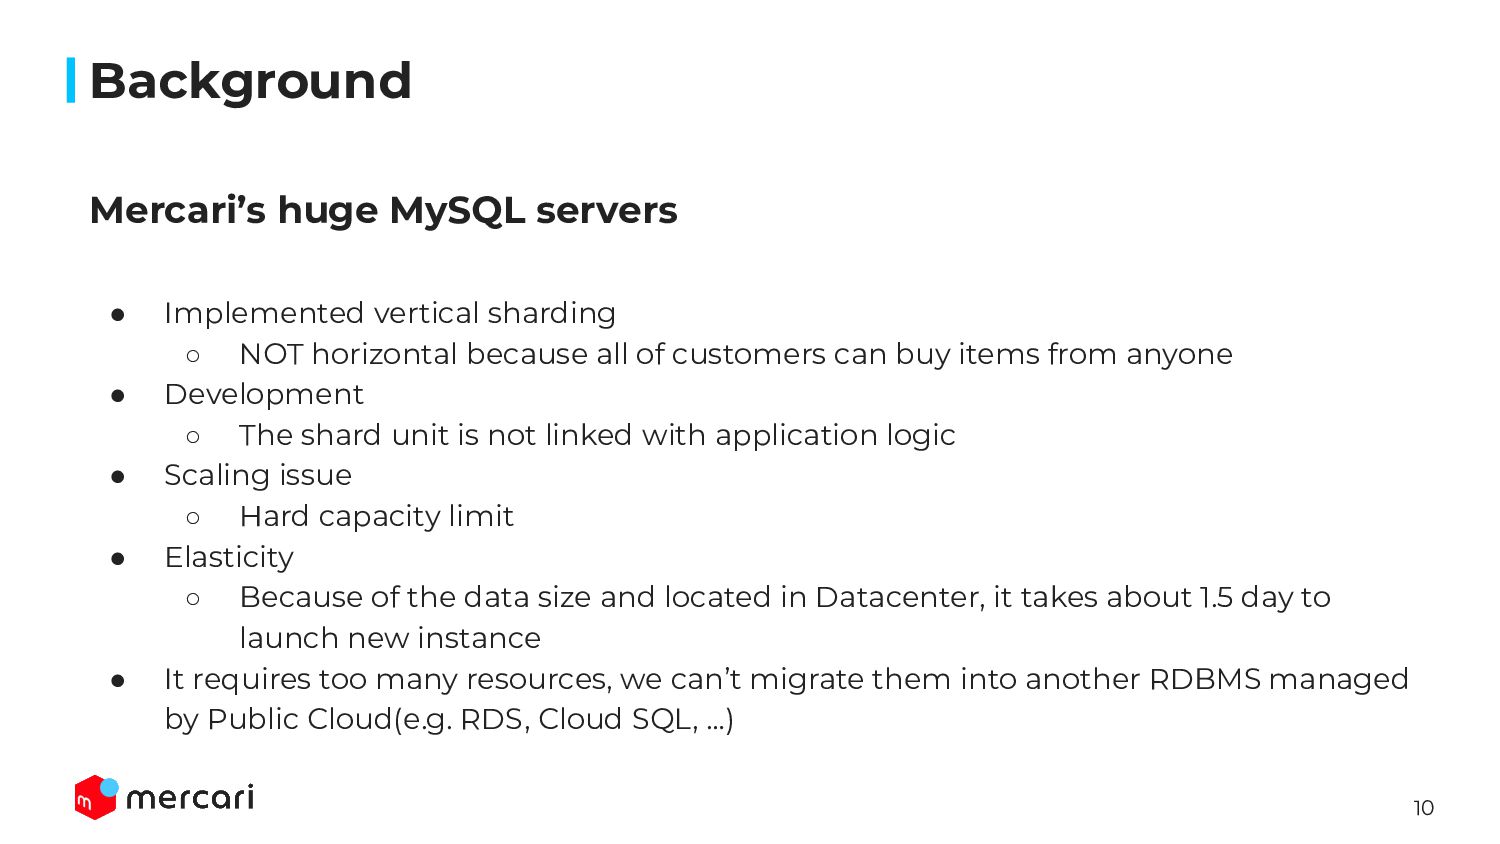
of customers can buy items from anyone • Development ◦ The shard unit is not linked with application logic • Scaling issue ◦ Hard capacity limit • Elasticity ◦ Because of the data size and located in Datacenter, it takes about 1.5 day to launch new instance • It requires too many resources, we can’t migrate them into another RDBMS managed by Public Cloud(e.g. RDS, Cloud SQL, …) Mercari’s huge MySQL servers Background
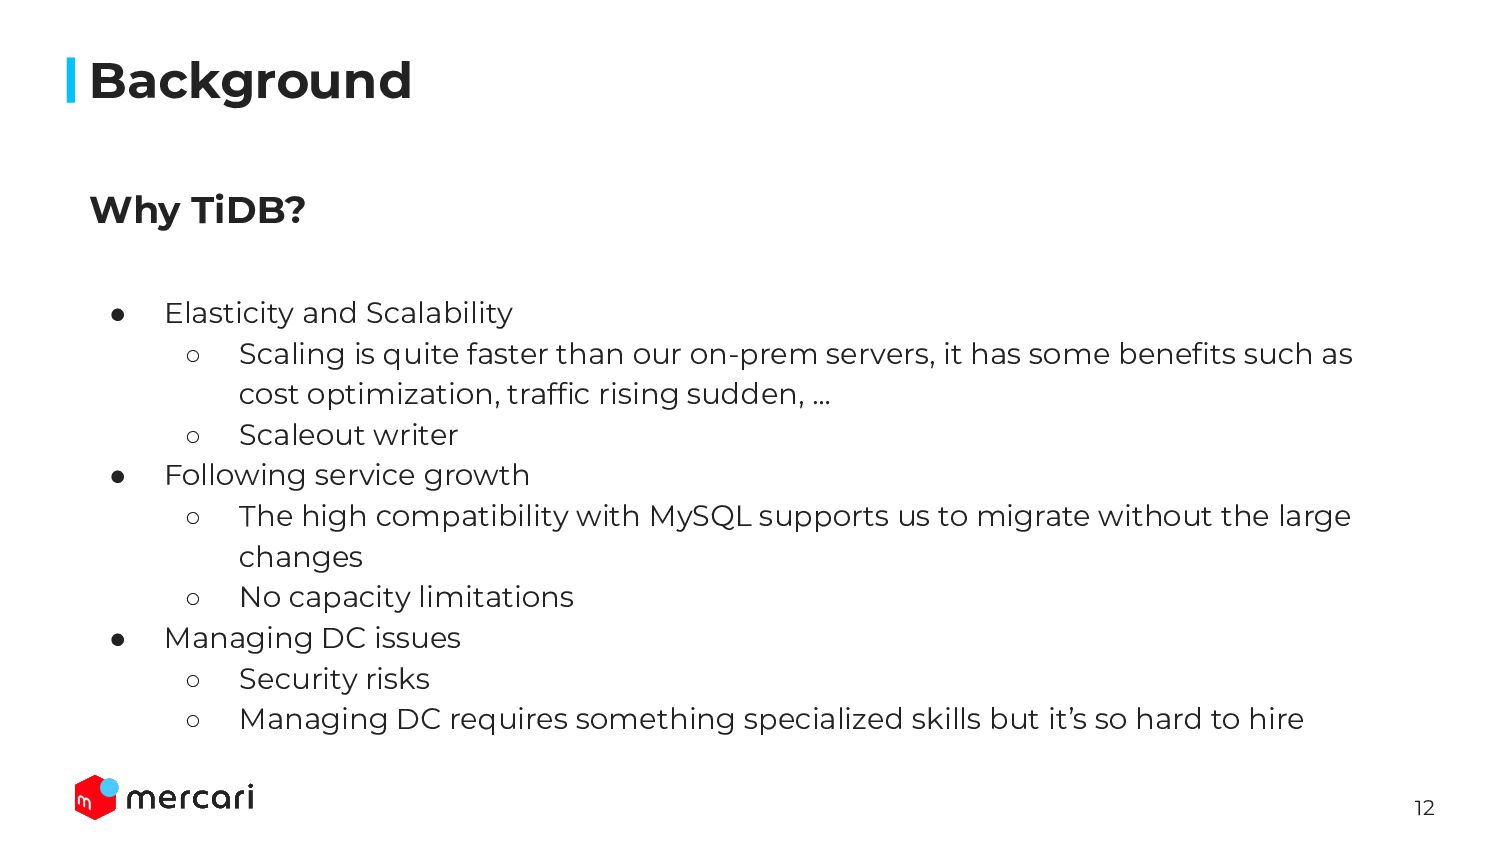
faster than our on-prem servers, it has some benefits such as cost optimization, traffic rising sudden, … ◦ Scaleout writer • Following service growth ◦ The high compatibility with MySQL supports us to migrate without the large changes ◦ No capacity limitations • Managing DC issues ◦ Security risks ◦ Managing DC requires something specialized skills but it’s so hard to hire Why TiDB?
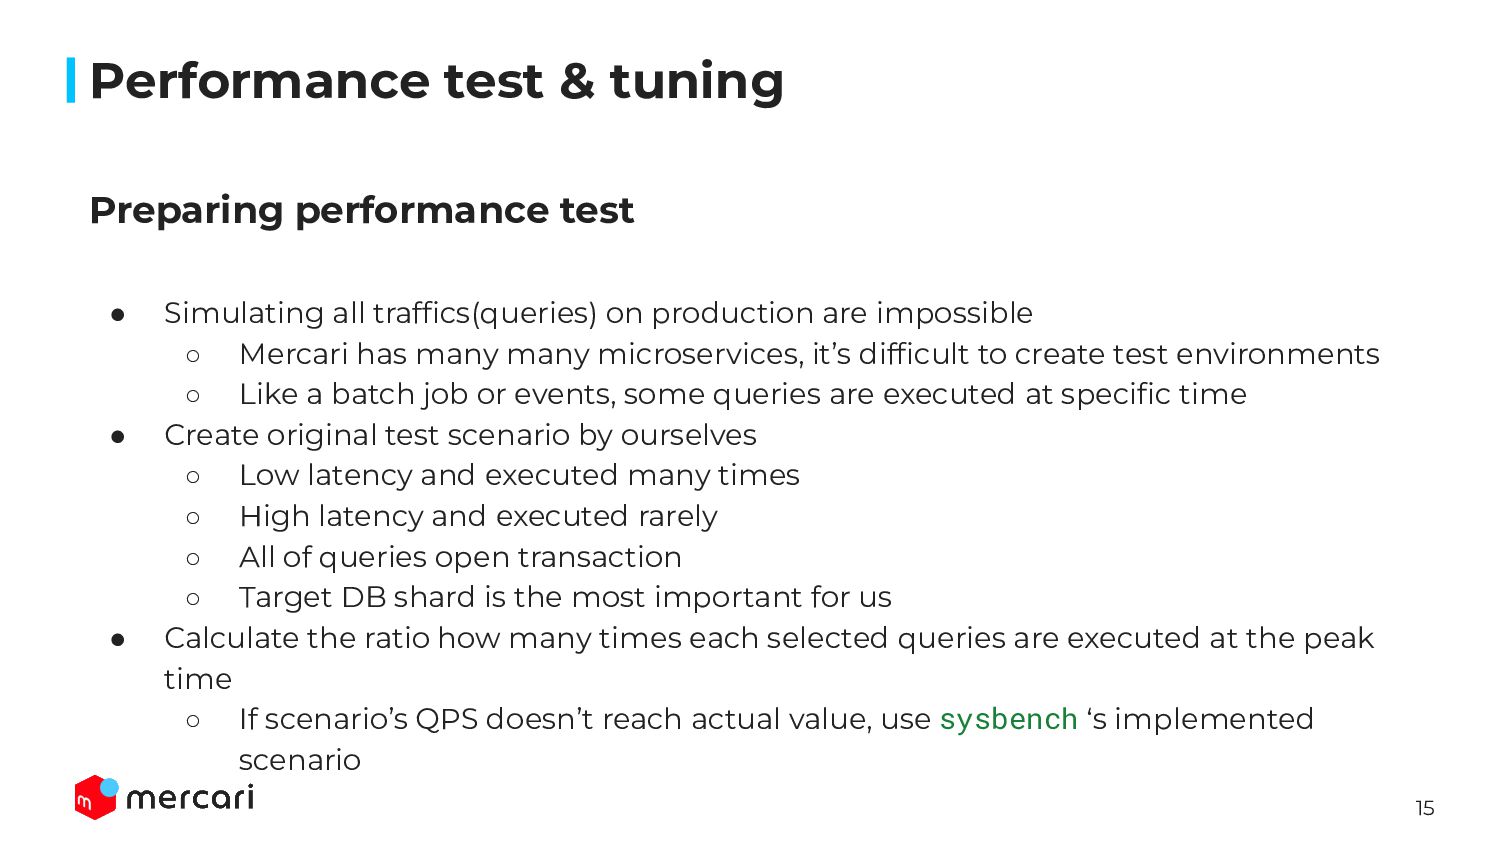
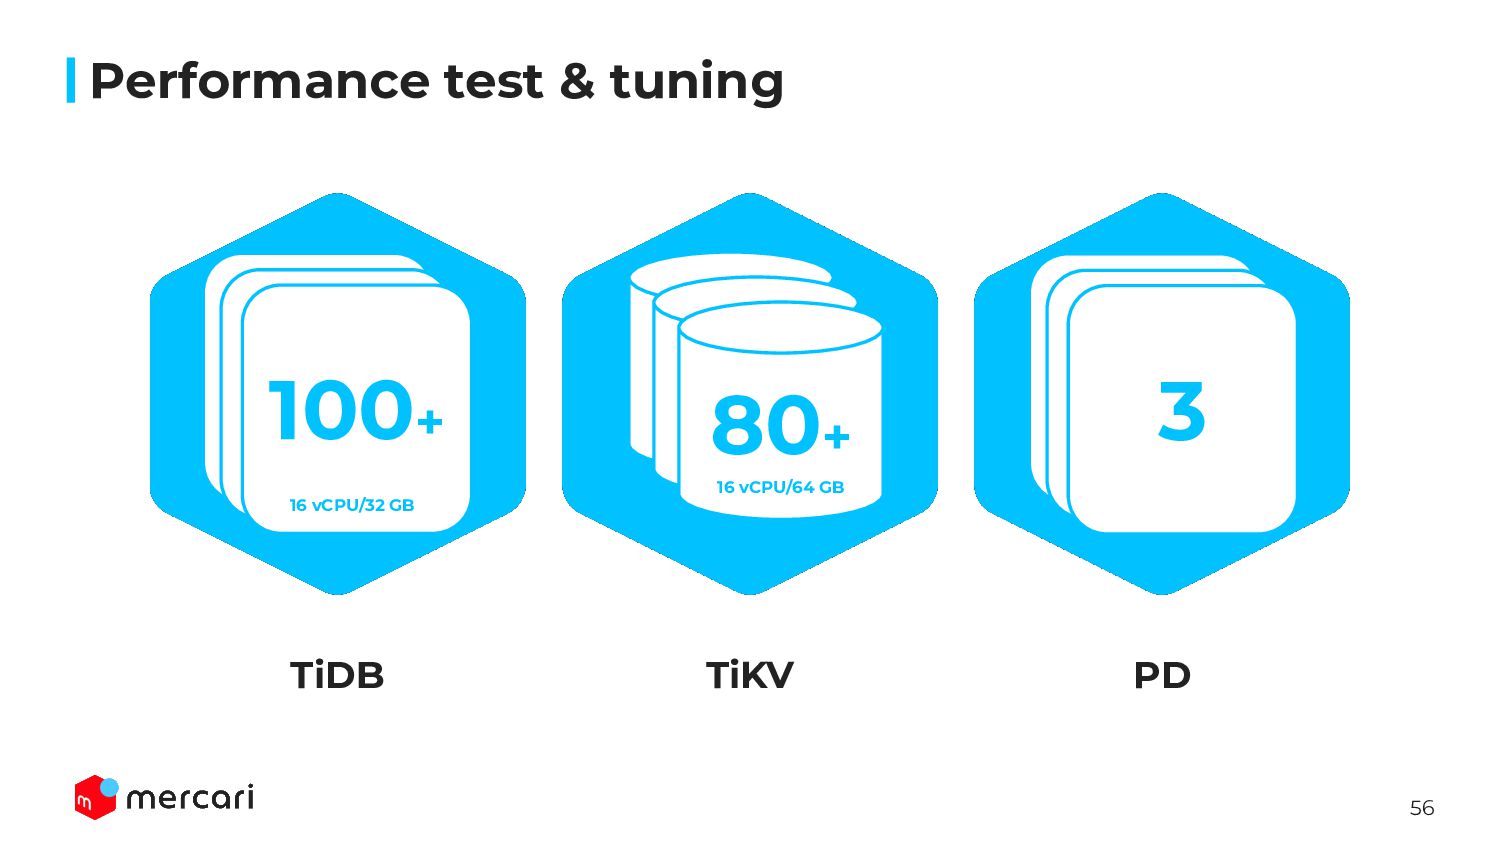
Mercari has many many microservices, it’s difficult to create test environments ◦ Like a batch job or events, some queries are executed at specific time • Create original test scenario by ourselves ◦ Low latency and executed many times ◦ High latency and executed rarely ◦ All of queries open transaction ◦ Target DB shard is the most important for us • Calculate the ratio how many times each selected queries are executed at the peak time ◦ If scenario’s QPS doesn’t reach actual value, use sysbench ‘s implemented scenario Preparing performance test Performance test & tuning
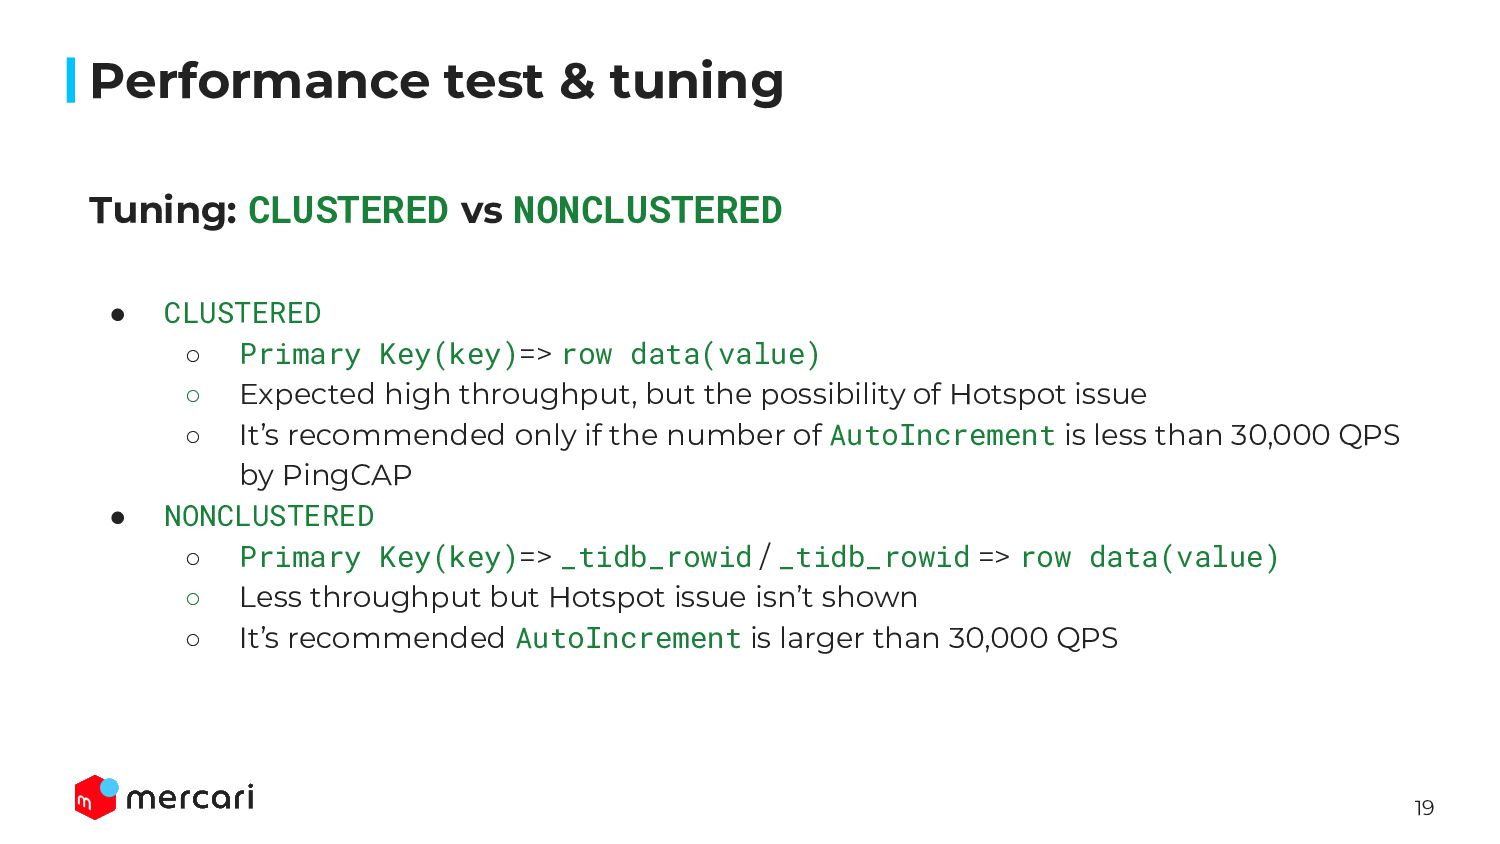
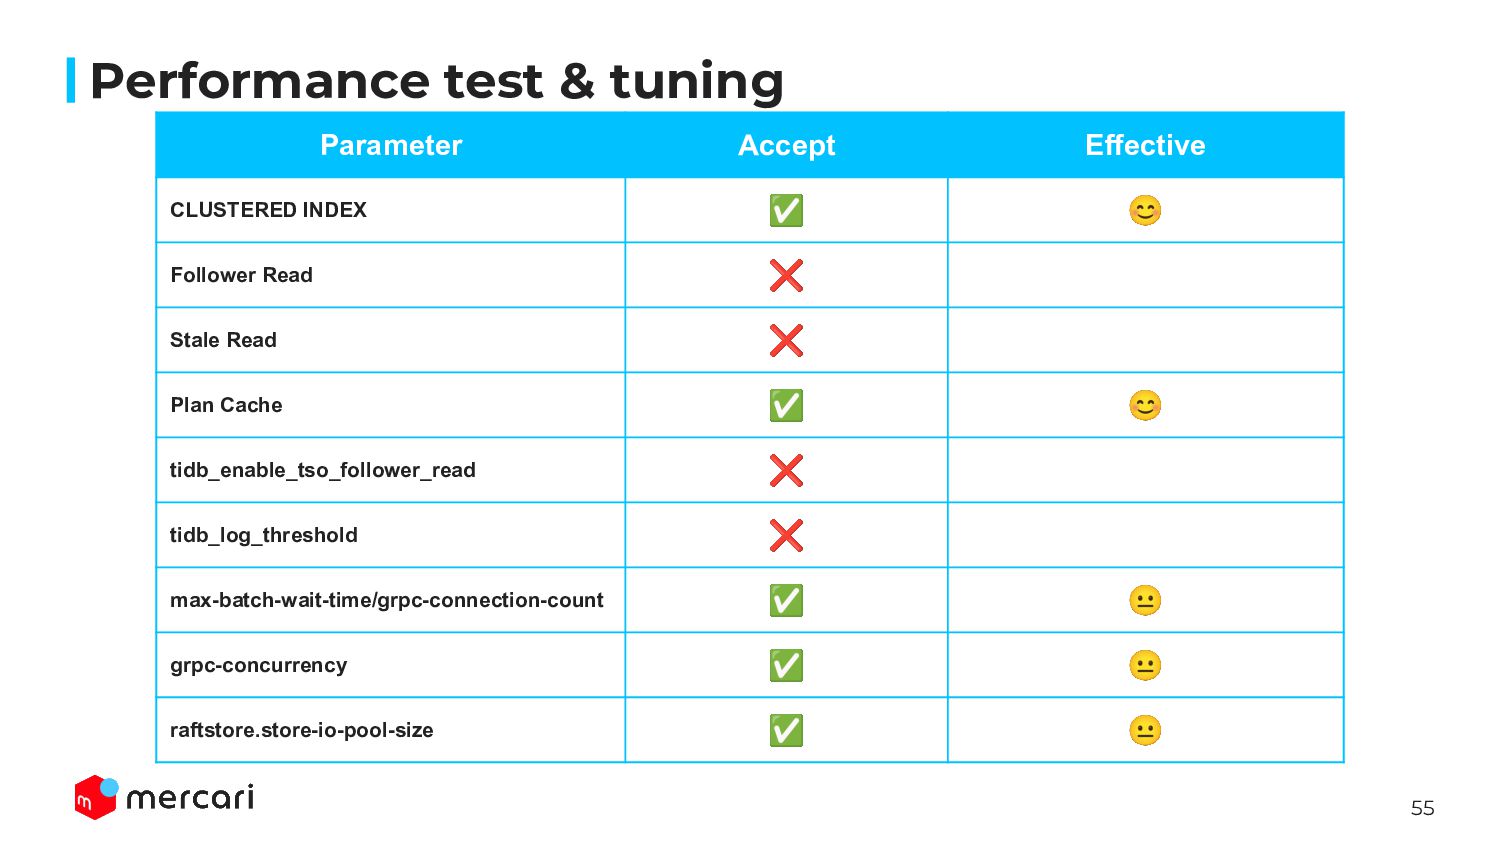
row data(value) ◦ Expected high throughput, but the possibility of Hotspot issue ◦ It’s recommended only if the number of AutoIncrement is less than 30,000 QPS by PingCAP • NONCLUSTERED ◦ Primary Key(key)=> _tidb_rowid / _tidb_rowid => row data(value) ◦ Less throughput but Hotspot issue isn’t shown ◦ It’s recommended AutoIncrement is larger than 30,000 QPS Performance test & tuning
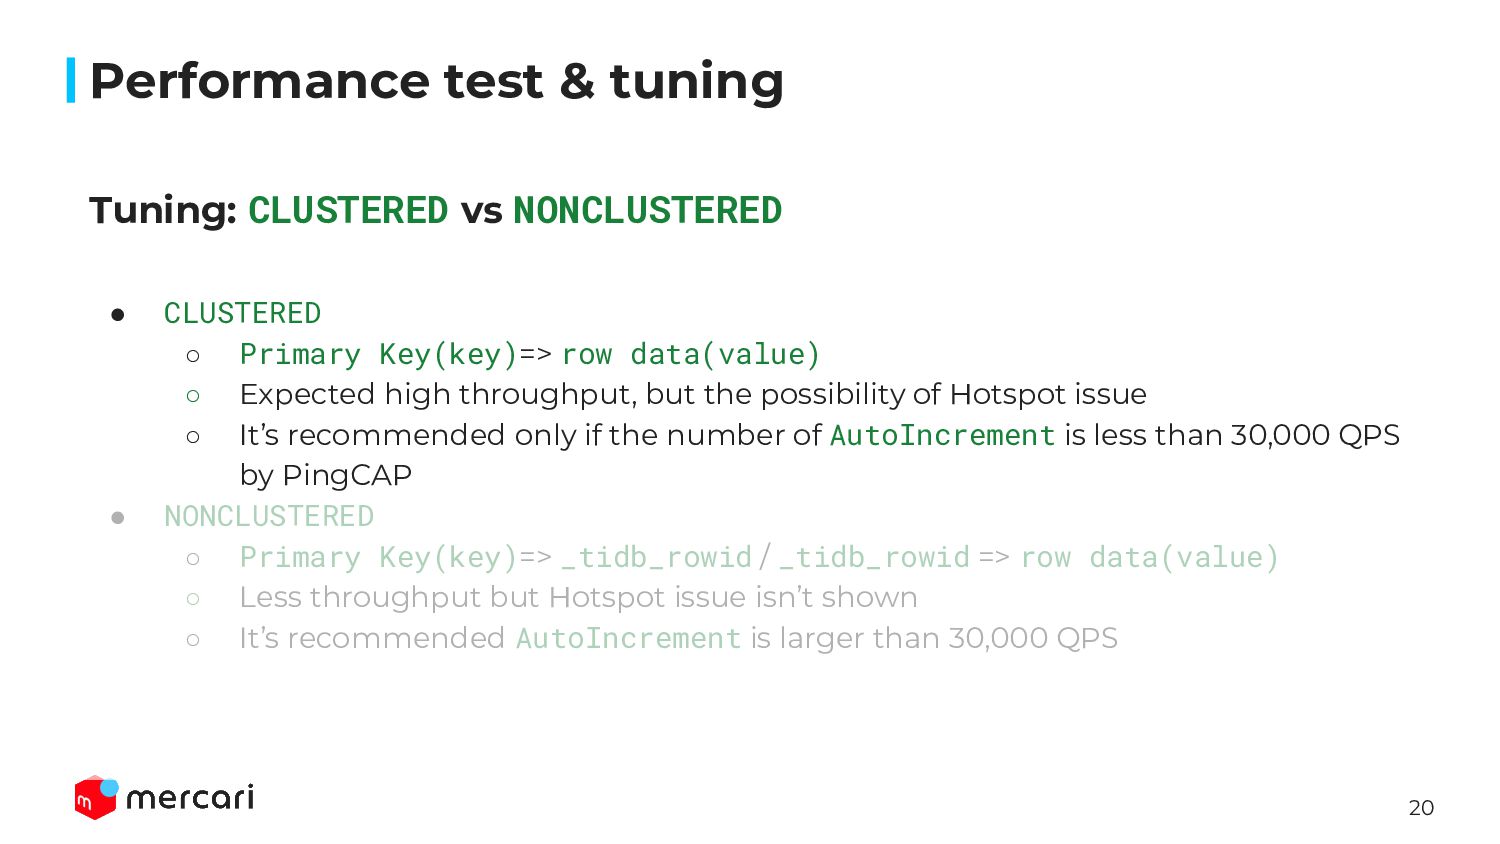
row data(value) ◦ Expected high throughput, but the possibility of Hotspot issue ◦ It’s recommended only if the number of AutoIncrement is less than 30,000 QPS by PingCAP • NONCLUSTERED ◦ Primary Key(key)=> _tidb_rowid / _tidb_rowid => row data(value) ◦ Less throughput but Hotspot issue isn’t shown ◦ It’s recommended AutoIncrement is larger than 30,000 QPS Performance test & tuning
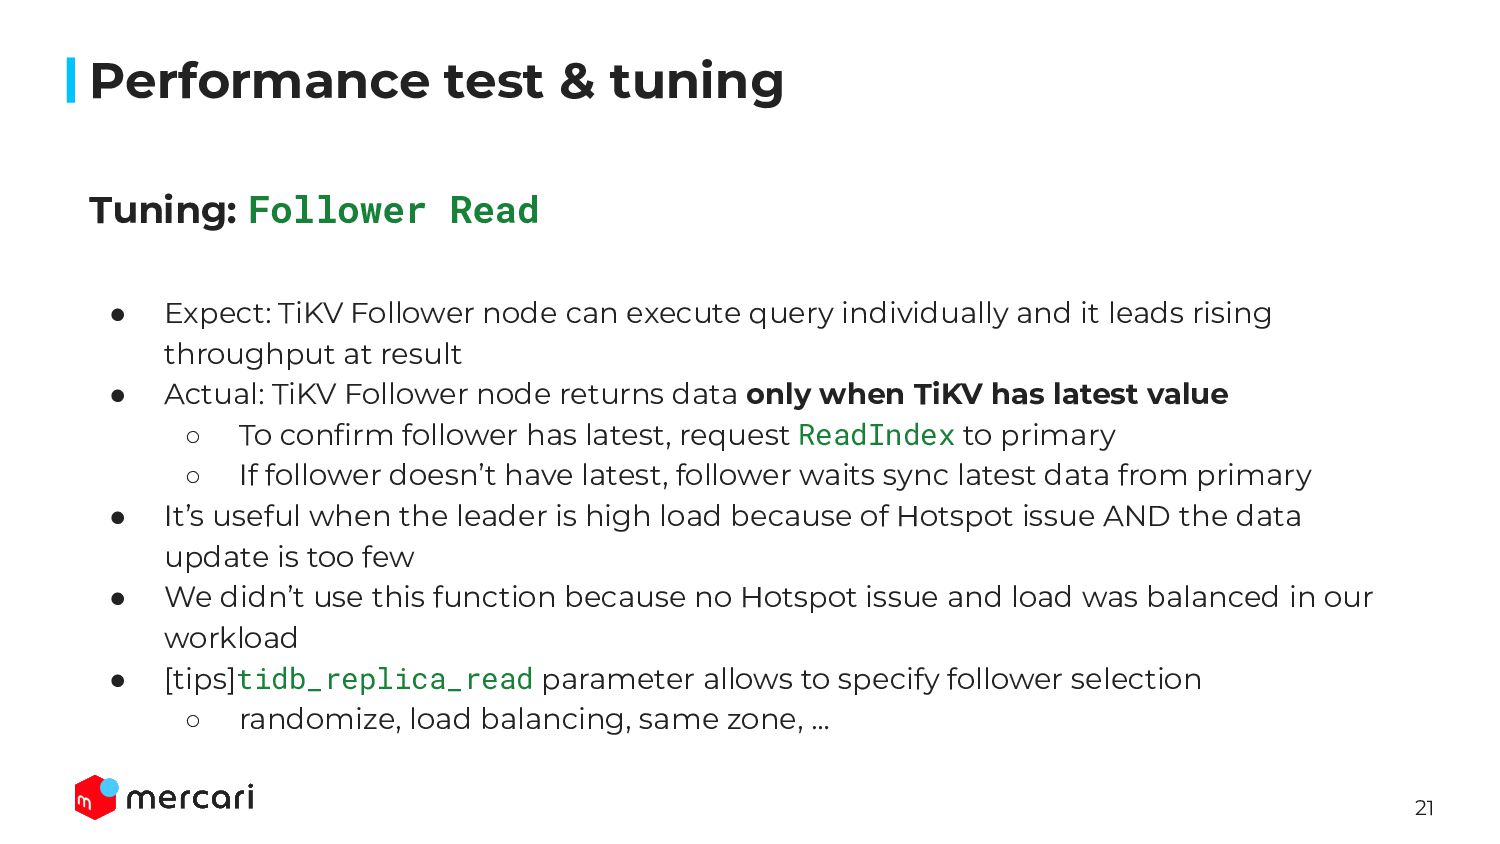
execute query individually and it leads rising throughput at result • Actual: TiKV Follower node returns data only when TiKV has latest value ◦ To confirm follower has latest, request ReadIndex to primary ◦ If follower doesn’t have latest, follower waits sync latest data from primary • It’s useful when the leader is high load because of Hotspot issue AND the data update is too few • We didn’t use this function because no Hotspot issue and load was balanced in our workload • [tips]tidb_replica_read parameter allows to specify follower selection ◦ randomize, load balancing, same zone, … Performance test & tuning
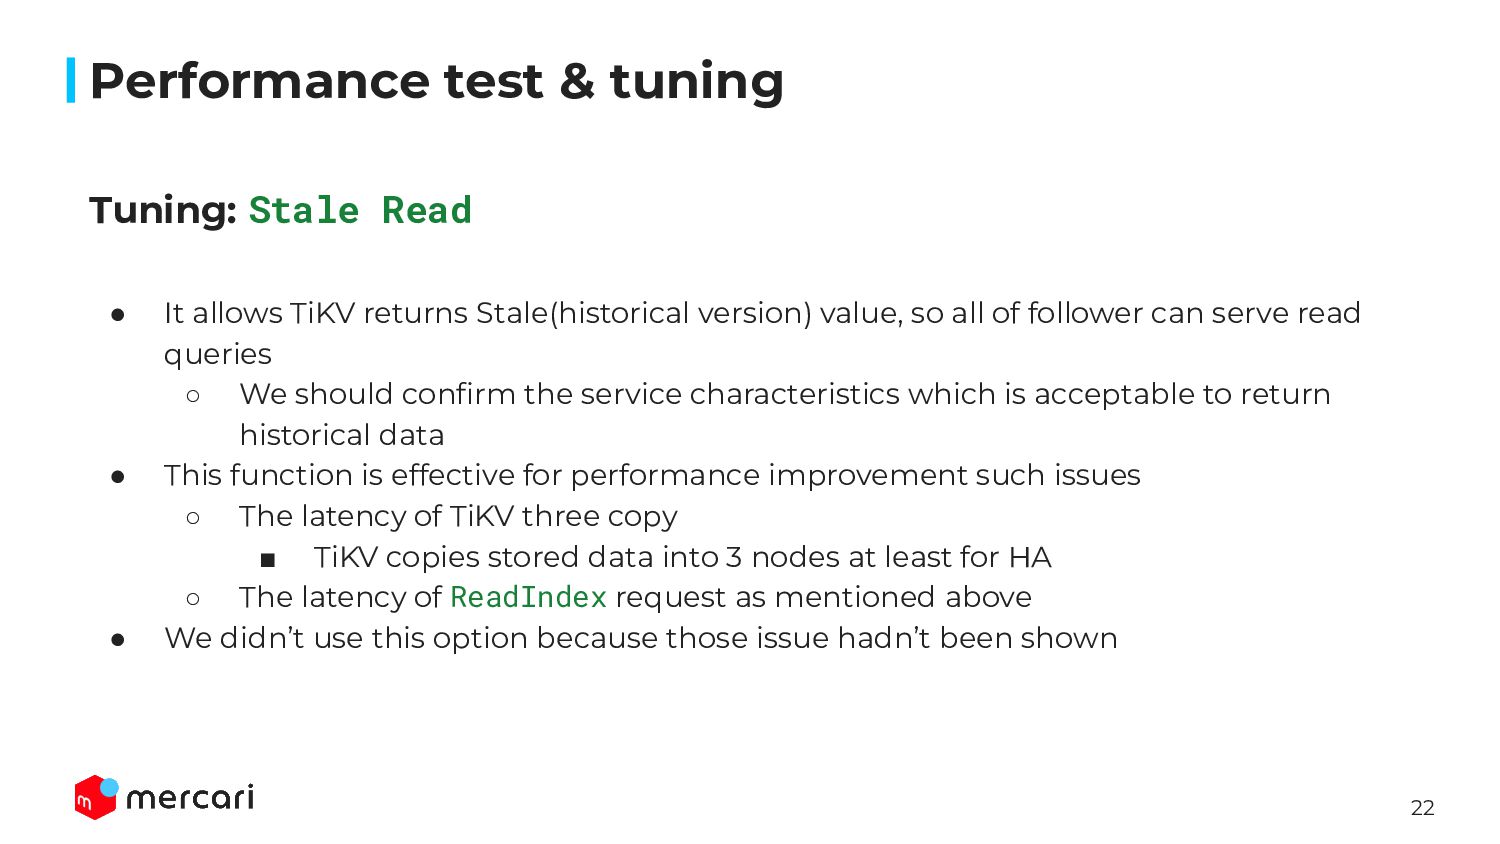
version) value, so all of follower can serve read queries ◦ We should confirm the service characteristics which is acceptable to return historical data • This function is effective for performance improvement such issues ◦ The latency of TiKV three copy ▪ TiKV copies stored data into 3 nodes at least for HA ◦ The latency of ReadIndex request as mentioned above • We didn’t use this option because those issue hadn’t been shown Performance test & tuning
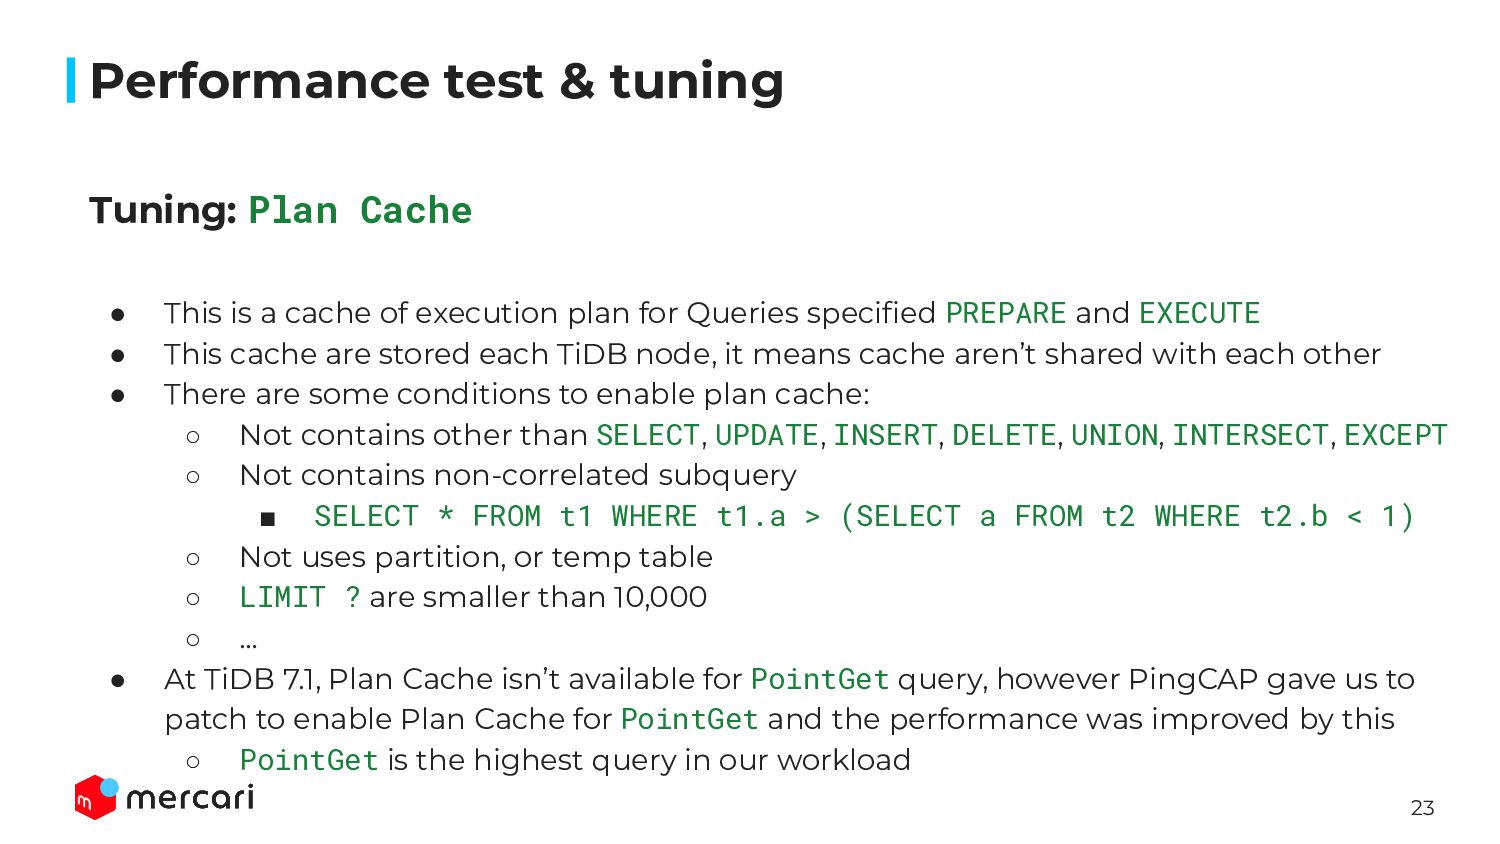
execution plan for Queries specified PREPARE and EXECUTE • This cache are stored each TiDB node, it means cache aren’t shared with each other • There are some conditions to enable plan cache: ◦ Not contains other than SELECT, UPDATE, INSERT, DELETE, UNION, INTERSECT, EXCEPT ◦ Not contains non-correlated subquery ▪ SELECT * FROM t1 WHERE t1.a > (SELECT a FROM t2 WHERE t2.b < 1) ◦ Not uses partition, or temp table ◦ LIMIT ? are smaller than 10,000 ◦ … • At TiDB 7.1, Plan Cache isn’t available for PointGet query, however PingCAP gave us to patch to enable Plan Cache for PointGet and the performance was improved by this ◦ PointGet is the highest query in our workload Performance test & tuning
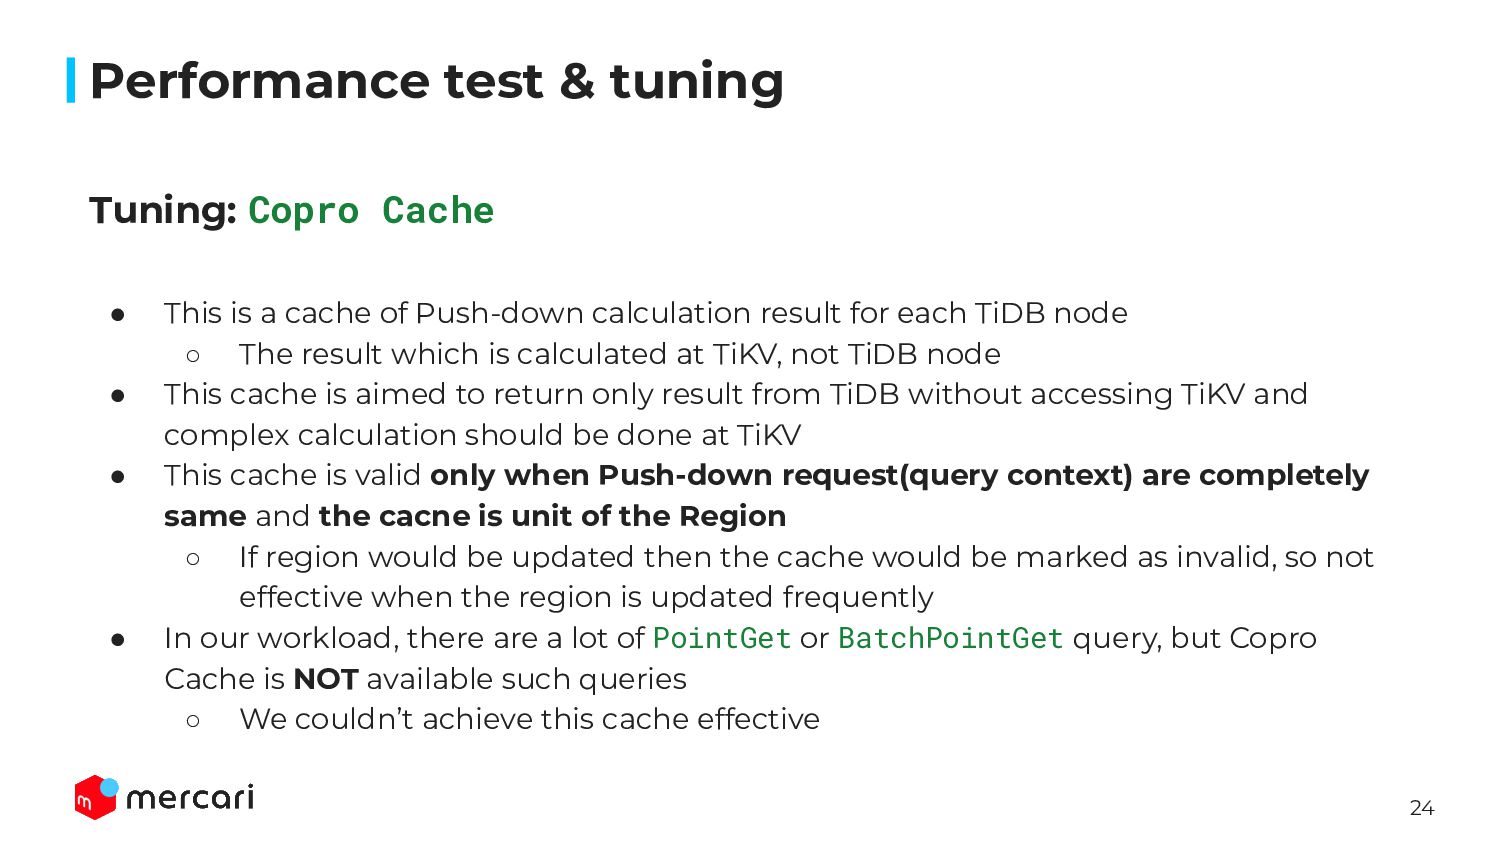
Push-down calculation result for each TiDB node ◦ The result which is calculated at TiKV, not TiDB node • This cache is aimed to return only result from TiDB without accessing TiKV and complex calculation should be done at TiKV • This cache is valid only when Push-down request(query context) are completely same and the cacne is unit of the Region ◦ If region would be updated then the cache would be marked as invalid, so not effective when the region is updated frequently • In our workload, there are a lot of PointGet or BatchPointGet query, but Copro Cache is NOT available such queries ◦ We couldn’t achieve this cache effective Performance test & tuning
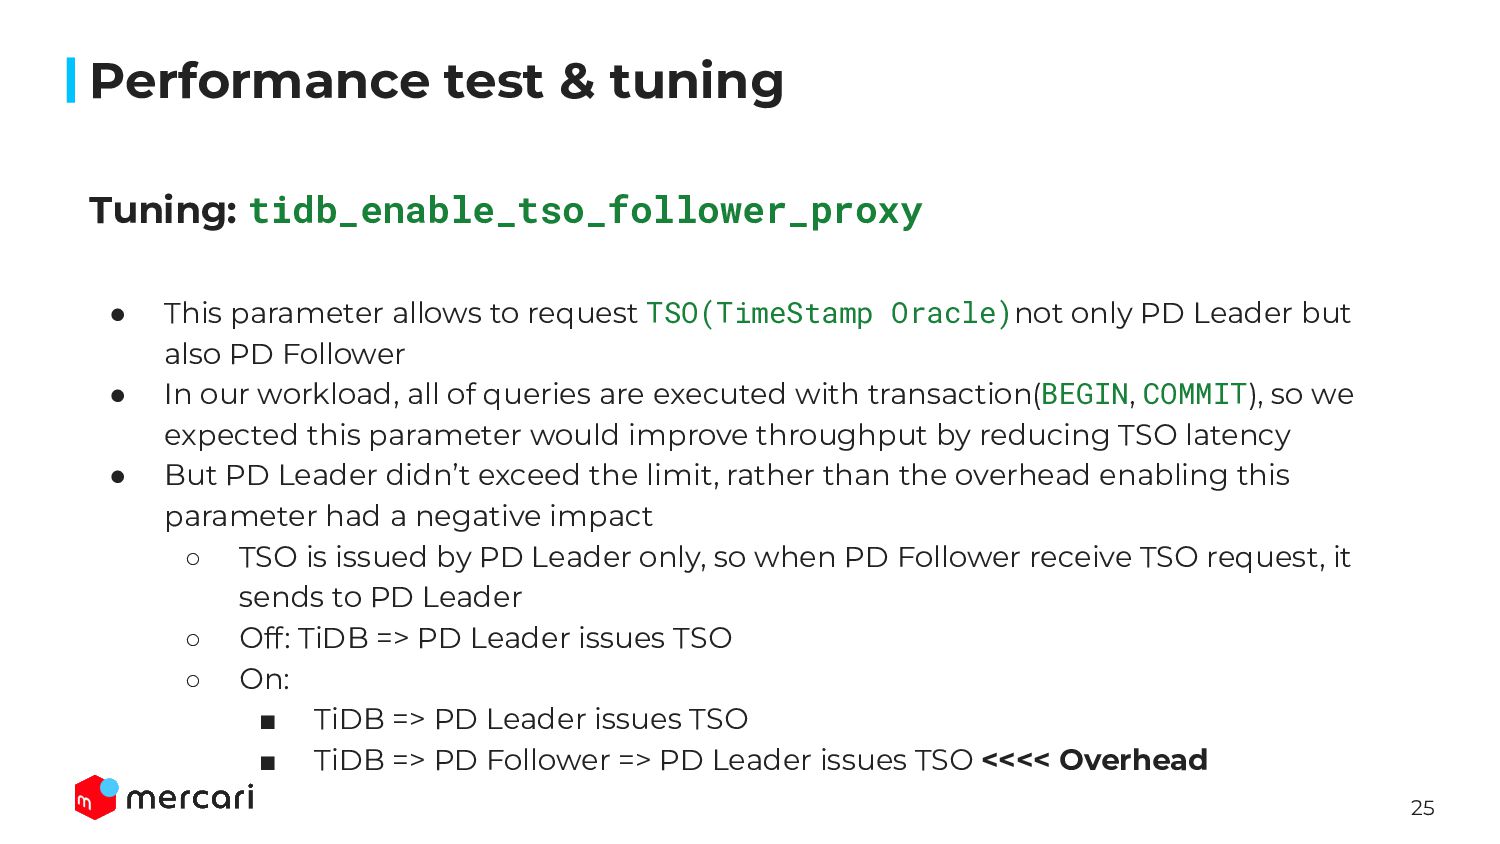
Oracle)not only PD Leader but also PD Follower • In our workload, all of queries are executed with transaction(BEGIN, COMMIT), so we expected this parameter would improve throughput by reducing TSO latency • But PD Leader didn’t exceed the limit, rather than the overhead enabling this parameter had a negative impact ◦ TSO is issued by PD Leader only, so when PD Follower receive TSO request, it sends to PD Leader ◦ Off: TiDB => PD Leader issues TSO ◦ On: ▪ TiDB => PD Leader issues TSO ▪ TiDB => PD Follower => PD Leader issues TSO <<<< Overhead Performance test & tuning
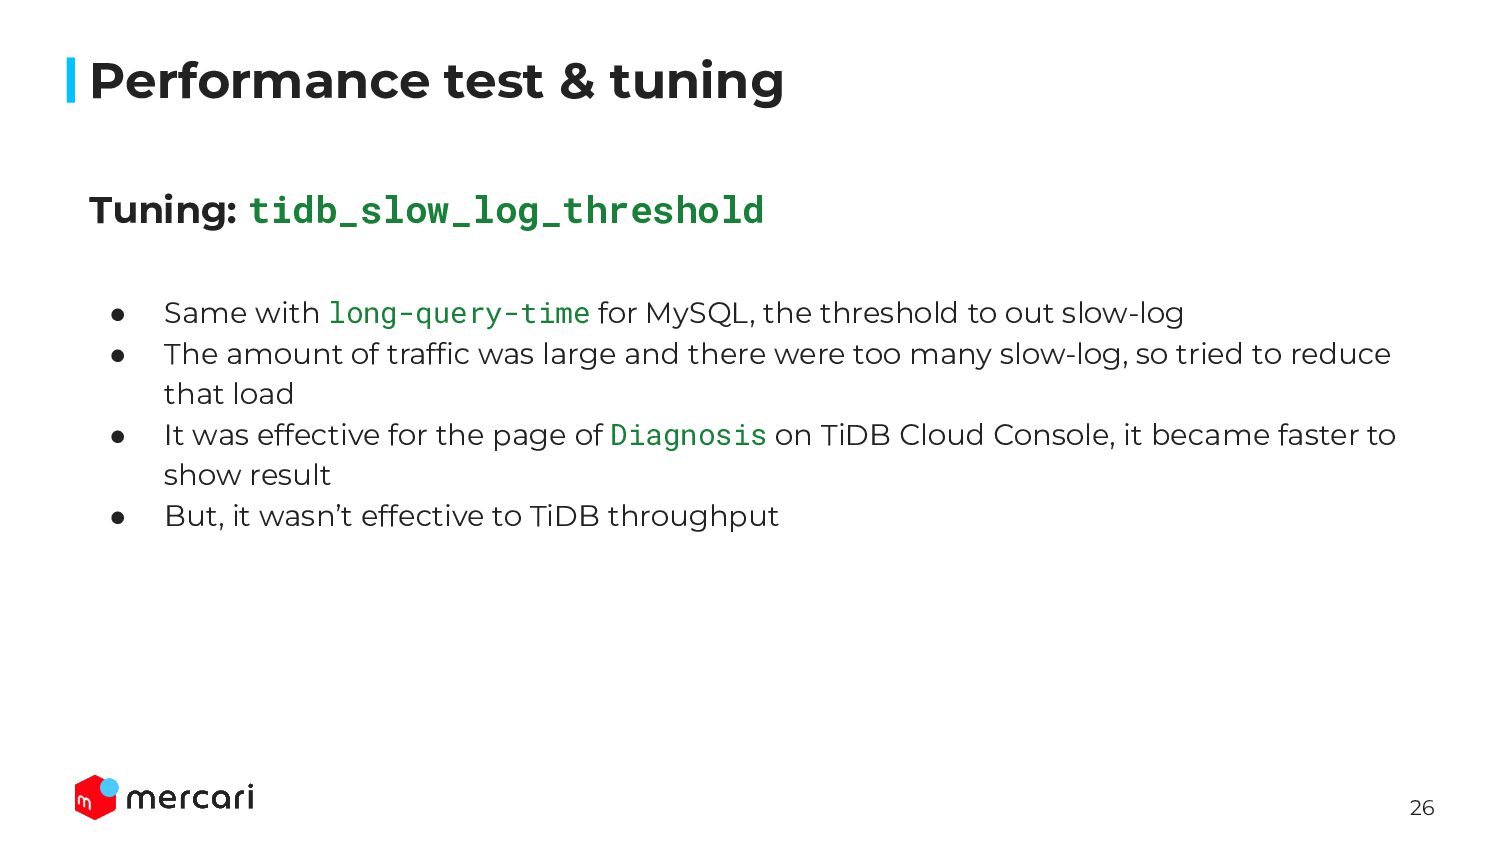
threshold to out slow-log • The amount of traffic was large and there were too many slow-log, so tried to reduce that load • It was effective for the page of Diagnosis on TiDB Cloud Console, it became faster to show result • But, it wasn’t effective to TiDB throughput Performance test & tuning
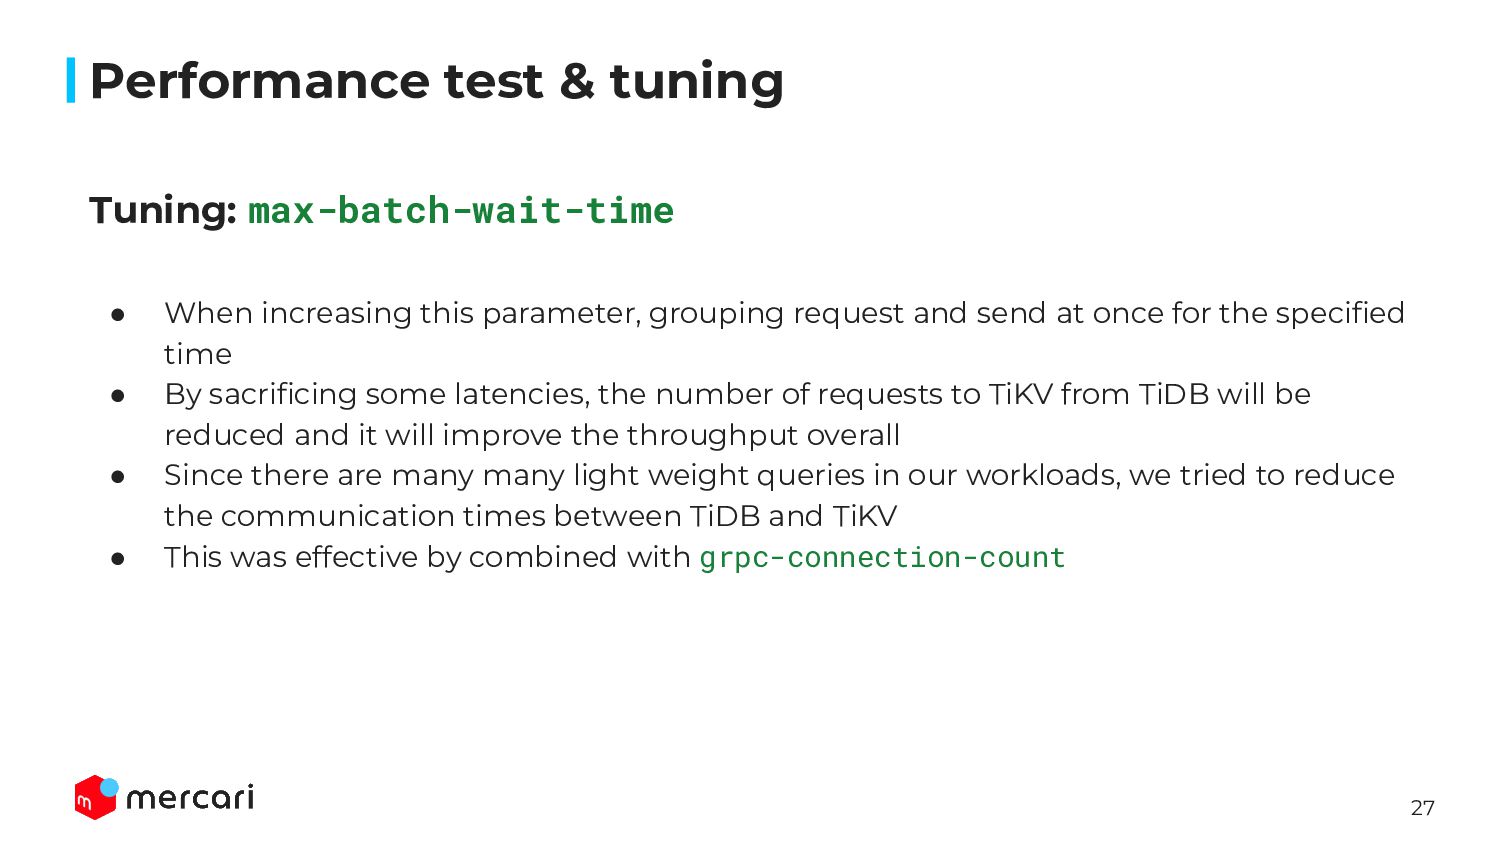
and send at once for the specified time • By sacrificing some latencies, the number of requests to TiKV from TiDB will be reduced and it will improve the throughput overall • Since there are many many light weight queries in our workloads, we tried to reduce the communication times between TiDB and TiKV • This was effective by combined with grpc-connection-count Performance test & tuning
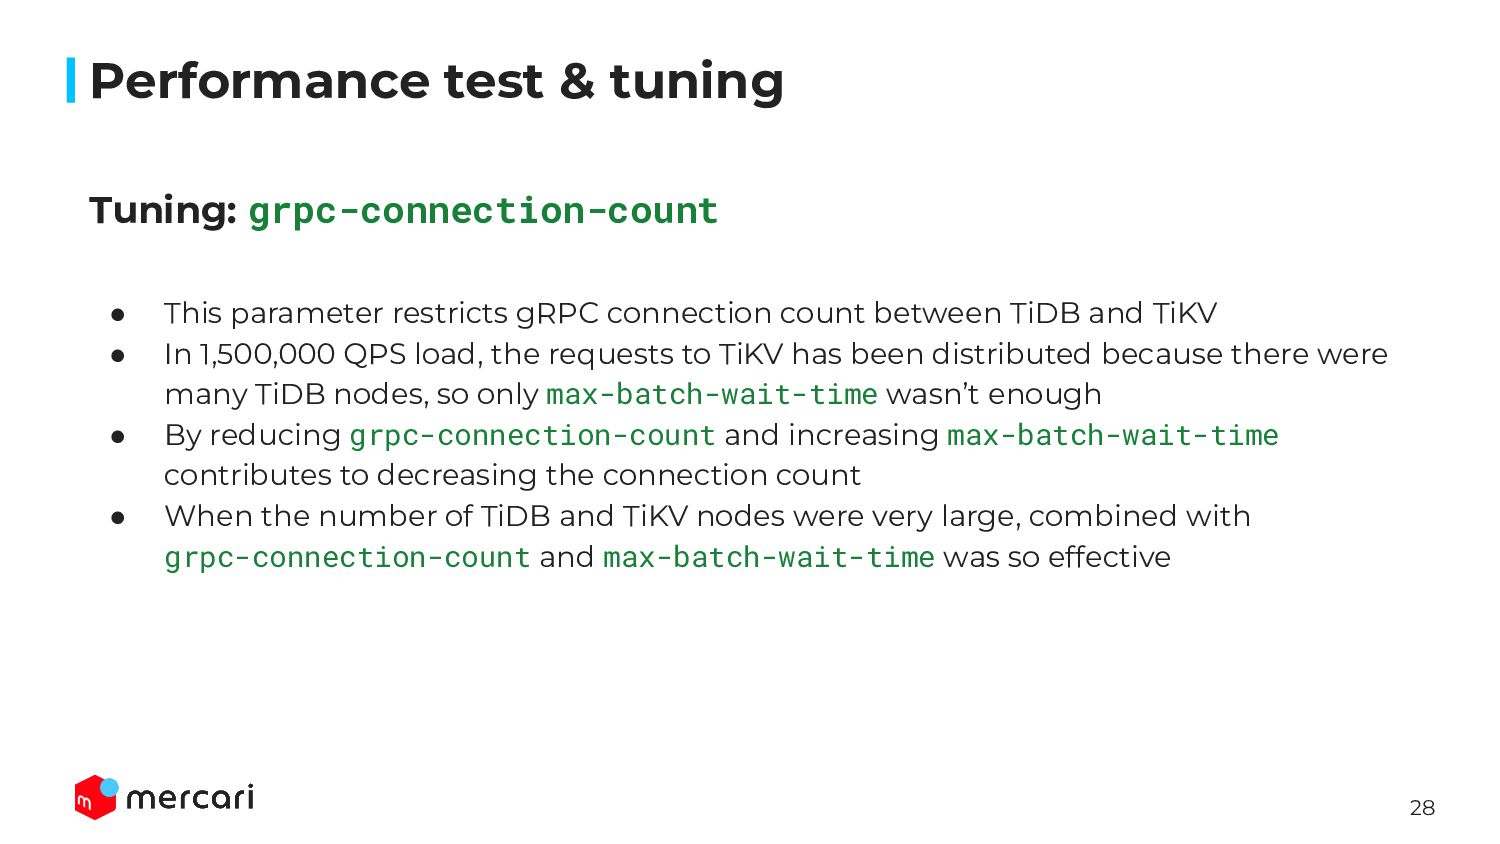
between TiDB and TiKV • In 1,500,000 QPS load, the requests to TiKV has been distributed because there were many TiDB nodes, so only max-batch-wait-time wasn’t enough • By reducing grpc-connection-count and increasing max-batch-wait-time contributes to decreasing the connection count • When the number of TiDB and TiKV nodes were very large, combined with grpc-connection-count and max-batch-wait-time was so effective Performance test & tuning
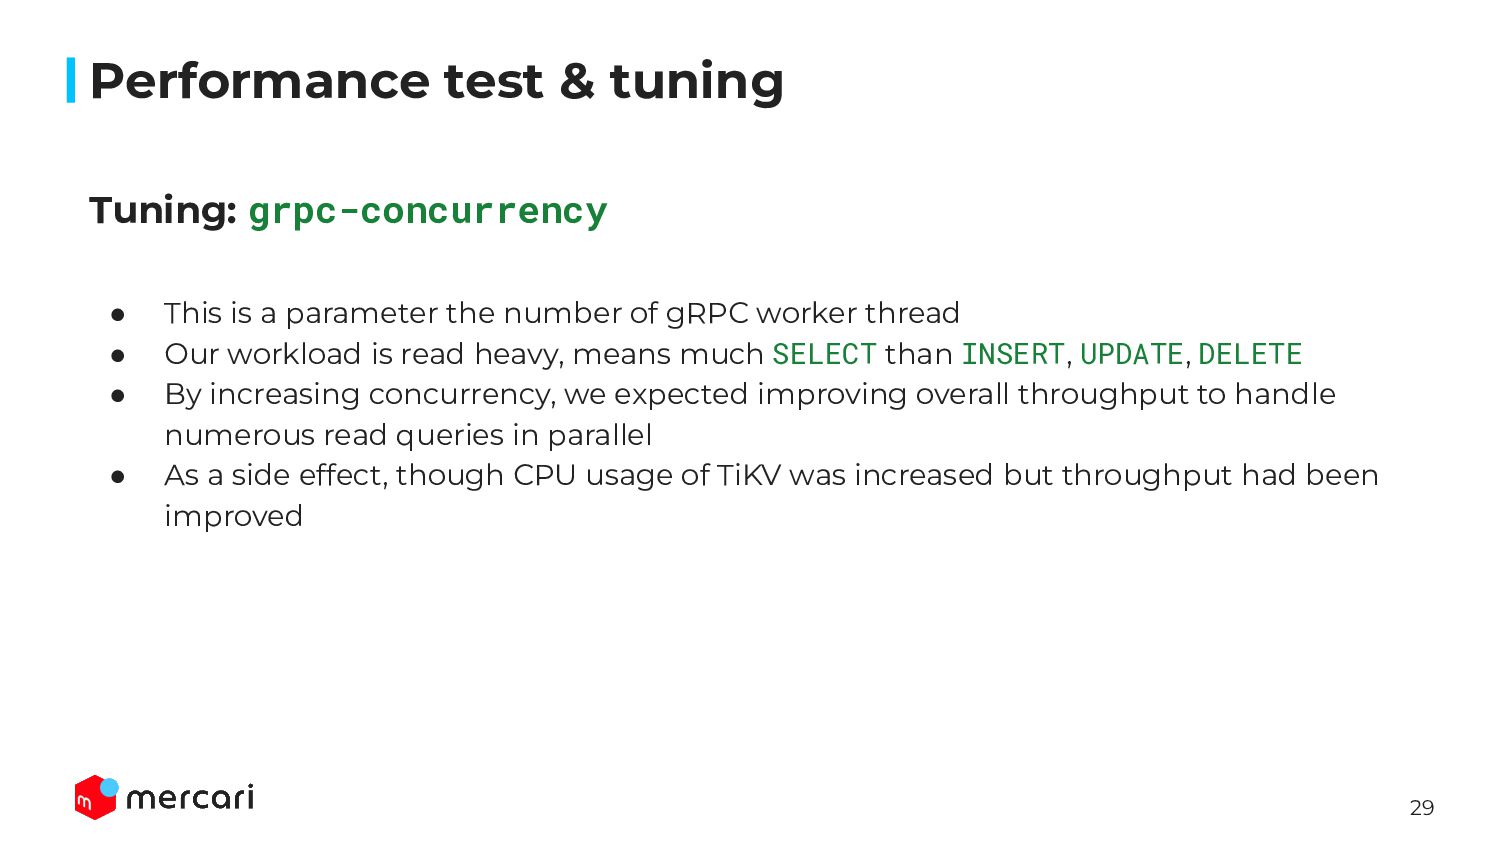
of gRPC worker thread • Our workload is read heavy, means much SELECT than INSERT, UPDATE, DELETE • By increasing concurrency, we expected improving overall throughput to handle numerous read queries in parallel • As a side effect, though CPU usage of TiKV was increased but throughput had been improved Performance test & tuning
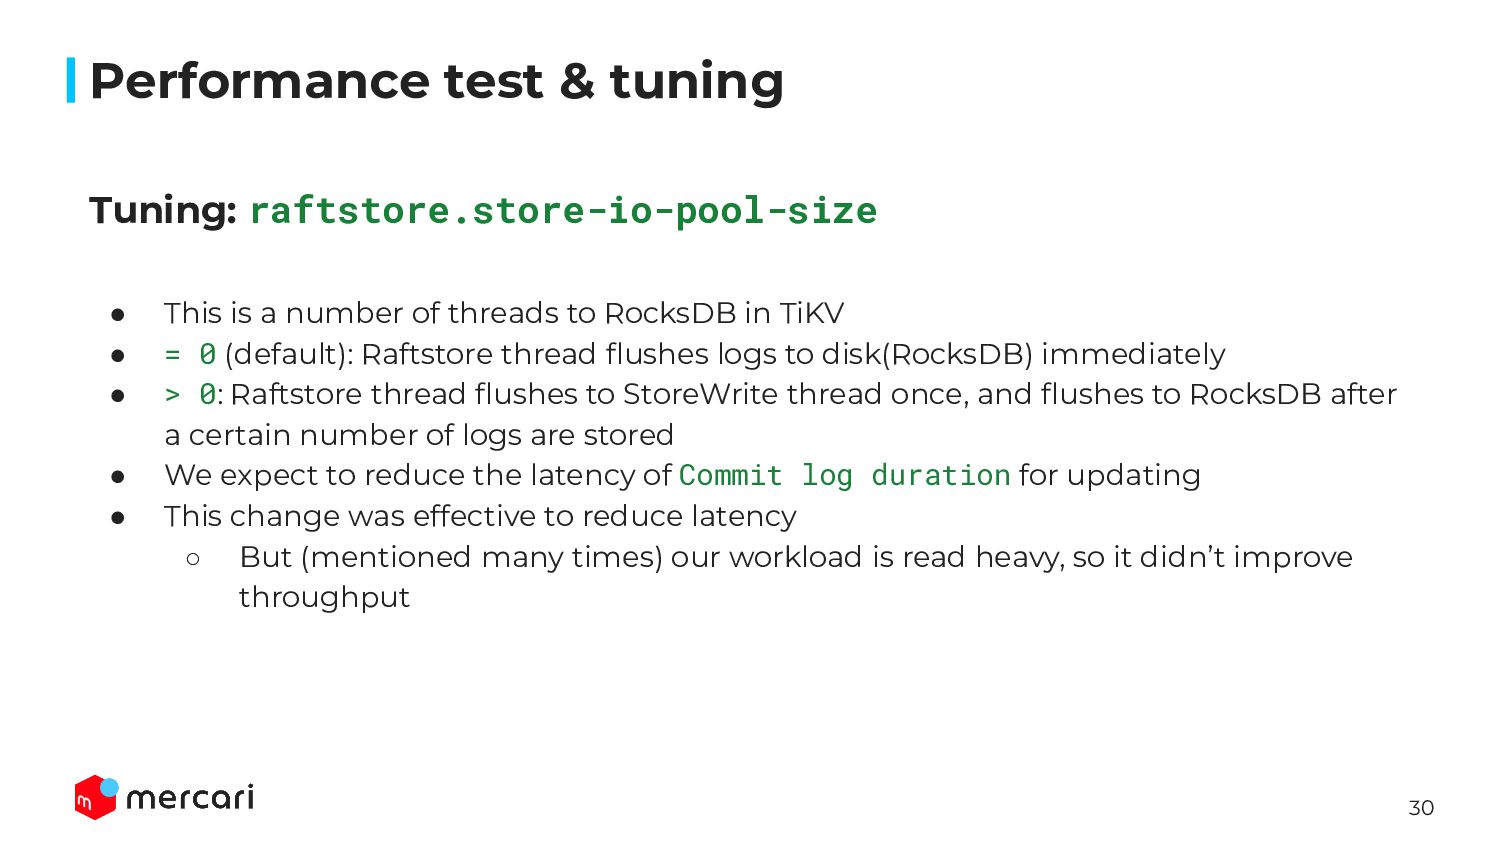
to RocksDB in TiKV • = 0 (default): Raftstore thread flushes logs to disk(RocksDB) immediately • > 0: Raftstore thread flushes to StoreWrite thread once, and flushes to RocksDB after a certain number of logs are stored • We expect to reduce the latency of Commit log duration for updating • This change was effective to reduce latency ◦ But (mentioned many times) our workload is read heavy, so it didn’t improve throughput Performance test & tuning
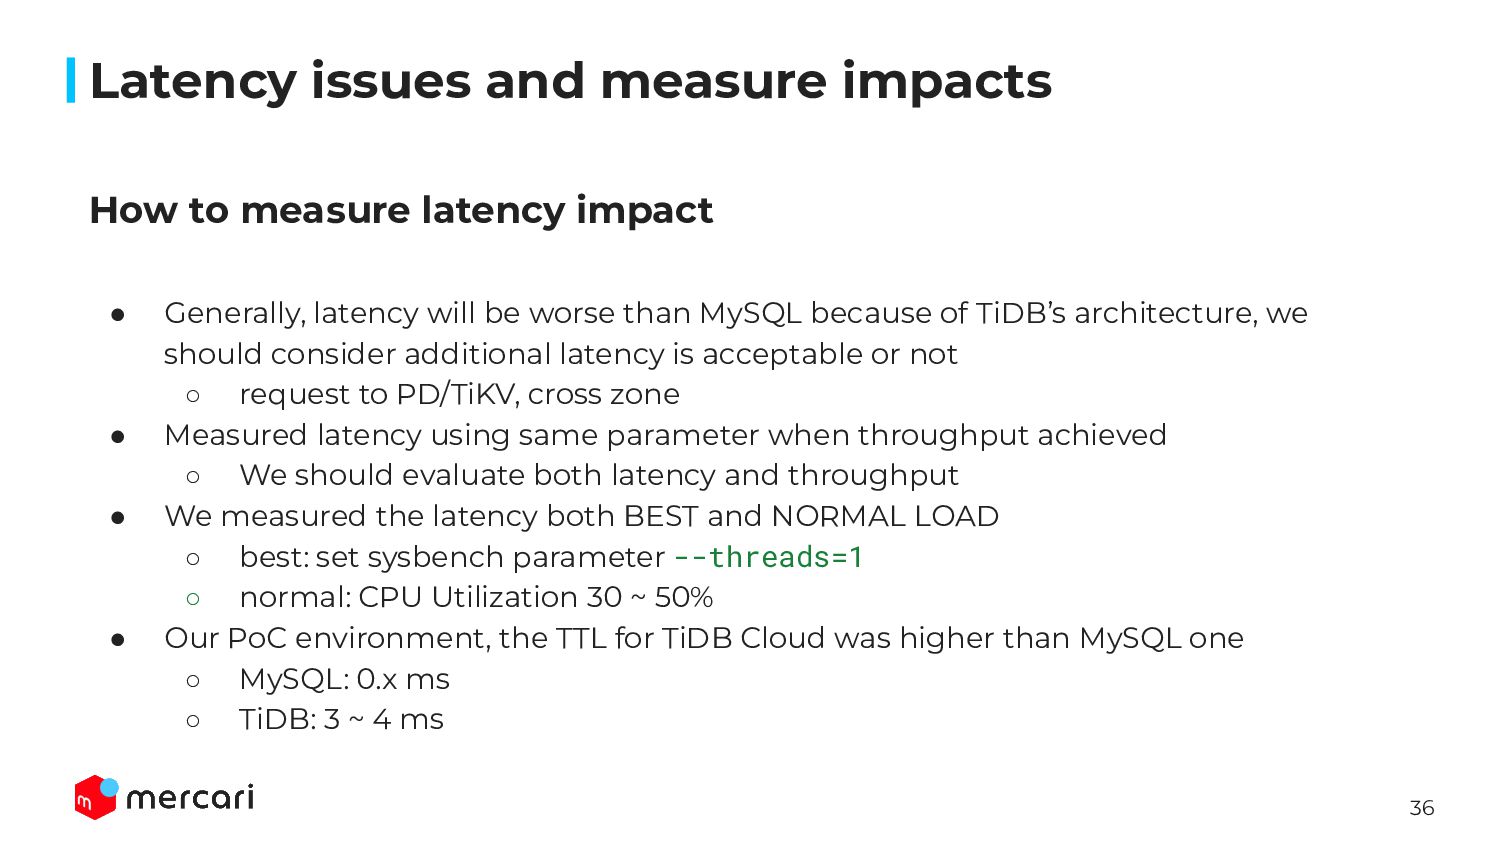
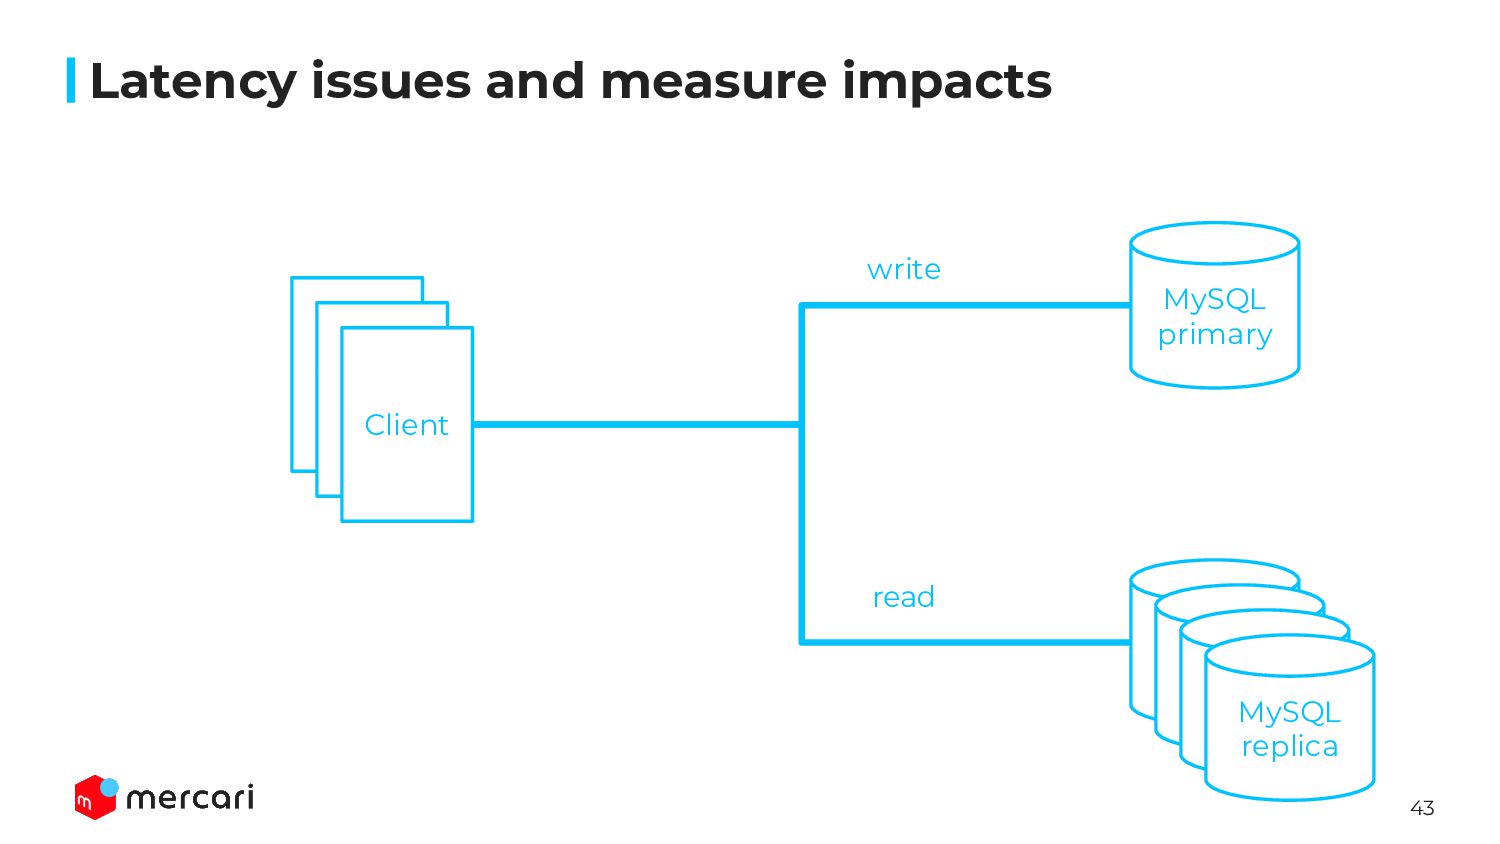
be worse than MySQL because of TiDB’s architecture, we should consider additional latency is acceptable or not ◦ request to PD/TiKV, cross zone • Measured latency using same parameter when throughput achieved ◦ We should evaluate both latency and throughput • We measured the latency both BEST and NORMAL LOAD ◦ best: set sysbench parameter --threads=1 ◦ normal: CPU Utilization 30 ~ 50% • Our PoC environment, the TTL for TiDB Cloud was higher than MySQL one ◦ MySQL: 0.x ms ◦ TiDB: 3 ~ 4 ms Latency issues and measure impacts
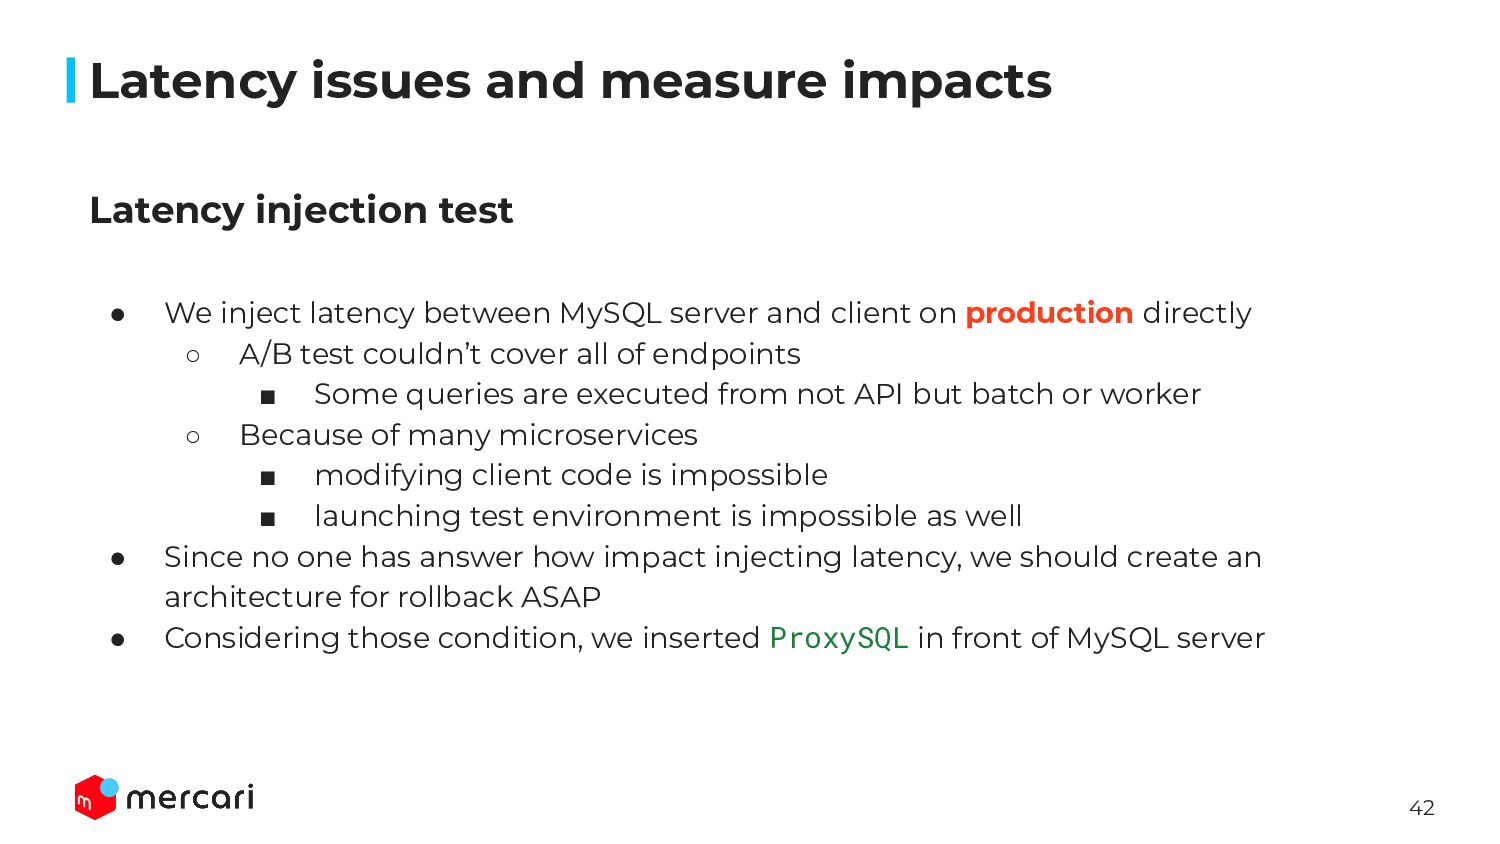
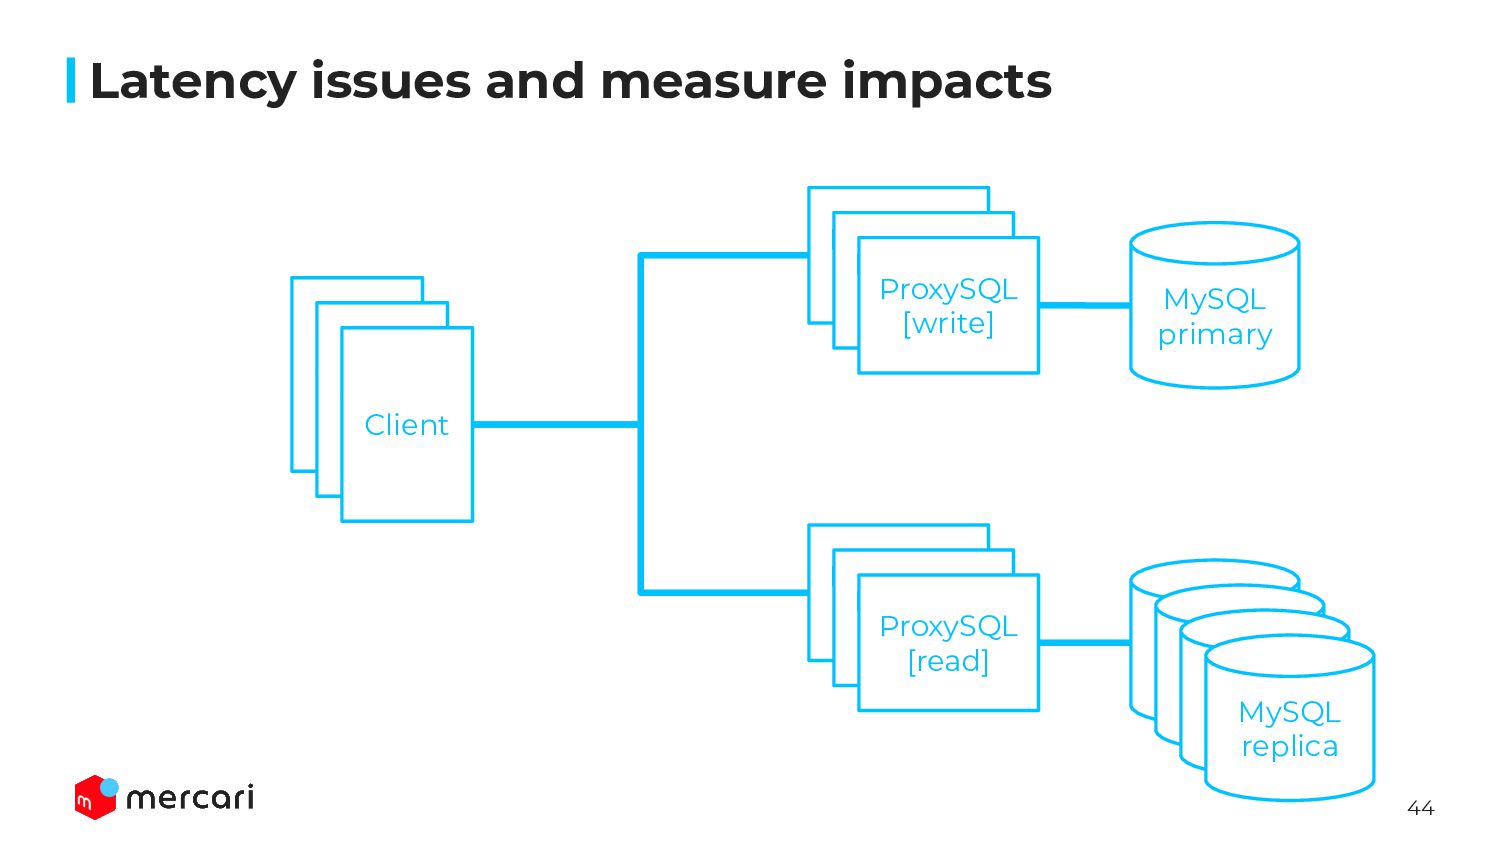
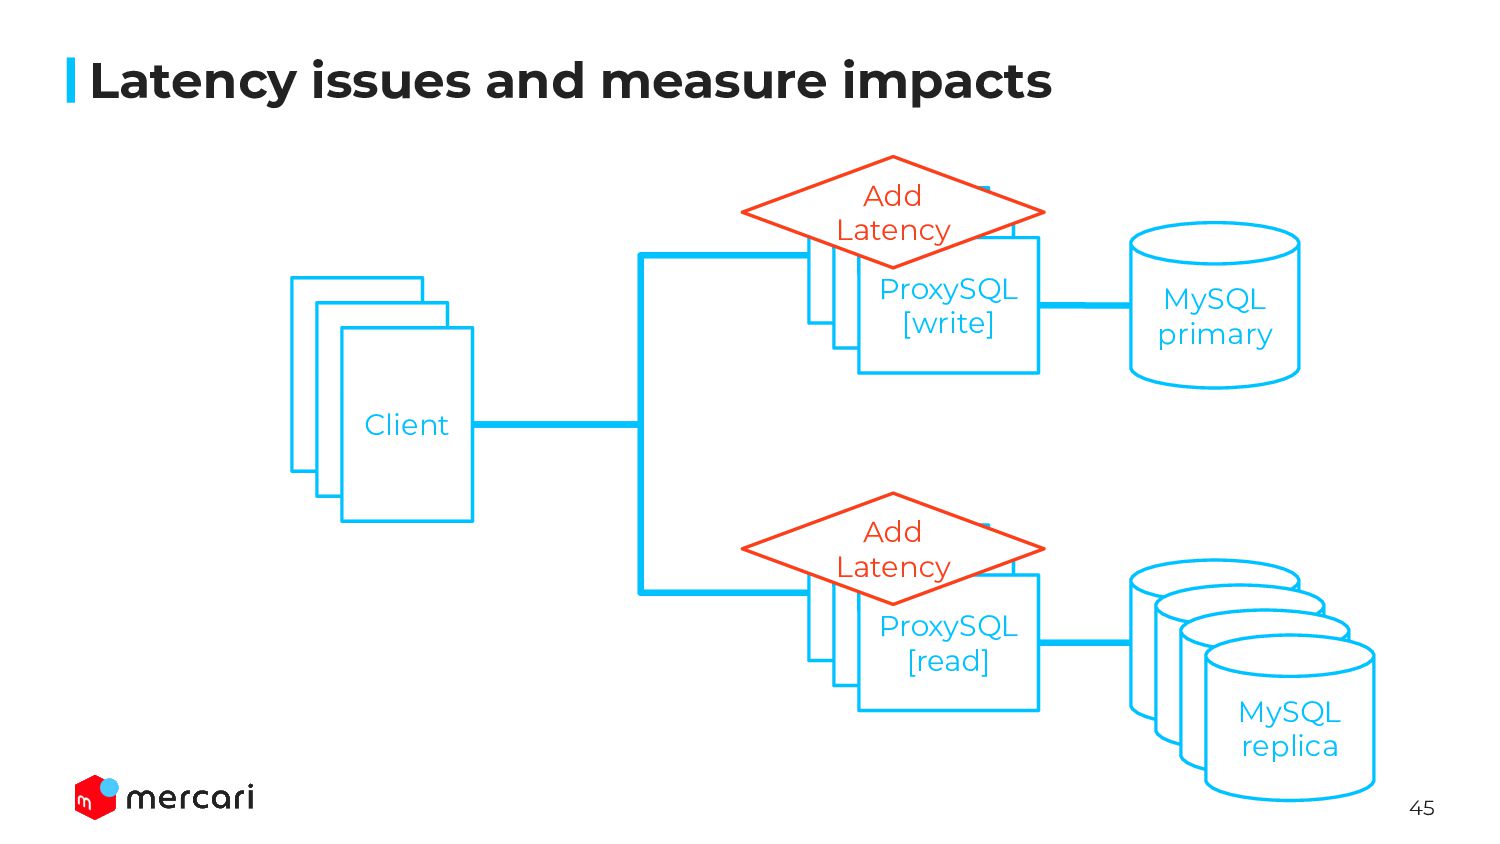
server and client on production directly ◦ A/B test couldn’t cover all of endpoints ▪ Some queries are executed from not API but batch or worker ◦ Because of many microservices ▪ modifying client code is impossible ▪ launching test environment is impossible as well • Since no one has answer how impact injecting latency, we should create an architecture for rollback ASAP • Considering those condition, we inserted ProxySQL in front of MySQL server Latency issues and measure impacts
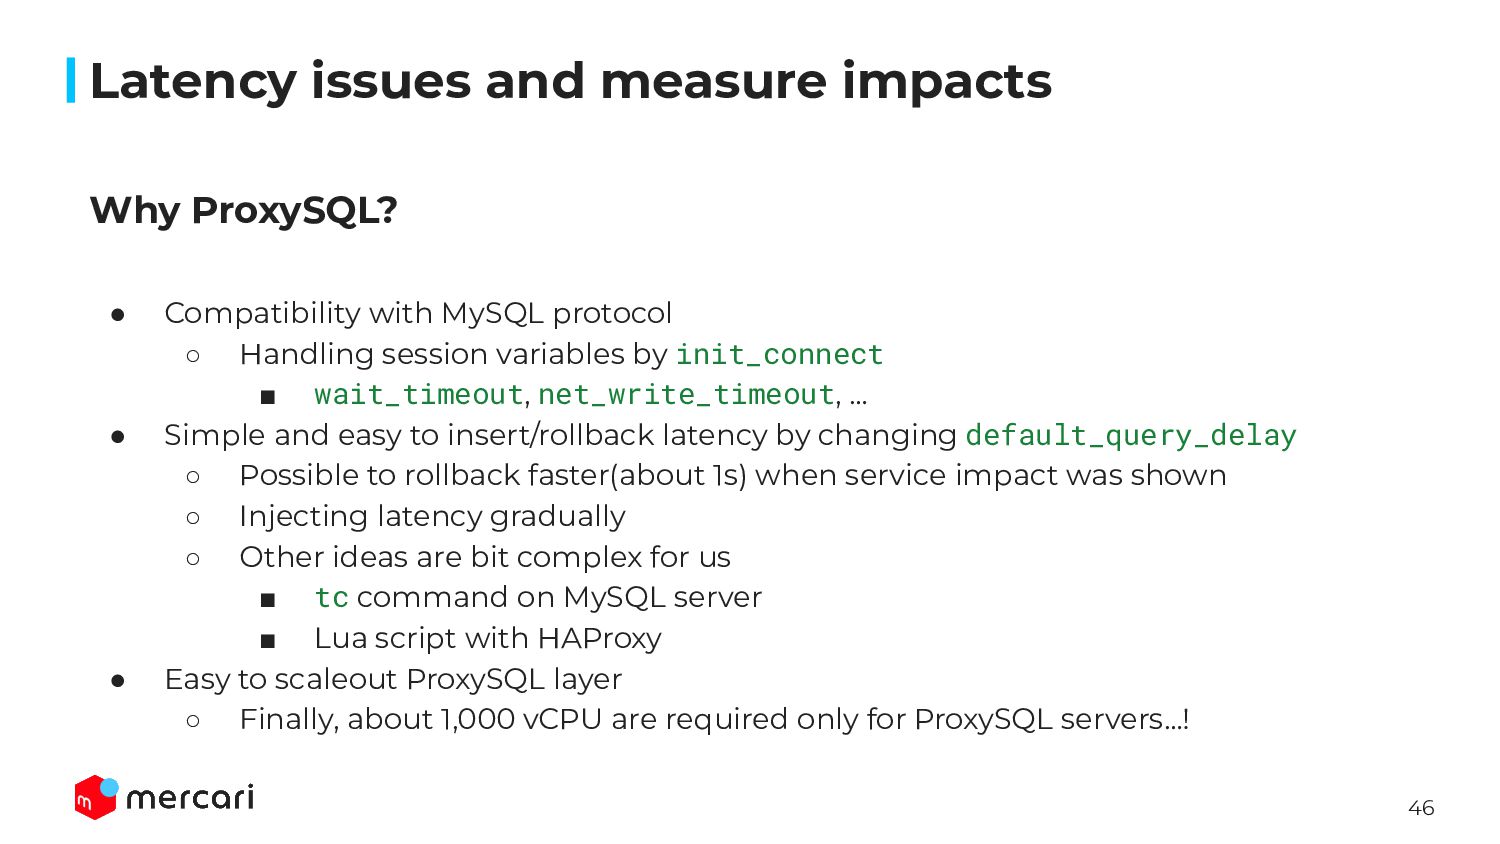
session variables by init_connect ▪ wait_timeout, net_write_timeout, … • Simple and easy to insert/rollback latency by changing default_query_delay ◦ Possible to rollback faster(about 1s) when service impact was shown ◦ Injecting latency gradually ◦ Other ideas are bit complex for us ▪ tc command on MySQL server ▪ Lua script with HAProxy • Easy to scaleout ProxySQL layer ◦ Finally, about 1,000 vCPU are required only for ProxySQL servers…! Latency issues and measure impacts
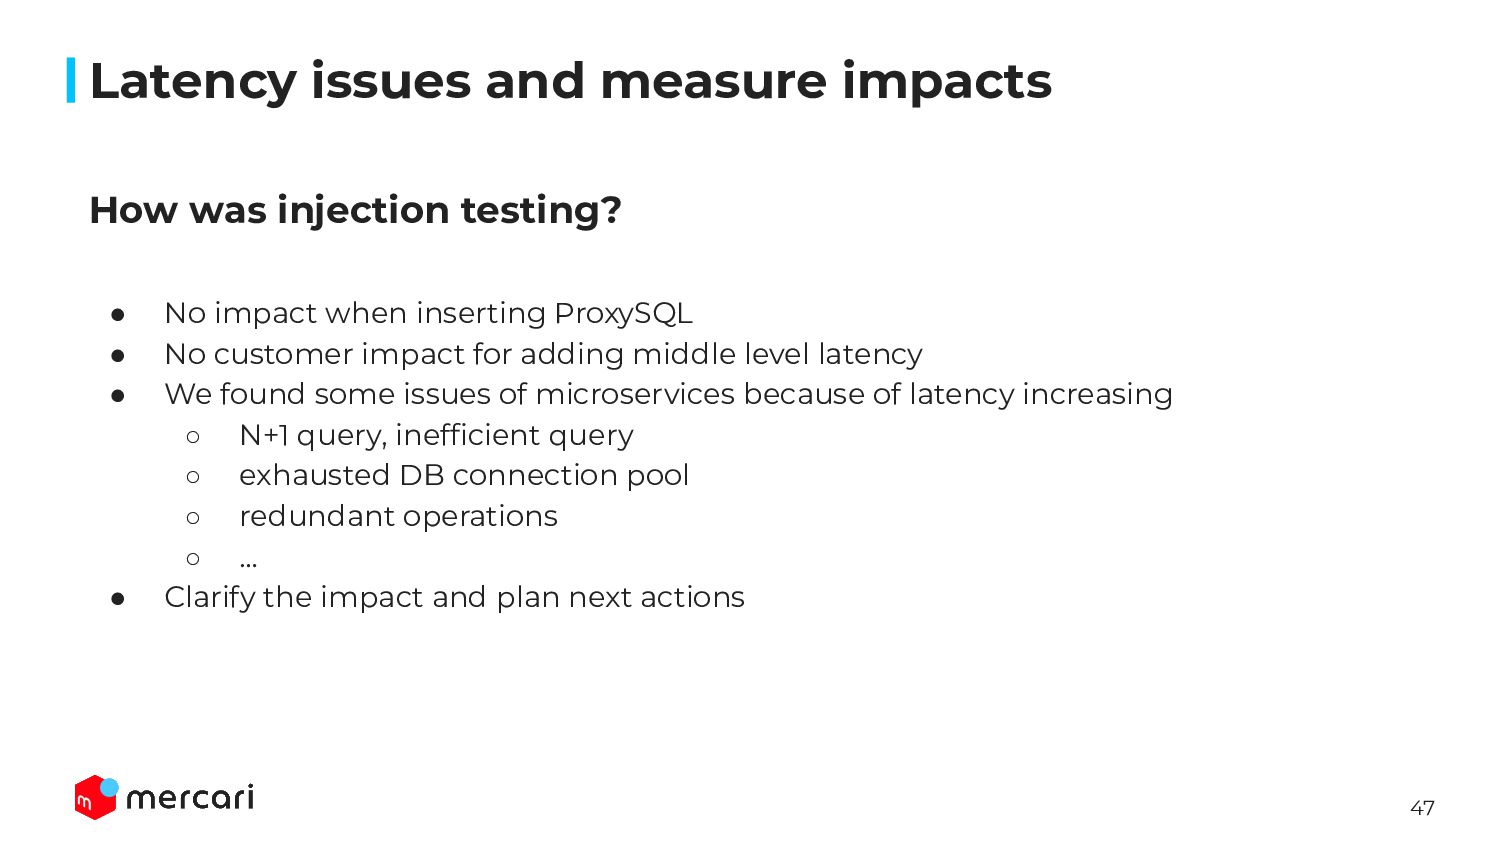
ProxySQL • No customer impact for adding middle level latency • We found some issues of microservices because of latency increasing ◦ N+1 query, inefficient query ◦ exhausted DB connection pool ◦ redundant operations ◦ … • Clarify the impact and plan next actions Latency issues and measure impacts