Upgrade to Pro — share decks privately, control downloads, hide ads and more …

Gene expression profiling workshop

Nick Haining
April 26, 2013
73

Gene expression profiling workshop

Imm306QC

Nick Haining

April 26, 2013
Tweet

Transcript

  1. Learning Objectives 1.  Mechanics of gene expression profiling 2.  Experimental

    design considerations 3.  Basic analysis of gene expression profiling data
  2. Overview 1.  Rationale 2.  Experimental design 3.  Analysis approaches 4. 

    Case examples 5.  Gene expression analysis workshop
  3. mRNA abundance correlates with protein abundance (sort of) Marguerat et

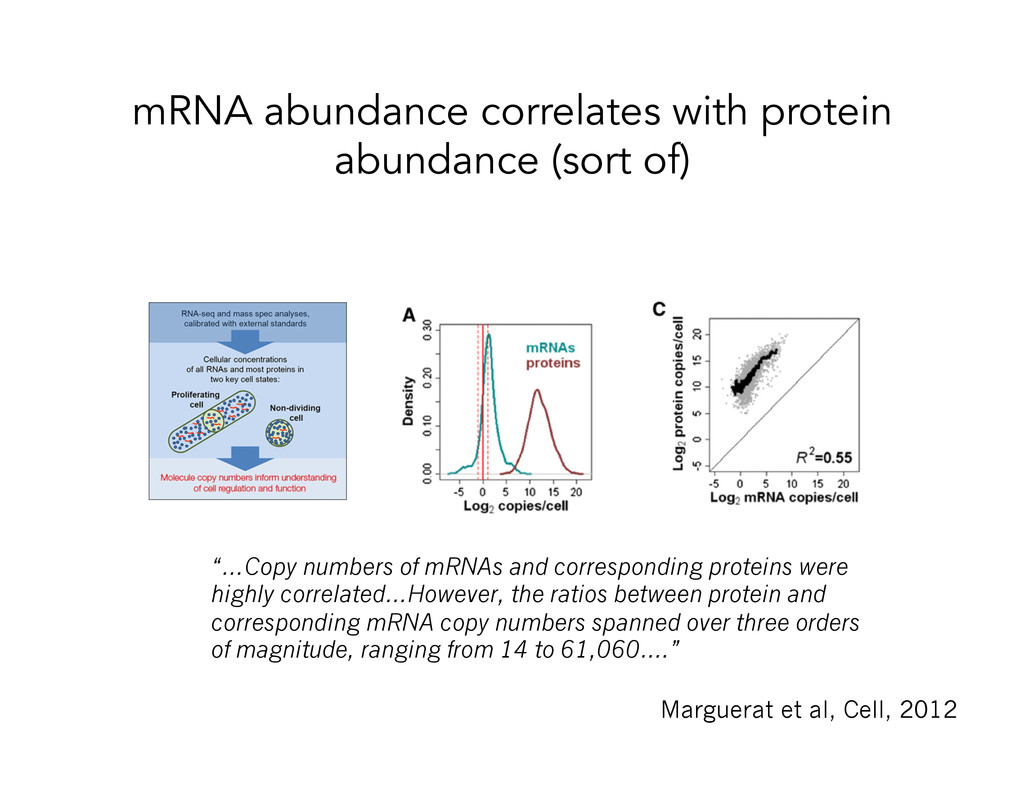
    al, Cell, 2012 “…Copy numbers of mRNAs and corresponding proteins were highly correlated…However, the ratios between protein and corresponding mRNA copy numbers spanned over three orders of magnitude, ranging from 14 to 61,060….”
  4. Parts list Kaech, Nat Immunol, 2003 IL7R in effector CD8

    T cell differentiation PD-1 in T cell exhaustion Barber, Nature, 2005 Quigley, Nat Med, 2010 BATF in T cell exhaustion
  5. Experimental Design •  What platform for gene measurement should I

    use? •  How many samples/replicates should I measure? •  How many cells will I need?
  6. Number of transcripts assayed Handful All annotated genes qRT-PCR Fluidigm

    Nanostring Affymetrix Illumina RNA-Seq ~10 ~800 96 47,000 All RNA species ?
  7. Transcripts on Affy/Illumina arrays 61% 23% 4% 5% 7% Coding

    transcript, well- established annotation Coding transcript, provisional annotation Non-coding transcript, well-estblished annotation Non-coding transcript, provisional annotation mRNA sequences that align to EST clusters
  8. Fluidigm •  Fast •  Reliable technology •  Sensitive •  High-throughput

    •  Max of 96 genes •  PCR bias? •  Fewer cores available •  Relatively expensive
  9. Nanostring •  No PCR amplification •  Fast •  Straightforward analysis

    •  Long lead-time for probe design •  Relatively expensive for larger panels •  Fewer cores available
  10. Affymetrix array •  Industry standard •  Loads of analysis tools

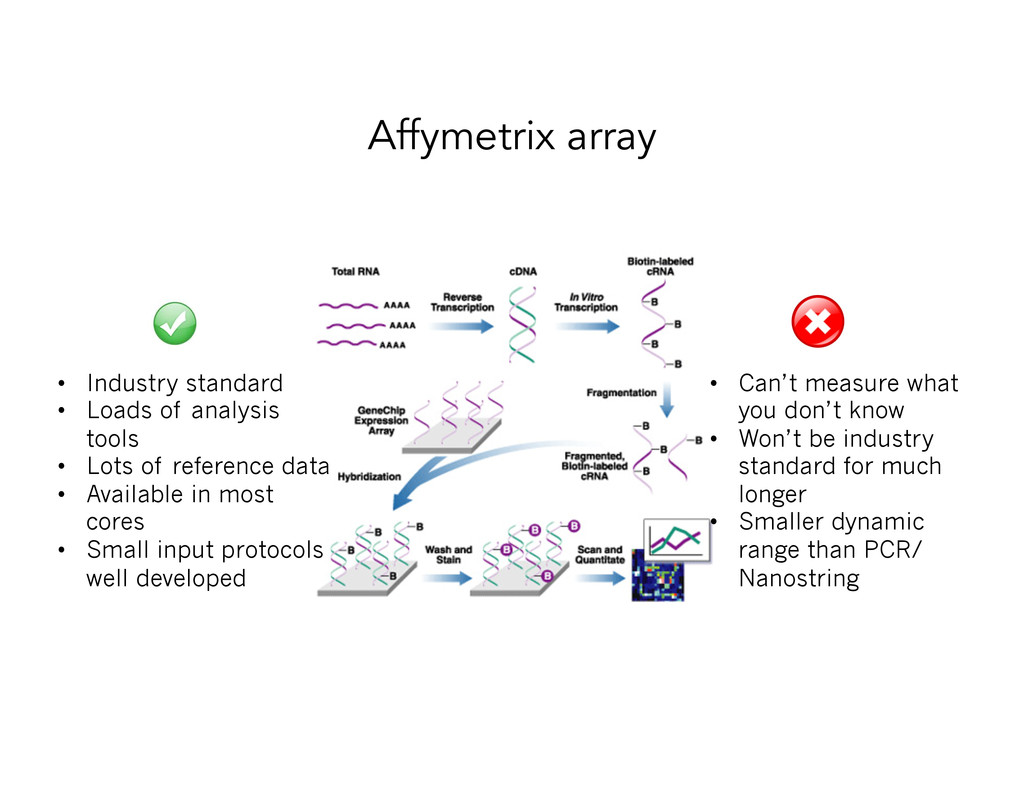
    •  Lots of reference data •  Available in most cores •  Small input protocols well developed •  Can’t measure what you don’t know •  Won’t be industry standard for much longer •  Smaller dynamic range than PCR/ Nanostring
  11. Illumina BeadArray •  Industry standard •  Cheaper than Affy • 

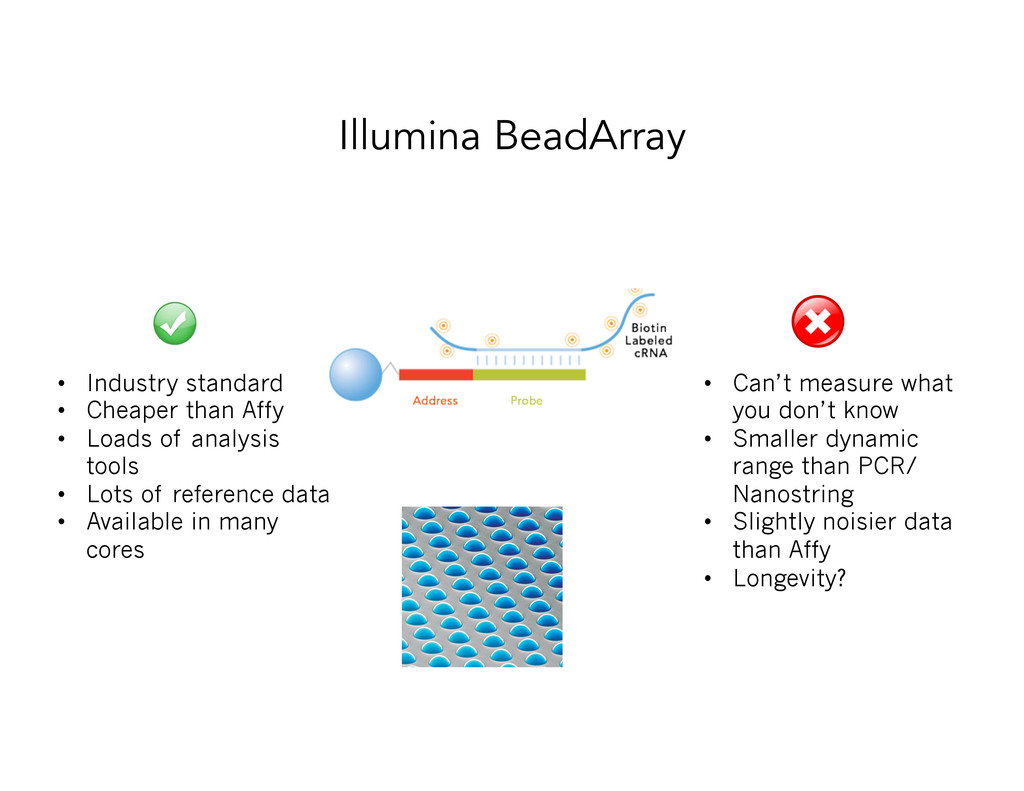
    Loads of analysis tools •  Lots of reference data •  Available in many cores •  Can’t measure what you don’t know •  Smaller dynamic range than PCR/ Nanostring •  Slightly noisier data than Affy •  Longevity?
  12. RNA-seq (digital gene expression) •  Can identify all transcripts • 

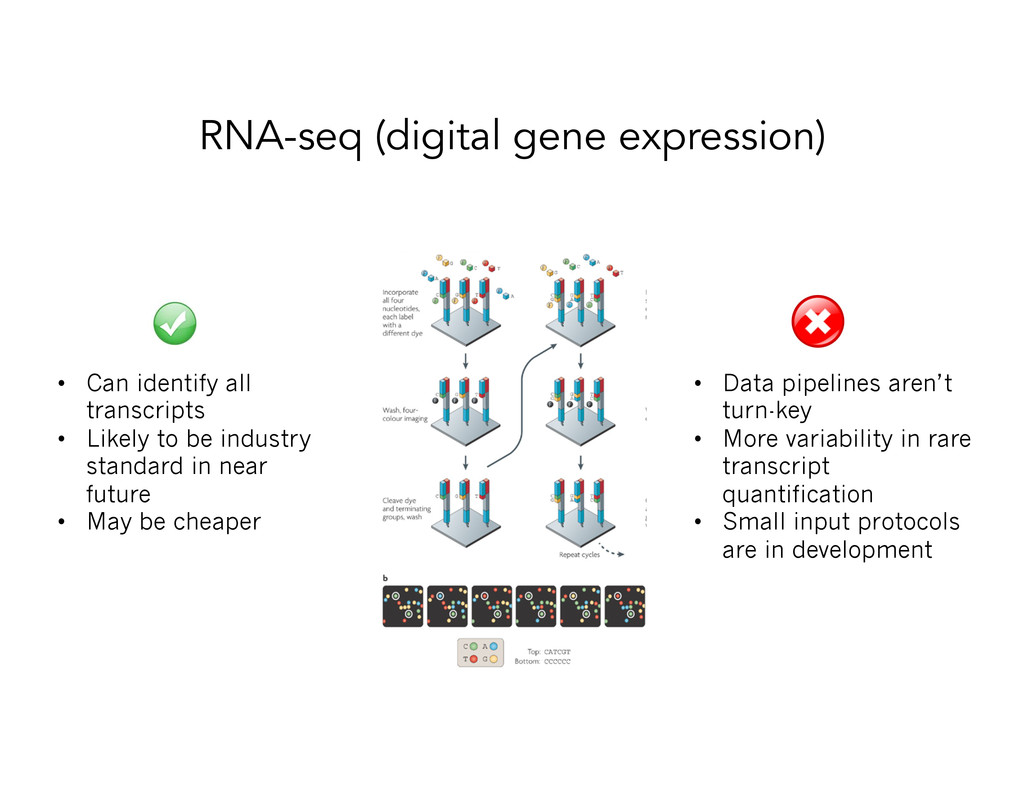
    Likely to be industry standard in near future •  May be cheaper •  Data pipelines aren’t turn-key •  More variability in rare transcript quantification •  Small input protocols are in development
  13. Cost Genes   $  per  sample   $  per  gene

      Min.  cost   Fluidigm   96   22   0.22   2000  (96)   Nanostring   ~100   ~100   1   100  (1)   Affymetrix   20,000   500   0.025   500  (1)   Illumina   20,000   250   0.0125   250  (1)   RNA-­‐seq   20,000   200   0.01   2000  (~10)  
  14. Input RNA amount •  Fluidigm – 1pg •  Affy –

    1µg •  Illumina – 100ng •  RNA-seq (DGE) – 100ng
  15. Data normalization •  RMA (robust multichip averaging) •  makes each

    array comparable to the next •  won’t completely get rid of batch effect
  16. Collapse probesets (Affy, Illumina) •  Genes are represented by more

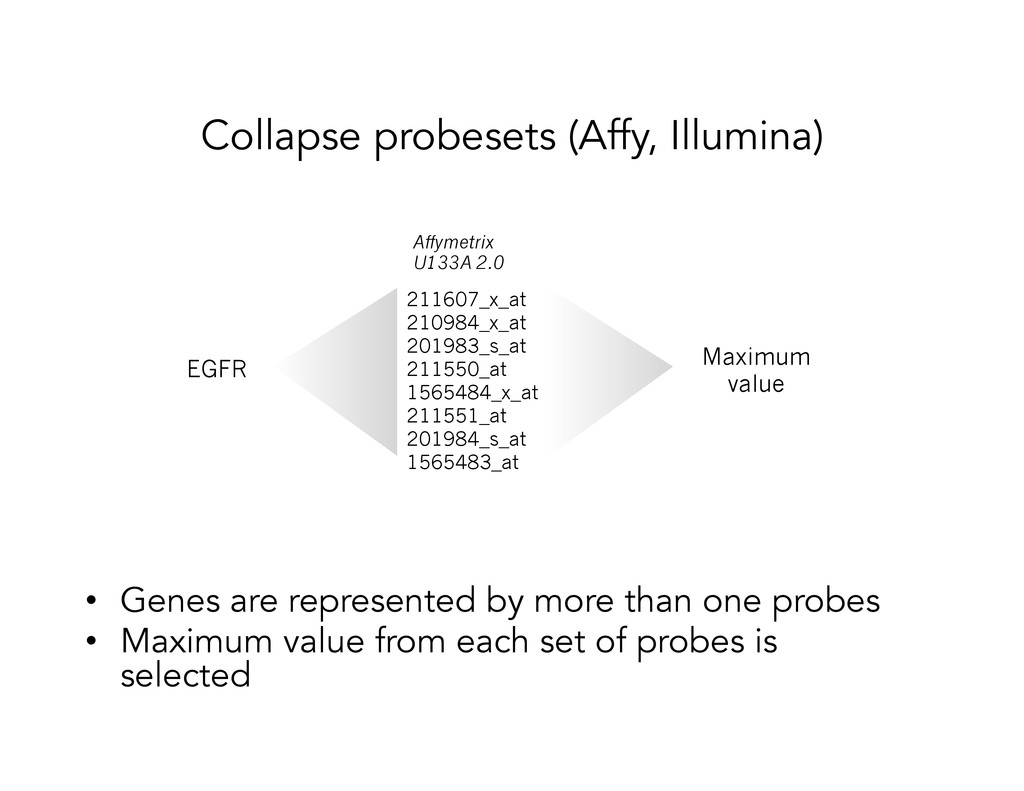
    than one probes •  Maximum value from each set of probes is selected 211607_x_at 210984_x_at 201983_s_at 211550_at 1565484_x_at 211551_at 201984_s_at 1565483_at EGFR Maximum value Affymetrix U133A 2.0
  17. Supervised analysis Differential expression •  Given phenotypically distinct classes, find

    “markers” that distinguish these classes from one another B Cells Monocytes mDC pDC
  18.        Problem            

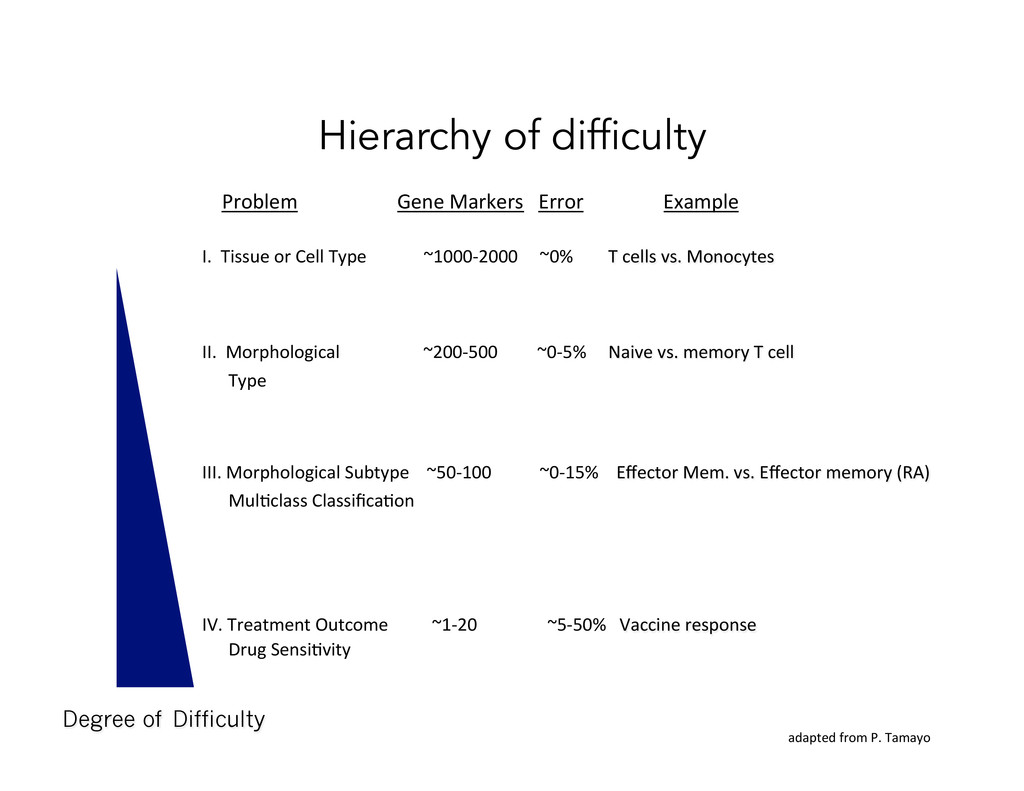
                               Gene  Markers      Error                                Example             I.    Tissue  or  Cell  Type                          ~1000-­‐2000          ~0%                T  cells  vs.  Monocytes                 II.    Morphological                                      ~200-­‐500                  ~0-­‐5%          Naive  vs.  memory  T  cell              Type   III.  Morphological  Subtype        ~50-­‐100                      ~0-­‐15%        Effector  Mem.  vs.  Effector  memory  (RA)              MulOclass  ClassificaOon   IV.  Treatment  Outcome                    ~1-­‐20                                ~5-­‐50%      Vaccine  response              Drug  SensiOvity     Degree of Difficulty adapted  from  P.  Tamayo   Hierarchy of difficulty
  19. Marker Selection Process Dataset   Phenotype/   class  labels  

    Measure  of     significance   Compute score: t-test, SNR, etc. Measure significance: permutation test Score   Ranked  gene  list  
  20. Ranking differential expression 0 2000 4000 6000 8000 10,000 12,000

    14,000 16,000 18,000 20,000 Samples Expression χ σ - Signal to noise ratio: ( + ) 0 2000 4000 6000 8000 10,000 12,000 14,000 16,000 18,000 20,000 Samples Expression 0 2000 4000 6000 8000 10,000 12,000 14,000 16,000 18,000 20,000 Samples Expression
  21. 7 4 1 9 9 4 6 7 1 9

    4 5 6 10 3 8 4 1 2 1 7 3 5 1 4 3 9 4 5 5 7 6 9 8 8 3 10 6 7 3 8 10 9 7 8 5 10 10 2 4 2 8 10 2 4 1 10 9 6 6 5 10 10 10 3 8 10 8 4 9 7 9 8 10 4 5 6 5 2 7 7 2 4 9 6 2 4 1 2 9 10 9 1 3 7 1 1 1 5 5 7 5 4 7 1 2 6 5 8 1 10 9 4 8 7 2 9 1 10 3 8 4 2 6 6 9 2 10 5 2 5 3 7 10 7 6 2 9 3 10 5 9 9 7 10 2 5 2 4 8 4 2 9 2 5 8 2 10 7 5 5 3 2 5 8 9 3 4 5 6 1 1 9 2 6 2 5 1 6 5 6 1 5 2 7 9 9 3 4 2 2 9 1 4 8 3 8 6 6 6 3 1 7 2 8 2 4 2 4 1 2 9 10 8 3 7 3 9 8 6 8 10 7 4 3 10 3 1 5 6 1 8 3 1 9 3 4 1 2 6 9 2 8 8 4 7 9 8 9 10 8 9 6 5 5 7 3 6 5 2 4 2 10 8 9 3 8 3 9 10 5 2 9 6 5 2 10 5 3 9 1 9 7 1 8 10 10 2 7 10 2 9 1 4 3 2 8 8 9 2 1 6 6 1 8 8 6 4 9 8 8 5 5 5 8 7 4 10 4 9 5 1 1 5 5 2 1 7 2 4 9 10 1 4 10 9 7 7 7 5 Permutation test and P-value Class A Class B “True” classes Permutation 1 Permutation 2 Permutation n Aim: Determine the significance of gene’s statistical score Known class A samples Known class B samples Score Generates a “null distribution” of scores for this gene Compare with “real” score for this gene
  22. Multiple Testing Procedures •  False Discovery Rate (FDR) –  Percent

    of false positives among all genes called differentially expressed •  Multiple testing can only correct for false positives (type 1 error); need more samples to correctly identify false negatives (type 2 error)
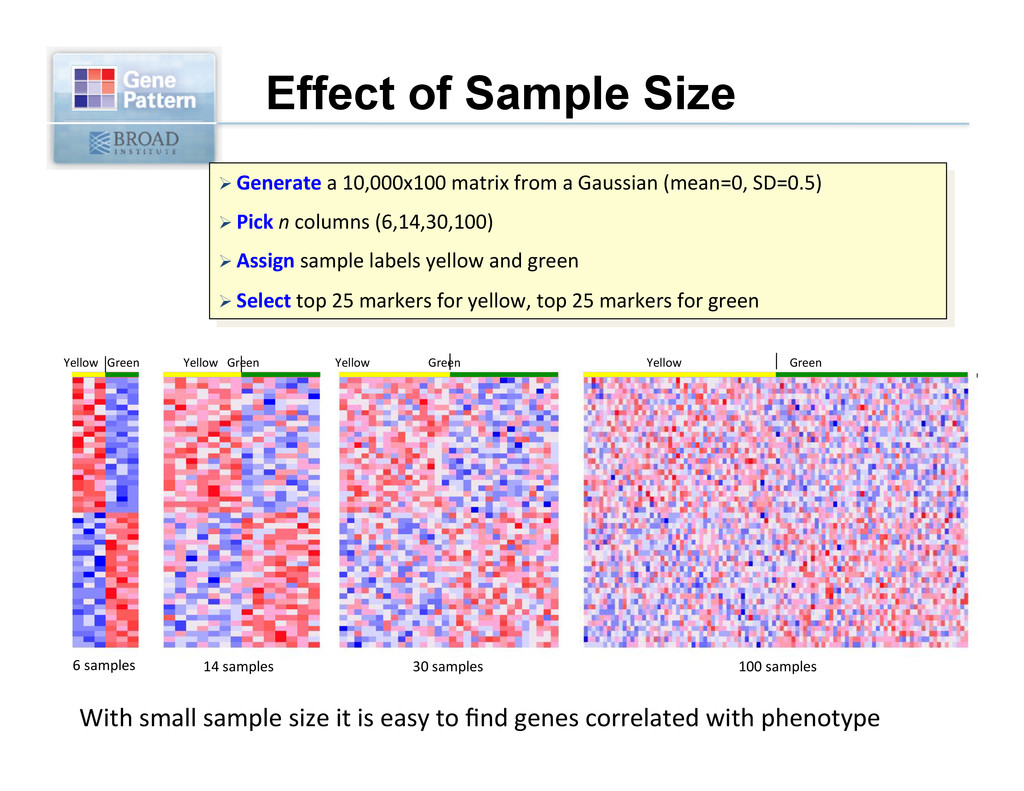
  23. Effect of Sample Size Ø Generate  a  10,000x100  matrix  from  a

     Gaussian  (mean=0,  SD=0.5)   Ø Pick  n  columns  (6,14,30,100)   Ø Assign  sample  labels  yellow  and  green   Ø Select  top  25  markers  for  yellow,  top  25  markers  for  green   With  small  sample  size  it  is  easy  to  find  genes  correlated  with  phenotype   Yellow      Green   6  samples    Yellow  Green   14  samples   Yellow        Green   30  samples   Yellow                                      Green   100  samples  
  24. Expression in YFV Effectors Expression in Naive CD8 T cells

    Gene set enrichment analysis Measuring signatures rather than genes
  25. Gene set enrichment analysis Enriched in Cell Type A Enriched

    in Cell Type B No Enrichment Subramanian et al. PNAS, 2005 Haining & Wherry. Immunity 2010
  26. Enriched Gene Set Un-enriched Gene Set Enrichment  Score  S Max.

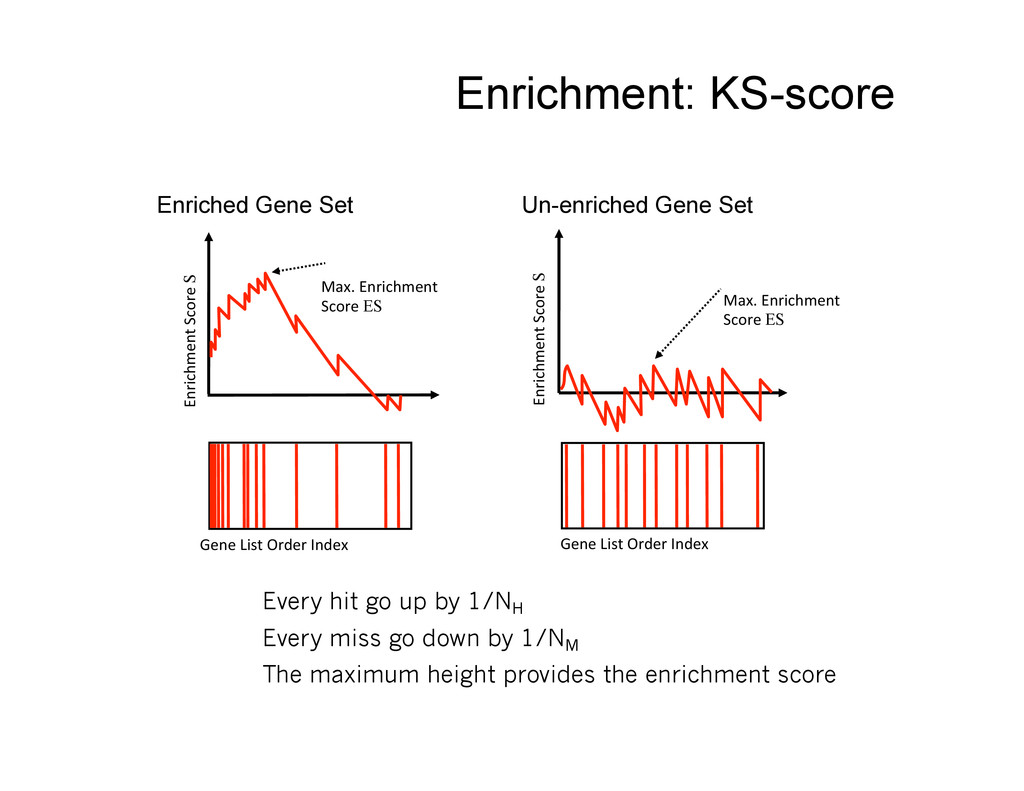
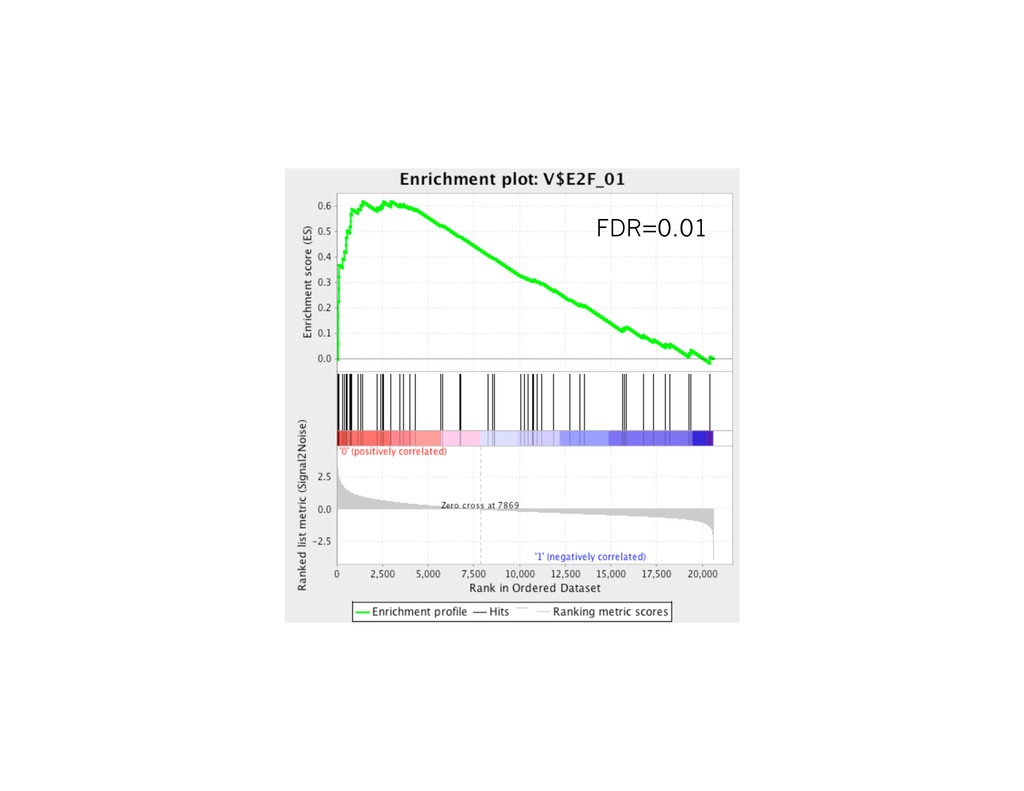
     Enrichment   Score  ES Gene  List  Order  Index   Enrichment  Score  S Max.  Enrichment   Score  ES Gene  List  Order  Index   Every hit go up by 1/NH Every miss go down by 1/NM The maximum height provides the enrichment score Enrichment: KS-score
  27. Signatures are portable Oncogenic KRAS CD8 CD4 B Cell S100A4

    CD58 C1ORF24 ANXA1 SMAD3 TOX CLIC1 ANXA2P2 GLIPR1 KLF6 FAS AIM2 WEE1 ATP2B4 GARNL4 ITGB1 PHACTR2 KLF10 LGALS3 CRIP1 CMRF-35H AHNAK IL2RB EPHA4 TNFRSF1B OPTN CASP1 CYB561 CD63 ADAM19 SLAMF1 C8ORF70 C11ORF17 NRIP1 PECAM1 CYORF14 PTK2 AIF1 SELL STMN1 SCML2 SERPINE2 KBTBD11 C5ORF13 SATB1 GAS2 ZNF516 TBXA2R BACH2 NBEA GAL3ST4 SCML1 PTPRK POP5 LOC282997 CCR7 S100A4 CD58 C1ORF24 ANXA1 SMAD3 TOX CLIC1 ANXA2P2 GLIPR1 KLF6 FAS AIM2 WEE1 ATP2B4 GARNL4 ITGB1 PHACTR2 KLF10 LGALS3 CRIP1 CMRF-35H AHNAK IL2RB EPHA4 TNFRSF1B OPTN CASP1 CYB561 CD63 ADAM19 SLAMF1 C8ORF70 C11ORF17 NRIP1 PECAM1 CYORF14 PTK2 AIF1 SELL STMN1 SCML2 SERPINE2 KBTBD11 C5ORF13 SATB1 GAS2 ZNF516 TBXA2R BACH2 NBEA GAL3ST4 SCML1 PTPRK POP5 LOC282997 CCR7 Ras Signature #1 Ras Signature #2 Lung Tumors
  28. Hierarchical Clustering 3   1   4   2  

    5   5   2   4   1   3   Distance  between  joined  clusters   Dendrogram  
  29. Principal Components Analysis •  Reduces high dimensional data (like microarrays)

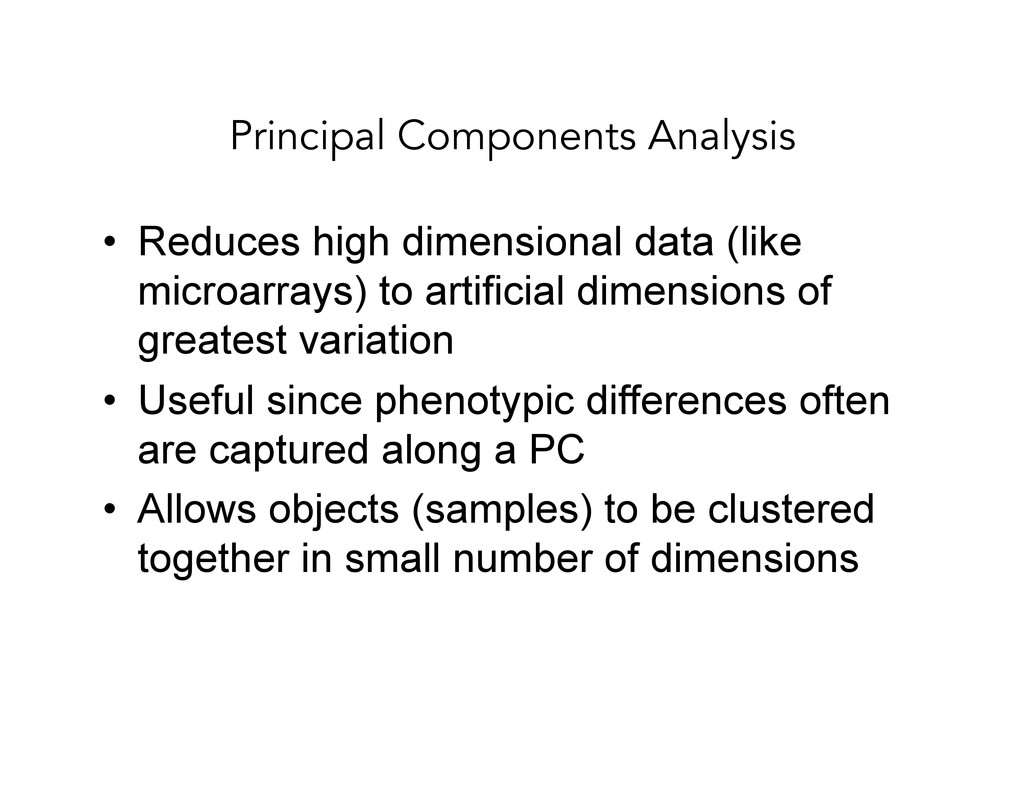
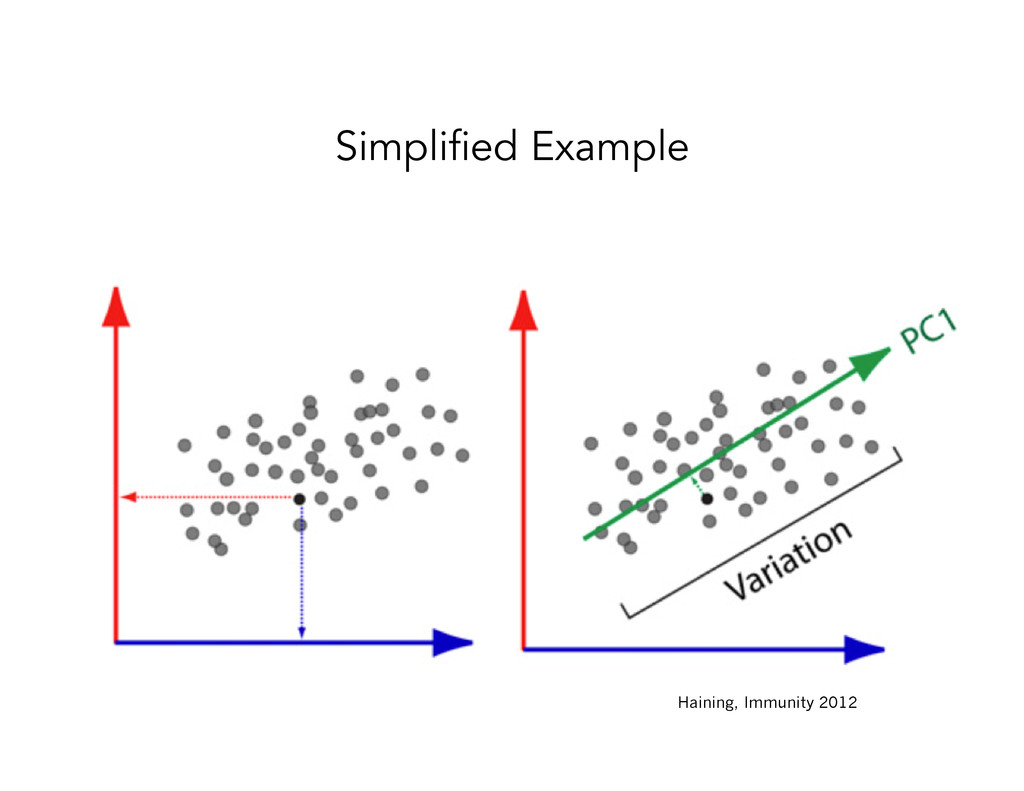
    to artificial dimensions of greatest variation •  Useful since phenotypic differences often are captured along a PC •  Allows objects (samples) to be clustered together in small number of dimensions
  30. Case example #1 You're doing a rotation in a lab

    and are staining a population of T cells from a well characterized mouse model for flow cytometry. You accidentally grab the wrong vial of antibody for your stains. When you flow the cells, you discover that a subset of your population of interest stains with this novel marker. Subsequent experiments confirm the finding and show that this novel subset has unique functional properties. You want to use gene expression profiling to characterize this novel subset of cells.
  31. Case example #2 You're studying the immune response to a

    new vaccine in samples from a clinical trial. A well-characterized cohort of human subjects is vaccinated with the same vaccine, but unexpectedly the antibody response to the vaccine varies enormously across the cohort. Your project is to identify novel correlates of the antibody response using gene expression profiling of PBMC samples.
  32. Case example #3 Your lab studies the differentiation of cell-type

    A into cell-type B. In a small-molecule screen, you have identified a compound that appears to induce the differentiation of cell-type A. The readout of the screen was upregulation of a cell-surface molecule characteristic of cell- type B. You now want to use gene expression profiling to determine whether the compound induces broader transcriptional changes associated with cell-type B.