Upgrade to Pro — share decks privately, control downloads, hide ads and more …

Debugging Zephyr: Choosing the Right Tool When ...

Avatar for Yasushi SHOJI Yasushi SHOJI
June 26, 2026
70

Debugging Zephyr: Choosing the Right Tool When Things Go Wrong

Avatar for Yasushi SHOJI

Yasushi SHOJI

June 26, 2026

Transcript

  1. Z e p h y r M e e t

    u p S a p p o r o 2 0 2 6 Zephyr の デバッグ技法 問題の種類とコストで、道具を選ぶ Debugging Zephyr: Choosing the Right Tool When Things Go Wrong Yasushi SHOJI 荘司 靖 / Space Cubics・Zephyr Ambassador nrf54l15dk/nrf54l15/cpuapp •
  2. choose by cost デバッグ手法にはコストがある 道具はどのコストを払うかで選ぶ。 手法 / 道具 払うコスト 既にある

    serial / RTT log を読む source change 不要 — まず読む printk を追加する source change + rebuild / reflash logging CONFIG_LOG + module / level / backend 設定 shell target は止めないが runtime が生きている必要 west debug source codeの変更は不要。target は halt する native_sim PC で再現できるが、実機 peripheral は見えない
  3. demo board nRF54L15 DK board target nrf54l15dk/nrf54l15/cpuapp オンボードデバッガ搭載 $ west

    flash $ west debug flash も debug 接続も、追加の probe なしで動く
  4. known-good baseline まず「戻れる地点」を作る 自分の app を疑う前に、いつでも健全な状態に戻って比較できる足場を用意する。 known-good sample samples/hello_world known-good

    firmware 動くと分かっている書き込み known-good commit 戻れる git の地点 別 board 個体差を切り分ける 別 cable / probe 接続を切り分ける 別 power supply 電源を切り分ける 補足: 再現した時期が分かれば、known-good commit と broken commit で git bisect できる(今日は深入りしない) 。
  5. tool map 症状とコストで見る tool map Build-time build log・Kconfig・DT・linker Flash /

    runner / probe runner・probe・cable・power Boot / early runtime boot sequence・init・banner Runtime observation logging・shell・thread analyzer Interactive debugging west debug・attach・GDB・ monitor Crash / post-mortem fatal・coredump・register dump Timing / tracing cycle counter・Zephelin・ ZView Simulation / test native_sim・QEMU・Twister
  6. build-time build log / Kconfig / Devicetree / linker 対象とする症状

    build できない undefined symbol Kconfig mismatch Devicetree error ROM / RAM overflow 見る道具 build log .config devicetree_generated.h linker map menuconfig guiconfig ここでは動く CPU はまだ無い。GDB の出番ではない。
  7. build-time DT Doctor / 静的コード解析(SCA) DT Doctor Devicetree 関連の難しい build

    error を読むための選択肢。 -DZEPHYR_SCA_VARIANT=dtdoctor SCA (静的コード解析) board に焼く前にバグを見つける。 clang analyzer GCC analyzer CodeChecker Coverity Sparse
  8. flash / runner / probe flash / runner / probe

    runner は Zephyr と target の間にいる層。flash・接続で詰まったらここを見る。 見るもの runner USB cable power board protection debug probe serial number nrfutil J-Link OpenOCD host $ west flash -H $ west debug -H — runner と対応オプションを確認
  9. runtime observation printk — 到達点と値を見る 既存ならコストは小さい。新規追加なら source change + rebuild

    / reflash。 到達点 この行まで来たか この分岐に入ったか func() device init 値 変数値 CPU register の値 MMIO register の値 memory dump / 特定アドレス main.c printk("alive\n"); printk("x=%d\n", x); printk("mmio=%08x\n", *(volatile uint32_t*)p); /* CPU register — GNU extension */ uint32_t sp; __asm__("mov %0, sp" : "=r"(sp)); printk("sp=%08x\n", sp);
  10. runtime observation logging — 制御できる出力 prj.conf / source CONFIG_LOG=y LOG_MODULE_REGISTER(app,

    LOG_LEVEL_DBG); LOG_INF / LOG_WRN / LOG_ERR 観測できる module・level 付きの構造化した出力 必要なもの CONFIG_LOG=y / module 登録 / backend 設定 cost ・副作用 mode により timing / stack に影響(次頁) 向く module ごとの可視性 / level filtering / 長時間観測 向かない logging subsystem が立つ前の超早期 / 厳密な timing 計測
  11. runtime observation logging mode の trade-off deferred (遅延処理) 呼び出し側は message

    を積み、 formatting / backend 出力は別 context。call site cost を下げや すい。 crash 直前の message が出る前 に落ちることがある。 immediate (同期処理) 呼び出し側でその場で処理。 crash 直前の情報を残しやす い。 stack usage / latency / timing へ の影響が大きくなりやすい。 minimal (最小構成) footprint を抑える簡易 mode。 機能は絞られる。 CONFIG_LOG_PRINTK printk を logging subsystem に redirect。 deferred では printk も遅延処理 される点に注意。
  12. runtime observation shell — まず built-in command uart console $

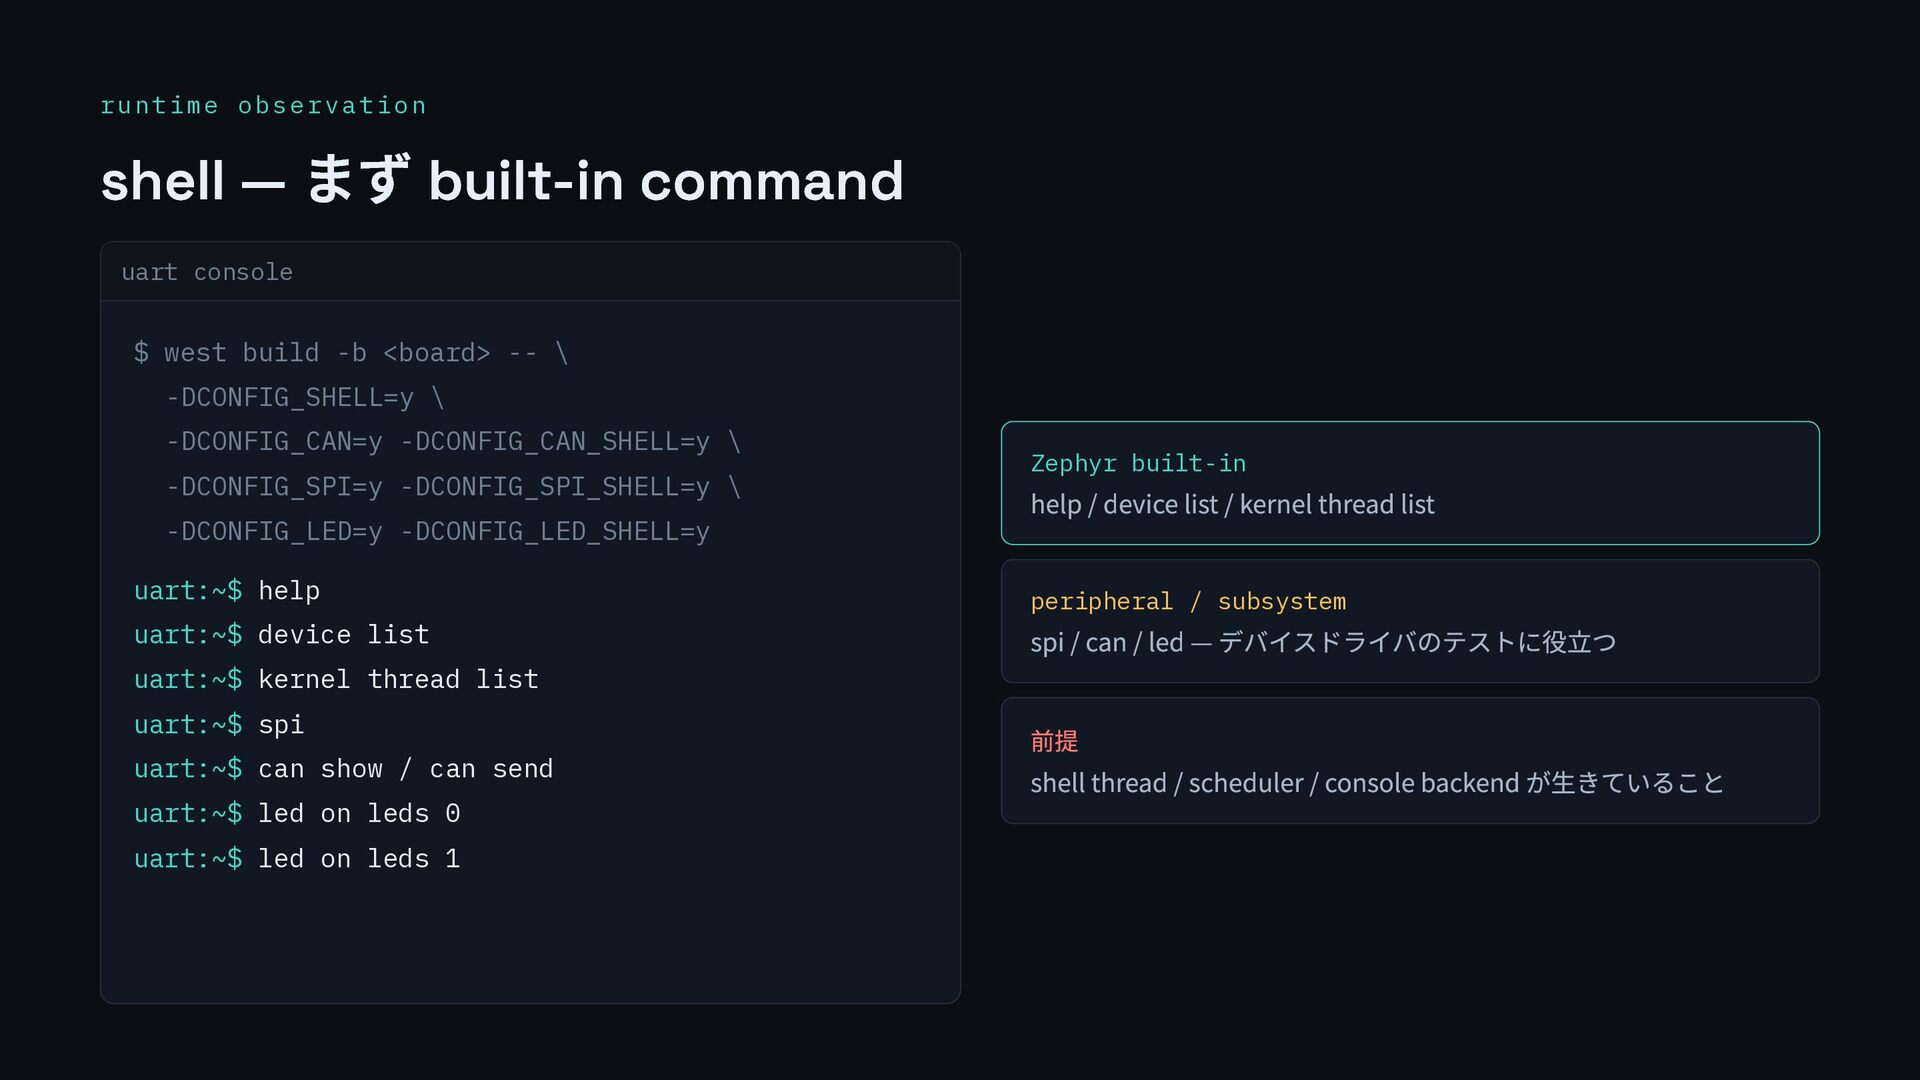
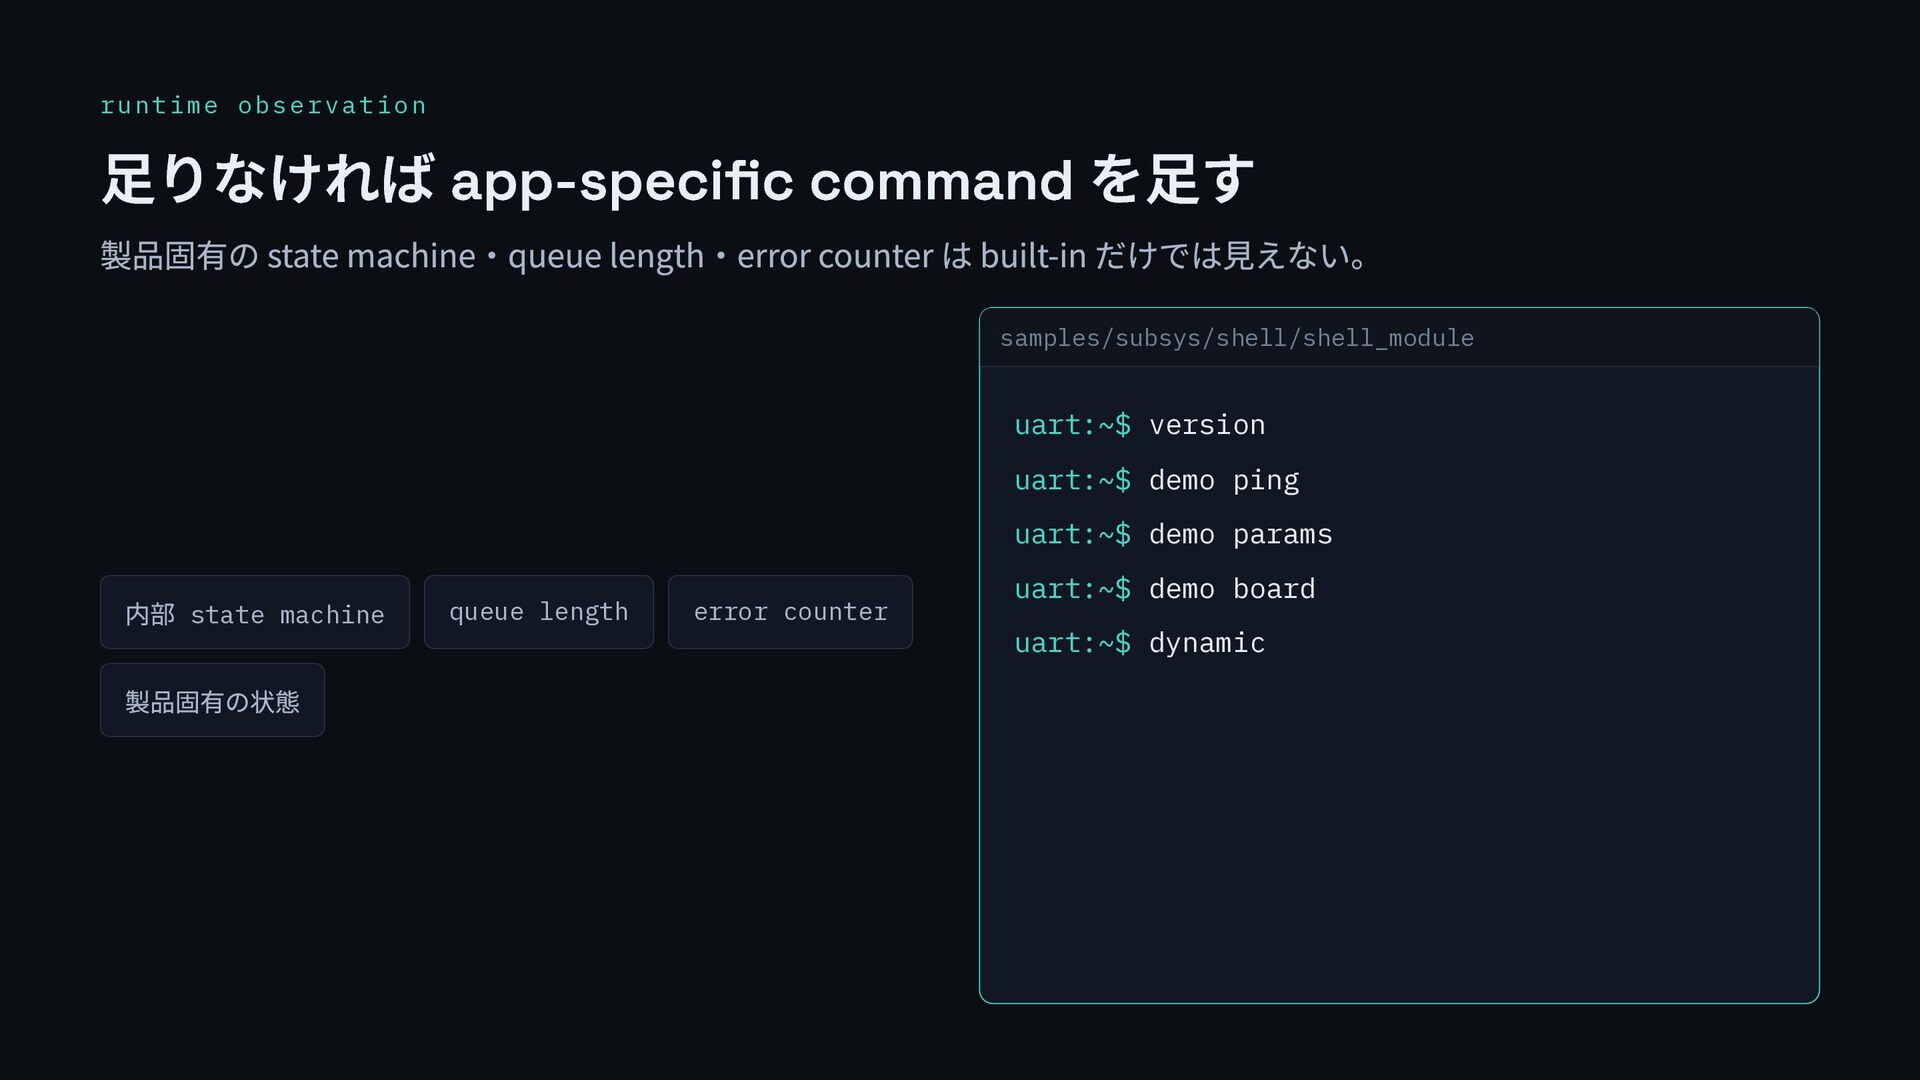
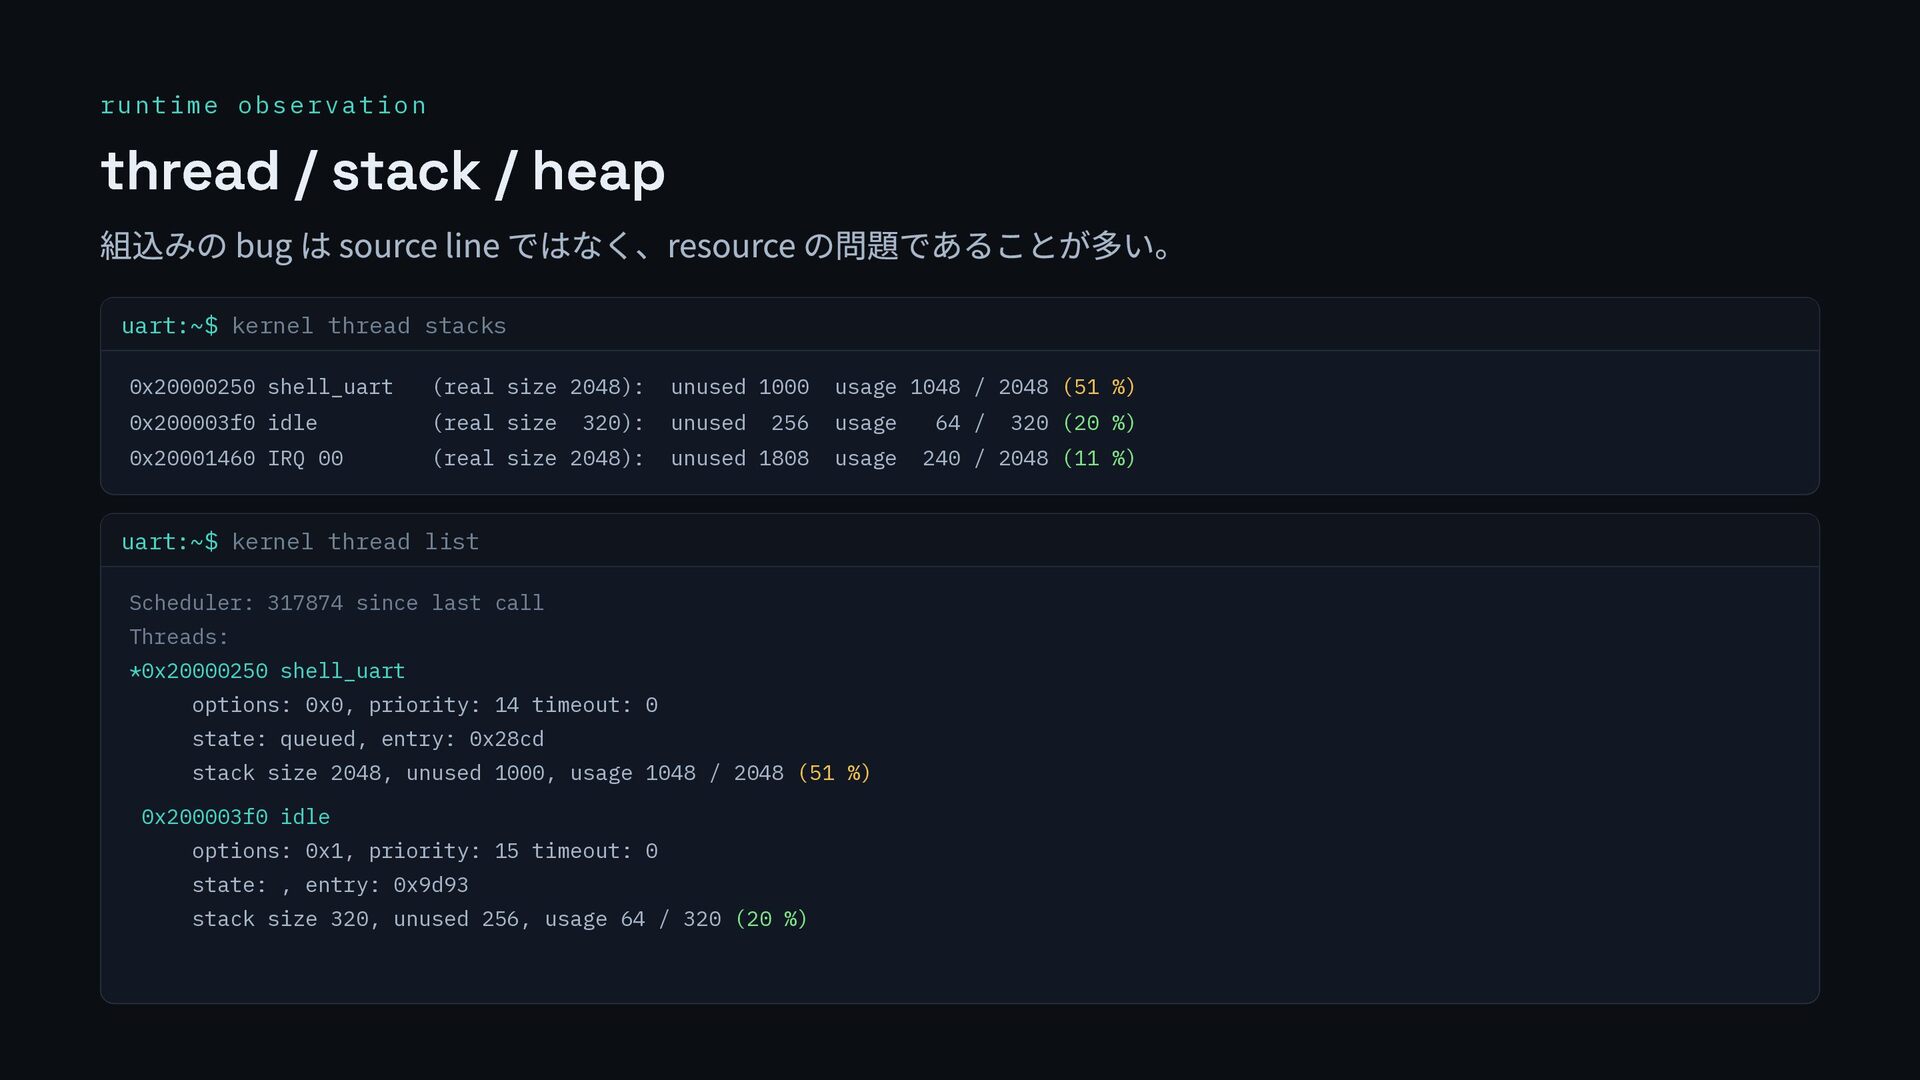
    west build -b <board> -- \ -DCONFIG_SHELL=y \ -DCONFIG_CAN=y -DCONFIG_CAN_SHELL=y \ -DCONFIG_SPI=y -DCONFIG_SPI_SHELL=y \ -DCONFIG_LED=y -DCONFIG_LED_SHELL=y uart:~$ help uart:~$ device list uart:~$ kernel thread list uart:~$ spi uart:~$ can show / can send uart:~$ led on leds 0 uart:~$ led on leds 1 Zephyr built-in help / device list / kernel thread list peripheral / subsystem spi / can / led — デバイスドライバのテストに役立つ 前提 shell thread / scheduler / console backend が生きていること
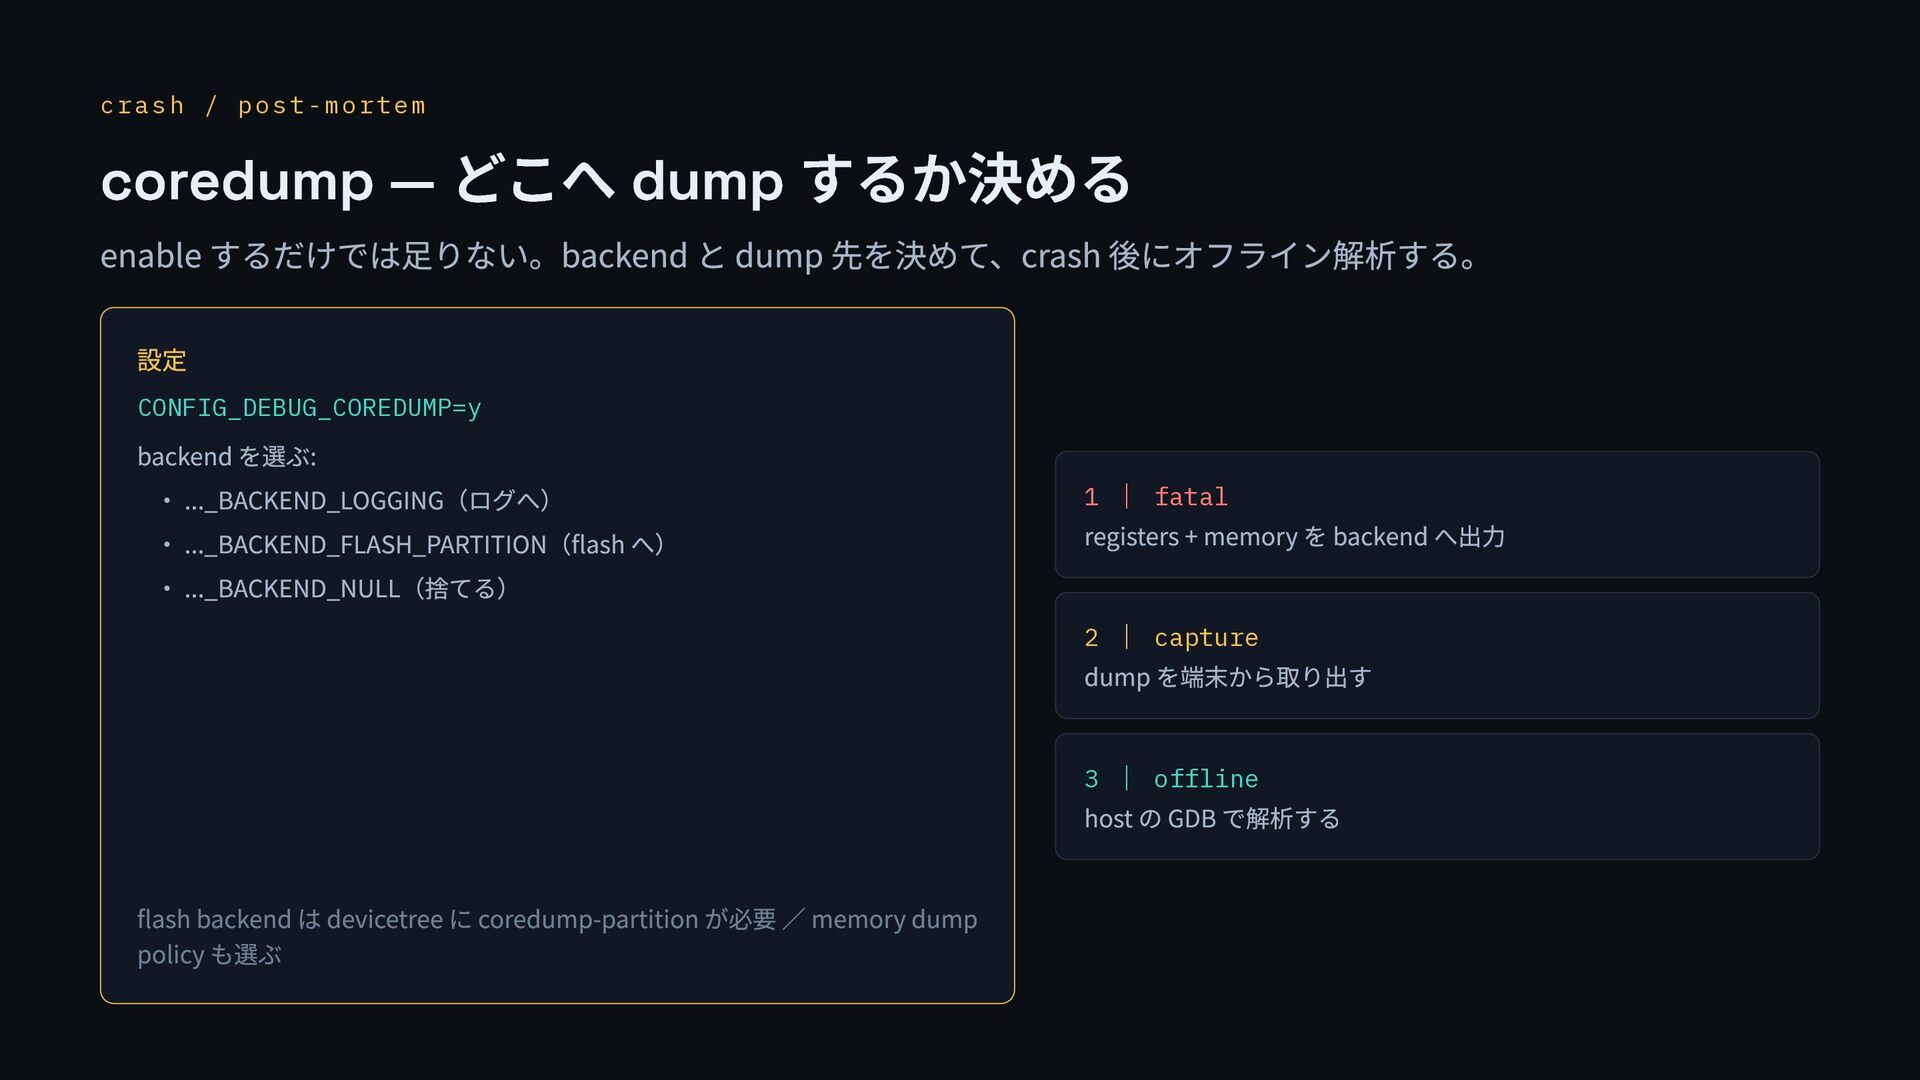
  13. runtime observation 足りなければ app-specific command を足す 製品固有の state machine・queue length・error

    counter は built-in だけでは見えない。 内部 state machine queue length error counter 製品固有の状態 samples/subsys/shell/shell_module uart:~$ version uart:~$ demo ping uart:~$ demo params uart:~$ demo board uart:~$ dynamic
  14. runtime observation thread / stack / heap 組込みの bug は

    source line ではなく、resource の問題であることが多い。 uart:~$ kernel thread stacks 0x20000250 shell_uart (real size 2048): unused 1000 usage 1048 / 2048 (51 %) 0x200003f0 idle (real size 320): unused 256 usage 64 / 320 (20 %) 0x20001460 IRQ 00 (real size 2048): unused 1808 usage 240 / 2048 (11 %) uart:~$ kernel thread list Scheduler: 317874 since last call Threads: *0x20000250 shell_uart options: 0x0, priority: 14 timeout: 0 state: queued, entry: 0x28cd stack size 2048, unused 1000, usage 1048 / 2048 (51 %) 0x200003f0 idle options: 0x1, priority: 15 timeout: 0 state: , entry: 0x9d93 stack size 320, unused 256, usage 64 / 320 (20 %)
  15. crash / post-mortem crash する FATAL ASSERTION FAIL [false] @

    worker.c:88 demo assert requested E: Current thread: worker E: r0: 0x0 pc: 0x000123ac E: >>> ZEPHYR FATAL ERROR 4 assert fatal output register dump backtrace coredump GDB 握りつぶさず、情報が残る形で落とす。
  16. crash / post-mortem coredump — どこへ dump するか決める enable するだけでは足りない。backend

    と dump 先を決めて、crash 後にオフライン解析する。 設定 CONFIG_DEBUG_COREDUMP=y backend を選ぶ: ・ ..._BACKEND_LOGGING(ログへ) ・ ..._BACKEND_FLASH_PARTITION(flash へ) ・ ..._BACKEND_NULL(捨てる) flash backend は devicetree に coredump-partition が必要 / memory dump policy も選ぶ 1 | fatal registers + memory を backend へ出力 2 | capture dump を端末から取り出す 3 | offline host の GDB で解析する
  17. interactive debugging west debug — GDB session を開く host —

    gdb $ west debug (gdb) break main (gdb) continue → bt (gdb) info locals / list 既定で rebuild する。debug.rebuild=false で抑制。 観測できる CPU state・registers・memory・call stack 必要なもの debug probe 接続。source change は不要な場合あり cost ・副作用 target halt。設定により rebuild 向く call stack / register / memory / breakpoint / step 向かない timing を変えたくない / halt で状態が変わる / build error
  18. interactive debugging GDB TUI / GUI frontend worker.c ─────────────── tui

    enable 87 LOG_WRN("assert armed"); ▶ 88 __ASSERT(false, "..."); 89 } (gdb) layout split / step GDB TUI terminal 内で source / asm / 現在行。実演に向く。 DDD / VS Code / Eclipse 紹介でよい。主役は GDB の考え方。仕組みを隠しすぎな い。
  19. interactive debugging west debugserver server を立てて待つだけ。IDE や別 terminal の GDB

    が接続する。 host $ west debugserver -- west debugserver: using runner jlink J-Link GDB server running on port 2331 GDB Server Listening port: 2331 # 別の場所で接続: $ gdb -ex "target remote :2331" (gdb) monitor reset west debug は GDB session まで開く west debugserver は server を立てて待つ 既定で rebuild。debugserver.rebuild=false で抑制 J-Link GDB server は port 2331 。接続後に monitor reset が要る (これが無いと GDB が正常に使えない)
  20. interactive debugging west attach — 動いている target に接続 debug と違い

    flash programming をしない。現在の binary の symbol を読み込んで接続する。 向く すでに再現している状態を見たい / reflash したくない / running target に繋ぎたい 注意 「必ず乱さず観測できる」ではない。 runner / probe / target state に依存し、 halt や副作用はあり得る debug との違い debug は焼いて起動し直す。attach は焼か ずに今の状態へ接続する
  21. interactive debugging monitor command — debug server に直接話す GDB は

    source / symbol / stack を見る。reset / halt / probe / low-level は debug server の command。 (gdb) (gdb) monitor reset (gdb) monitor halt (gdb) monitor regs — CPU register 一覧 (gdb) monitor MemU32 0x40000000 (gdb) monitor go GDB monitor → debug server J-Link (今回)/ OpenOCD 使える command は debug server 依存。monitor だけで J-Link の一 覧が出る。 Zephyr の機能ではない。GDB remote target / debug server の機能。
  22. choose by symptom hang する — 何が生きているかで選ぶ 状態 次に見るもの shell

    は生きている shell / kernel thread list / device list / app status logging は出続ける last log / timestamp / log level heartbeat LED は動く main loop / worker / timer のどれが生きているか interrupt は動く ISR storm / interrupt mask / priority / peripheral status 完全停止 debug attach / halt / backtrace / registers watchdog reset している reset reason / last log / coredump / watchdog config
  23. timing / tracing latency / timing — 止めるより測る 止めると再現しない問題は、動いたまま測る。ただし logging

    自体も timing を変える — 測定の副 作用を意識する。 cycle counter timing API timestamped log tracing ZView Zephelin
  24. timing / tracing tracing / ZView / Zephelin tracing event

    の timing を見る。logs では分からな い ordering / latency に強い。 sys_trace_named_event() で任意の event を埋め込める。 Percepio Tracealyzer ZView target を止めずに runtime 状態を見る host-side TUI。SWD probe 経由で kernel object を読み、stack watermark / thread ごとの CPU / heap を表示。UART も Shell も不要で on-target footprint はほぼゼロ。 west zview ZView — thread detail Zephelin Antmicro / ADI の open-source AI profiling library。CTF / TEF trace を Zephelin Trace Viewer で可視化。CPU / memory / thread に加え per-layer の推論統計も。 Zephelin Trace Viewer Common Trace Format (CTF) trace を tool 非依存の共通形式で記録。後から好きな viewer で開ける。 open source Eclipse Trace Compass Theia Trace Extension Zephelin Trace Viewer commercial Percepio View
  25. simulation / test host / CI に再現環境を作る 実機の置き換えではない。大規模開発・CI・Regression・再現性・Host tools を活用できる。

    native_sim Zephyr app を host Linux executable とし て動かす。PC 上で再現する。 host tool が直接使える: Valgrind / ASan ・ UBSan / gcov (coverage) 。 $ west build -b native_sim/native/64 \ zephyr/samples/hello_world QEMU emulated platform 上で動かす。GDB server / client で debug できる。 $ west build -b qemu_cortex_m3 \ zephyr/samples/hello_world Twister test runner。test app を scan し、複数 platform に build / run する。修正が他に 影響していないか確認でき、contributor は PR 前に実行が推奨(CI でも必須) 。 $ west twister \ -T zephyr/samples/subsys/shell \ -p nrf54l15dk/nrf54l15/cpuapp -v
  26. simulation / test それぞれの pros / cons native_sim + PC

    上で再現できる + host GDB / valgrind が使える + deterministic で再現しやすい - 実機 peripheral / timing は見えない - 必要な model は自作 QEMU + emulated platform で動かせる + GDB server / client で debug + CI / regression に載せやすい - 無い device は見えない(model 自作) - 実機の完全な代替でない・timing 近似 Twister + native_sim / QEMU / 実機に対応 + regression / CI の基盤 + pytest 連携で再発防止へ - その場の interactive debug ではない - test 化して初めて効く
  27. simulation / test SILS と HILS は役割が違う SILS (software-in-the-loop )

    + PC / 手元 / CI(AWS・GitHub Actions)で再現 + 並列で数を稼ぎ、failure を保存・regression 化 + 実時間より速い場合あり(重ければ遅い場合も) - hardware timing は近似・peripheral は model 依存 - electrical / power / reset は見えない HILS (hardware-in-the-loop ) + 本物の hardware timing を含めて確認 + 実時間制約まで含む・最終確認に必要 + peripheral / wiring / power / clock を確認 - 基本的に実時間でしか進まない・台数を増やしにくい - distributed system では環境構築が重い 結論: SILS で数を稼ぎ、HILS で実機性を確認する — 優劣ではなく、debugging と verification の階層。
  28. boot / early runtime Board porting — 電源を入れても何も出ない まず「どこまで来たか」を切り分ける。そして、何が問題なのかを探す。出ない=死んでいる とは限

    らない。 そもそも電源が入っていない クロック / PLL の設定間違い リセット解除忘れ ベースアドレスの間違い IRQ 番号の間違い CPU register の退避忘れ UART の pinmux / pinctrl 漏れ console (zephyr,console) 未設定 baudrate 不一致 memory map (RAM / FLASH) 間違い CPU が遅く、出力まで時間がかかる
  29. boot / early runtime どの init level で止まるか — SYS_INIT

    で checkpoint board / arch 移植で動かないとき、各 init level に checkpoint を置いて「どこまで来たか」を見る。 checkpoint.c static int chk_pre2(void) { printk("CHK: PRE_KERNEL_2\n"); return 0; } SYS_INIT(chk_pre2, PRE_KERNEL_2, 99); static int chk_post(void) { printk("CHK: POST_KERNEL\n"); return 0; } SYS_INIT(chk_post, POST_KERNEL, 99); static int chk_app(void) { printk("CHK: APPLICATION\n"); return 0; } SYS_INIT(chk_app, APPLICATION, 99); console CHK: PRE_KERNEL_2 CHK: POST_KERNEL (APPLICATION が出ない) 最後に出た level の次で死んでいる → POST_KERNEL の後を疑う
  30. boot / early runtime (deep dive) init_fn の名前まで知りたいなら — CONFIG_SYMTAB

    checkpoint で level は分かる。各 init_fn() の名前まで知りたいときの引き出し。 CONFIG_SYMTAB=y #include <zephyr/debug/symtab.h> uint32_t off = 0; const char *name = symtab_find_symbol_name((uintptr_t)fn, &off); printk("init fn=%p <%s+0x%x>\n", fn, name, off); init loop を instrument すれば、次に呼ぶ callback 名をその場で出せる 注意 symbol table を ROM に持つので容量が増える。 production ではなく debug build 向け。 FLASH 実測: +6 KB (最小構成) +14 KB (shell / spi 追加時) — symbol が多いほど増える early boot では UART / console がまだ動かず printk が出ないことも。その場合は GPIO checkpoint や debugger halt と併用する。
  31. trade-off matrix (1/2 ) runtime で見る道具 ◯ 必要/ あり △ 条件次第 ×

    不要/ なし tool source change rebuild / reflash target halt live runtime timing best for 既存 serial/RTT log × × × ◯ 小 既にある出力を読む printk を追加 ◯ ◯ × ◯ 中 到達点 / 値 logging △ △ × ◯ 中 module 別の可視性 shell △ △ × ◯ 小 動作中に問いかける thread analyzer △ △ × ◯ 小 stack / CPU load tracing / Zephelin △ ◯ × ◯ 小 event の ordering / latency ZView △ △ × ◯ 小 止めずに runtime 状態
  32. trade-off matrix (2/2 ) target に接続する道具 / target なしで見る道具 ◯

    必要/ あり △ 条件次第 × 不要/ なし tool source change rebuild / reflash target halt live runtime timing best for west debug (GDB ) × △ ◯ ◯ 大 call stack / register / memory west debugserver × △ ◯ ◯ 大 IDE / 別 GDB から接続 west attach × × △ ◯ 中 再現中の状態に接続 monitor × × △ △ 中 reset / halt / probe 低レベル操作 coredump △ ◯ × × — crash 後の事後解析(要 CONFIG) native_sim × host — — 不正確 logic / CI(実機の代替でない) QEMU × host △ — 近似 platform 近似 / GDB server Twister × ◯ — — — regression / CI の基盤
  33. s u m m a r y 「すごいツール」ではなく 「今の問題に、少ない副作用で答えるツール」を選ぶ デバッグ手法にはコストがある

    ツールごとに pros / cons 払うコストが小さい順に選ぶ debug が終わったら、直した bug は test 化して CI に残し、再発を防ぐ。 Yasushi SHOJI 荘司 靖 / Space Cubics・Zephyr Ambassador Zephyr Meetup Sapporo 2026