Upgrade to Pro
— share decks privately, control downloads, hide ads and more …
Speaker Deck
Features
Speaker Deck
PRO
Sign in
Sign up for free
Search
Search
Building Interactive Data Visualization Systems...
Search
Zhe Wang
January 13, 2016
200
0
Share
Embed
Copy iframe code
Copy JS code
Copy link
Start on current slide
Building Interactive Data Visualization Systems: A Tool for Light Curve Exploration
Zhe Wang
January 13, 2016
Featured
See All Featured
The Straight Up "How To Draw Better" Workshop
denniskardys
239
140k
Navigating Algorithm Shifts & AI Overviews - #SMXNext
aleyda
1
1.3k
Building AI with AI
inesmontani
PRO
1
1.1k
Game over? The fight for quality and originality in the time of robots
wayneb77
1
220
Data-driven link building: lessons from a $708K investment (BrightonSEO talk)
szymonslowik
1
1.2k
JAMstack: Web Apps at Ludicrous Speed - All Things Open 2022
reverentgeek
1
490
GitHub's CSS Performance
jonrohan
1033
470k
30 Presentation Tips
portentint
PRO
1
340
Leveraging LLMs for student feedback in introductory data science courses - posit::conf(2025)
minecr
1
310
How to train your dragon (web standard)
notwaldorf
97
6.7k
Claude Code どこまでも/ Claude Code Everywhere
nwiizo
65
56k
Practical Orchestrator
shlominoach
191
11k
Transcript
Building Interactive Data Visualization Systems: A Tool for Light Curve
Exploration Zhe Wang PhD Student Department of Computer Science University of Arizona
Interactive Data Visualization • Make the visual representation of information
respond to human input • Human-Data Interaction
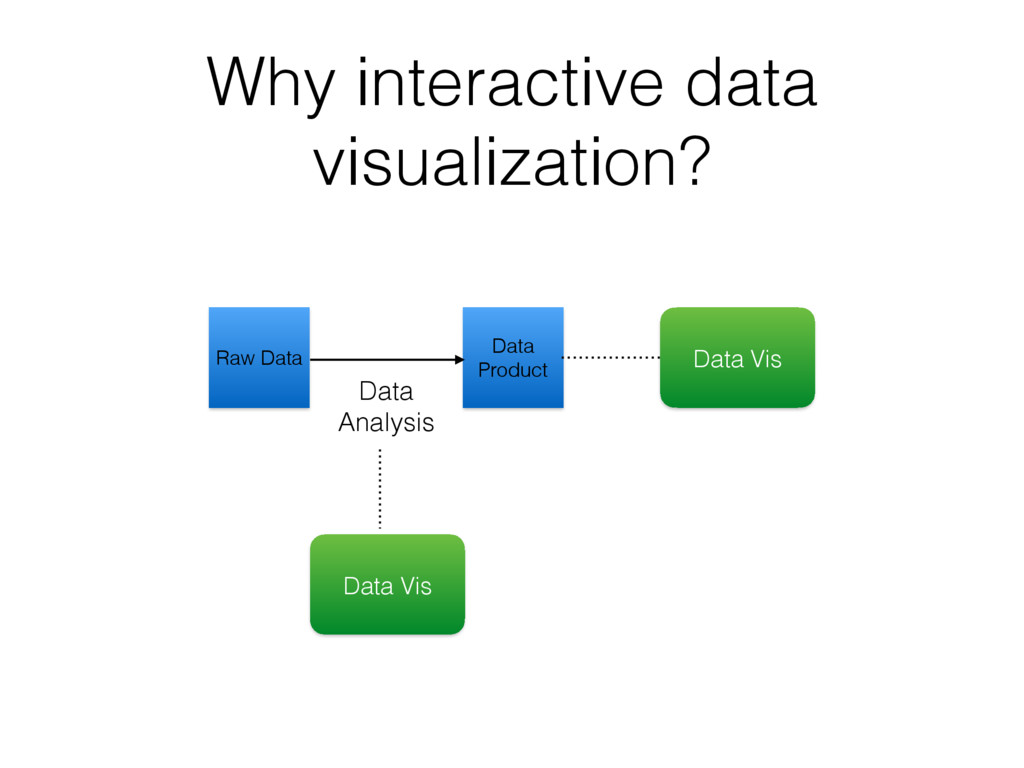
Why interactive data visualization? Raw Data Data Product Data Vis
Data Analysis Data Vis
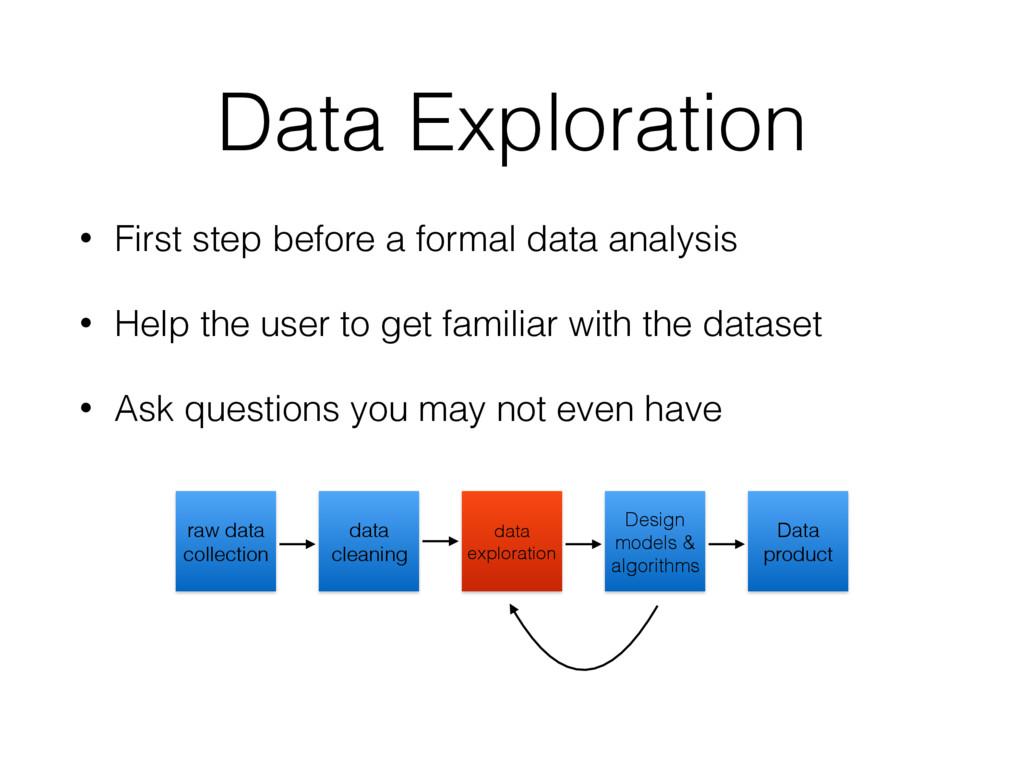
Data Exploration • First step before a formal data analysis
• Help the user to get familiar with the dataset • Ask questions you may not even have raw data collection data cleaning data exploration Design models & algorithms Data product
Ok, let’s build a vis app for light curves.
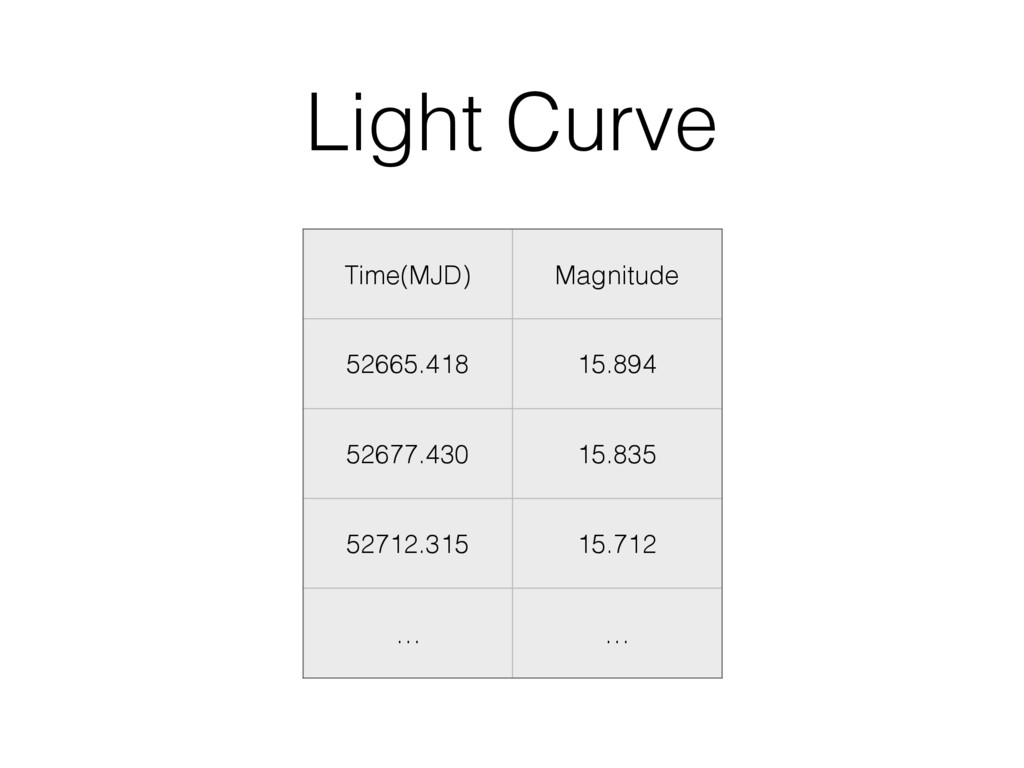
Light Curve Time(MJD) Magnitude 52665.418 15.894 52677.430 15.835 52712.315 15.712
… …
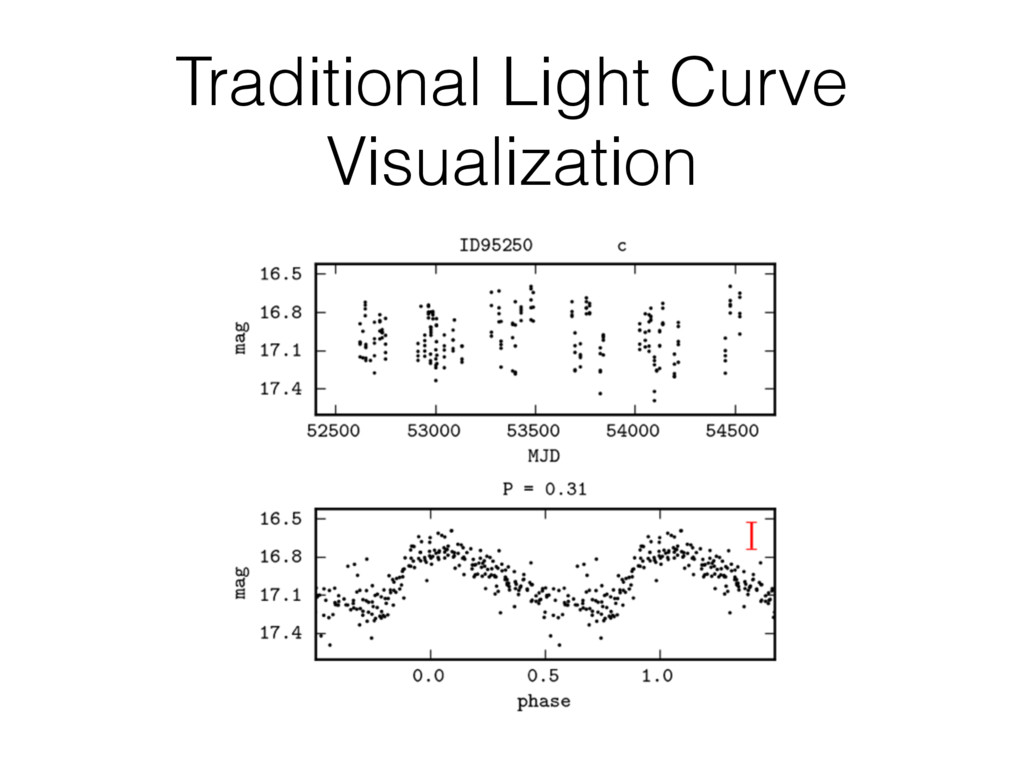
Traditional Light Curve Visualization
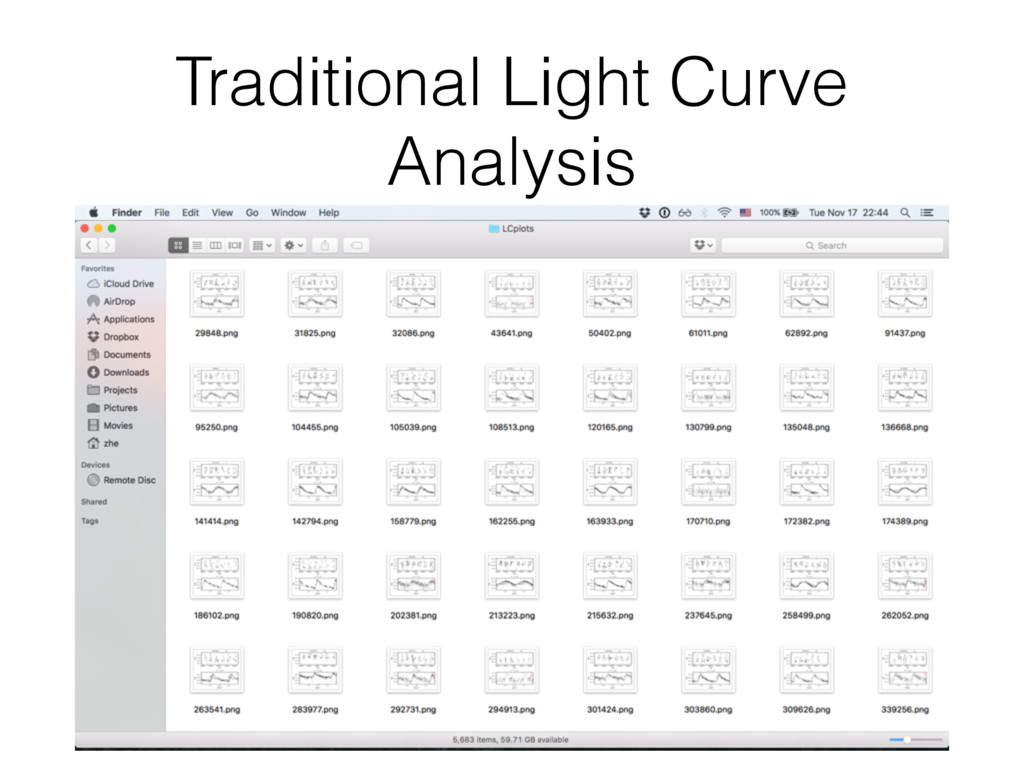
Traditional Light Curve Analysis
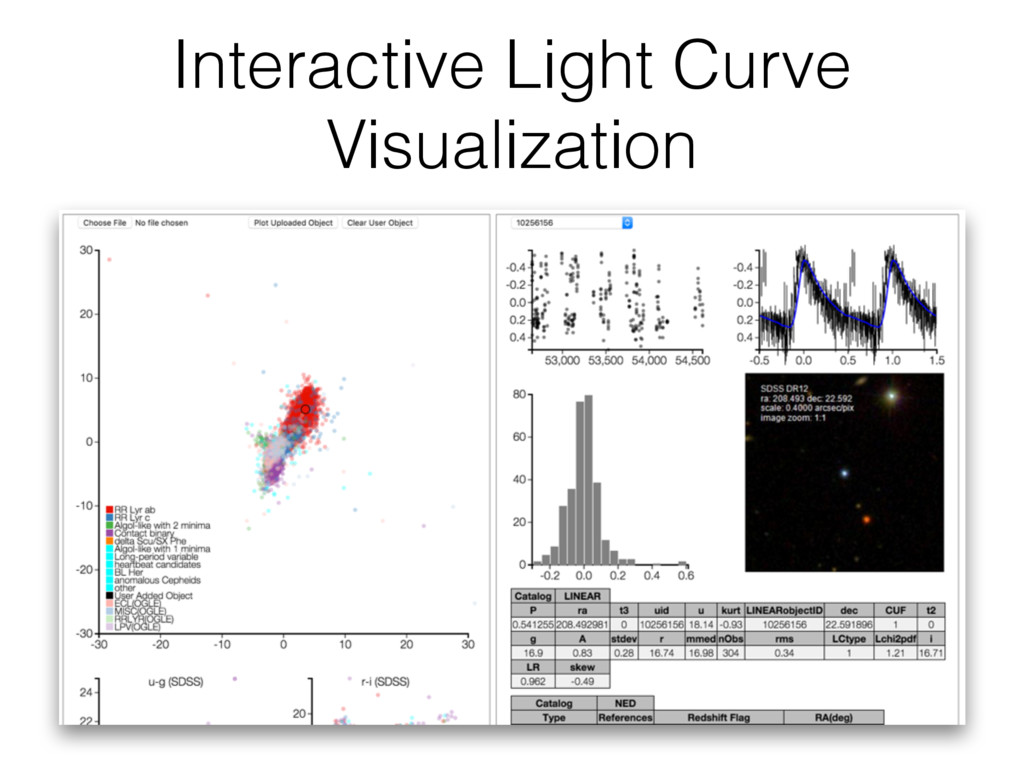
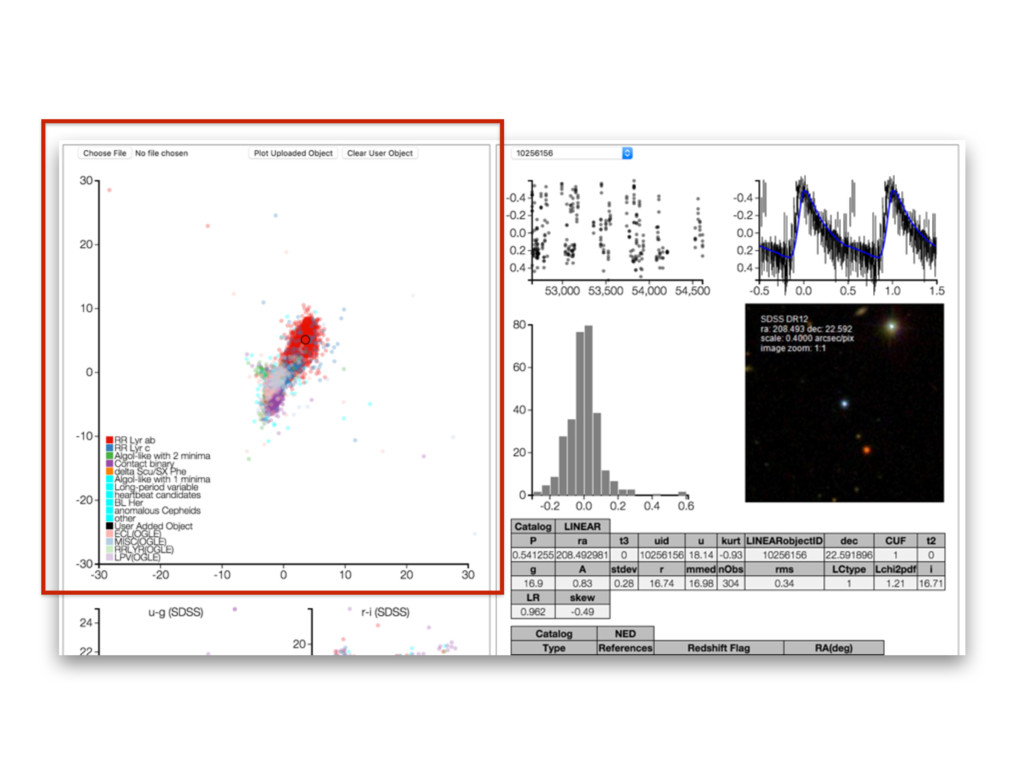
Interactive Light Curve Visualization
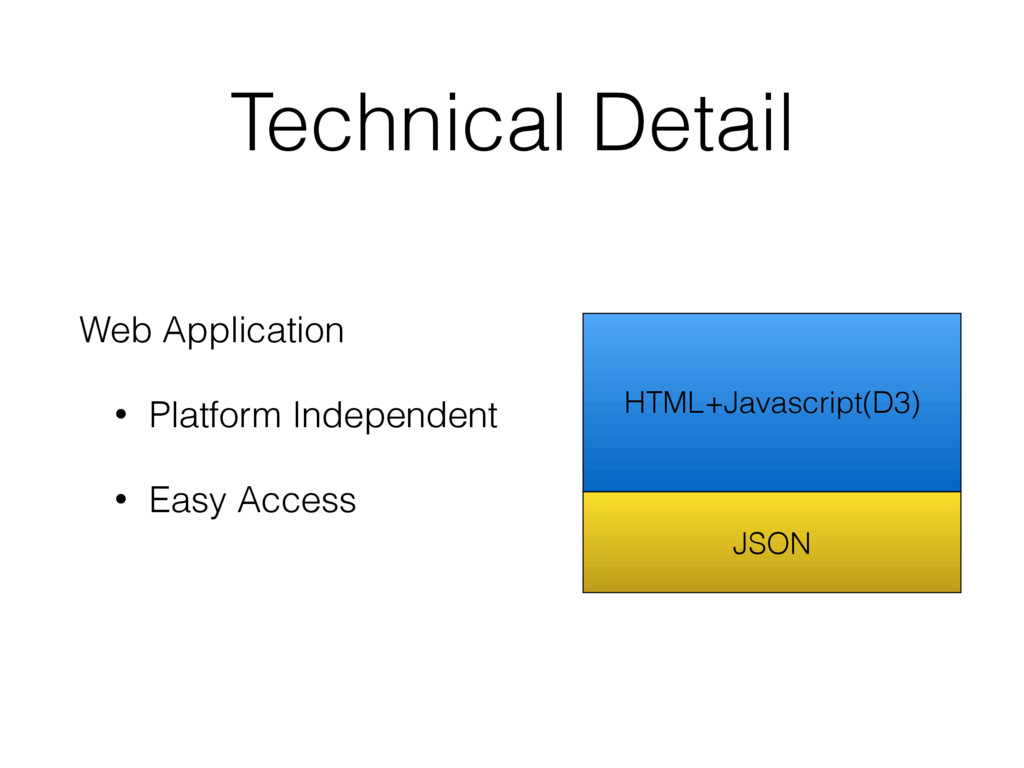
Technical Detail HTML+Javascript(D3) JSON Web Application • Platform Independent •
Easy Access
Next Step?
None
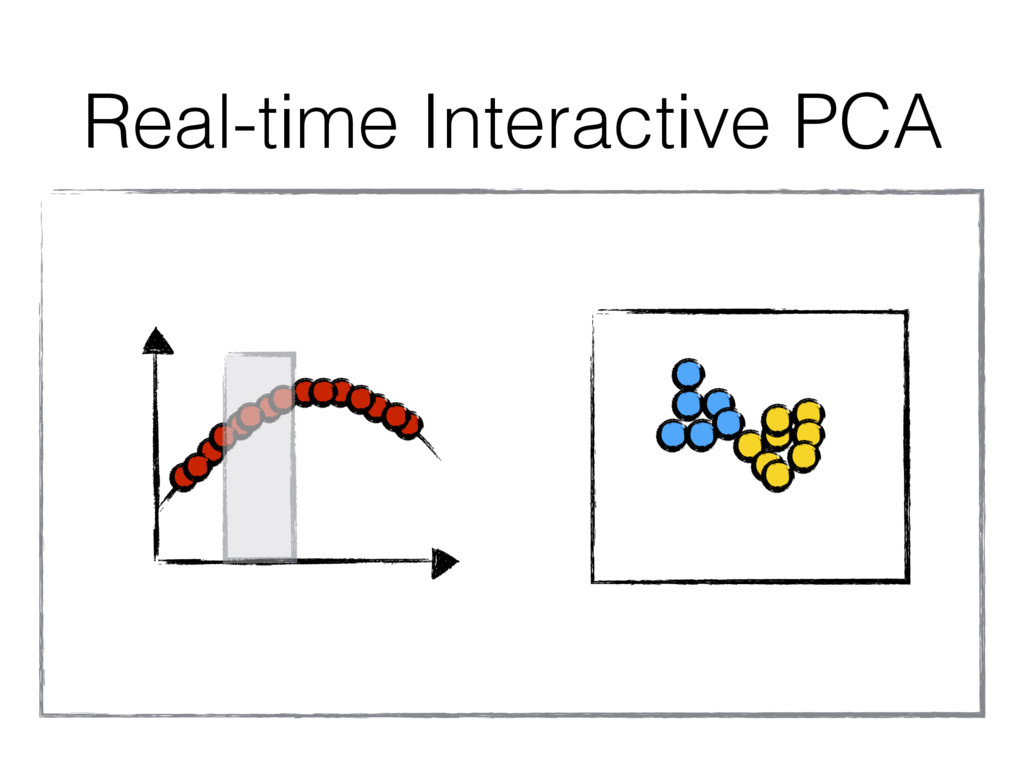
Real-time Interactive PCA
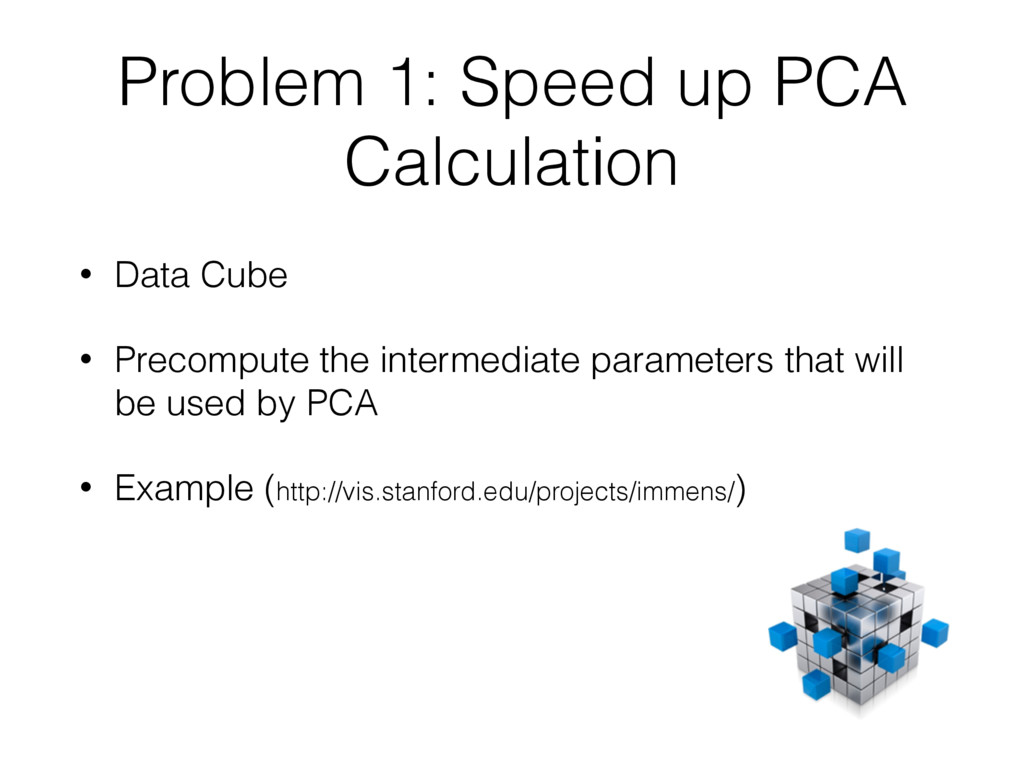
Problem 1: Speed up PCA Calculation • Data Cube •
Precompute the intermediate parameters that will be used by PCA • Example (http://vis.stanford.edu/projects/immens/)
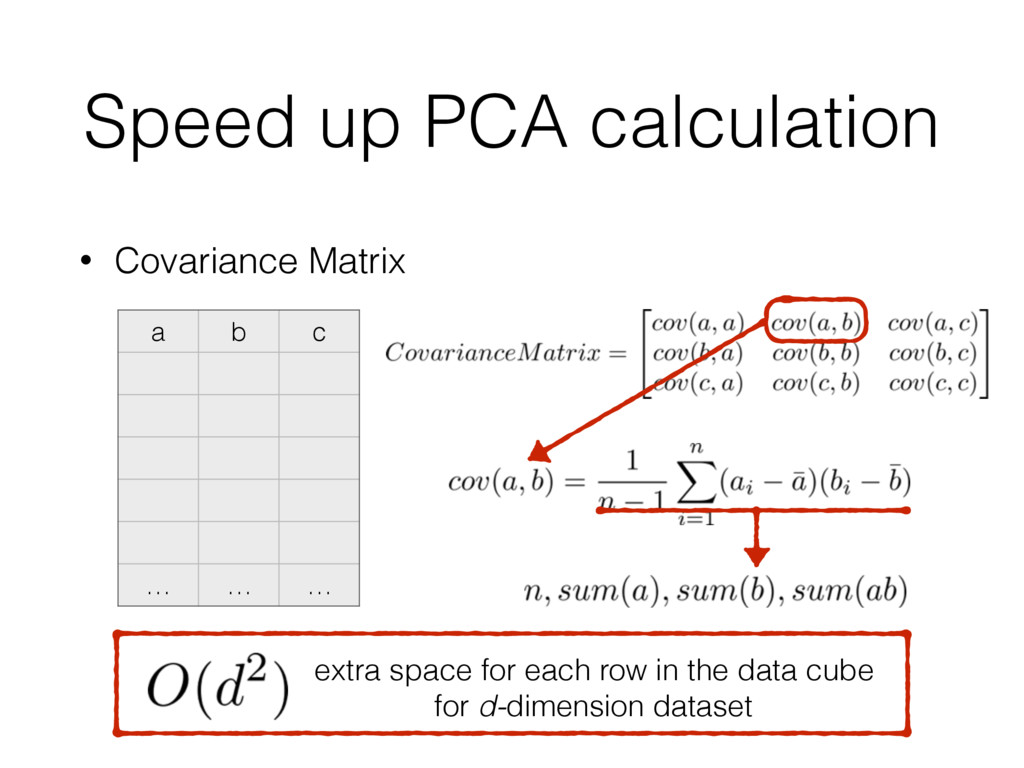
Speed up PCA calculation • Covariance Matrix a b c
… … … extra space for each row in the data cube for d-dimension dataset
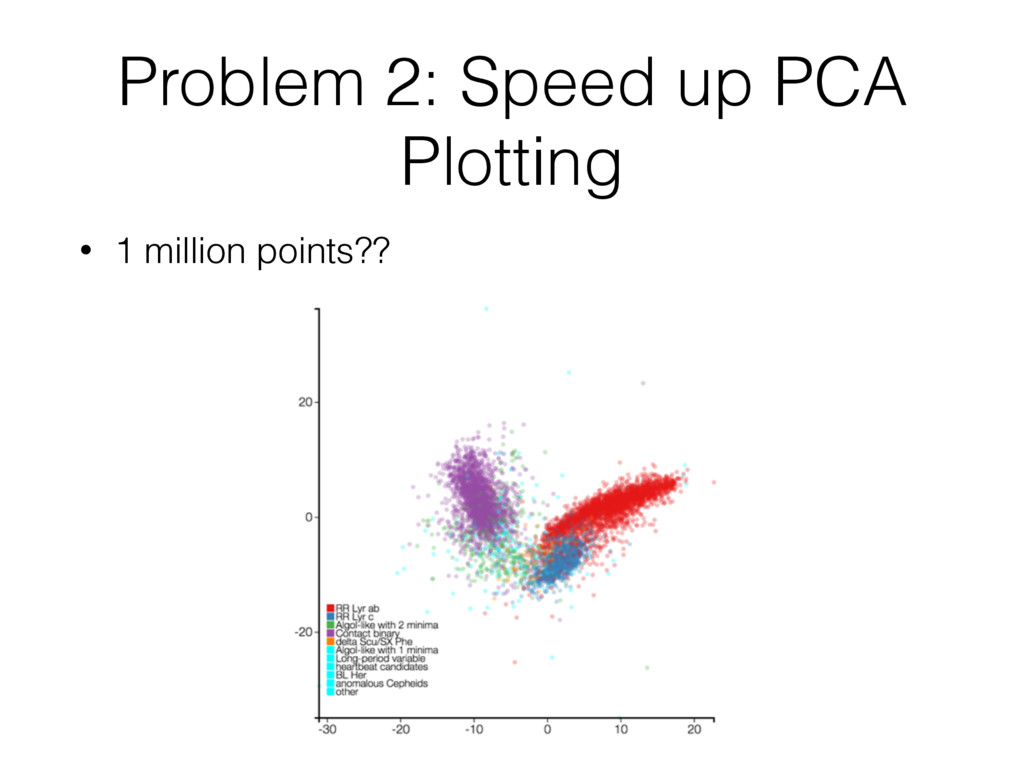
Problem 2: Speed up PCA Plotting • 1 million points??
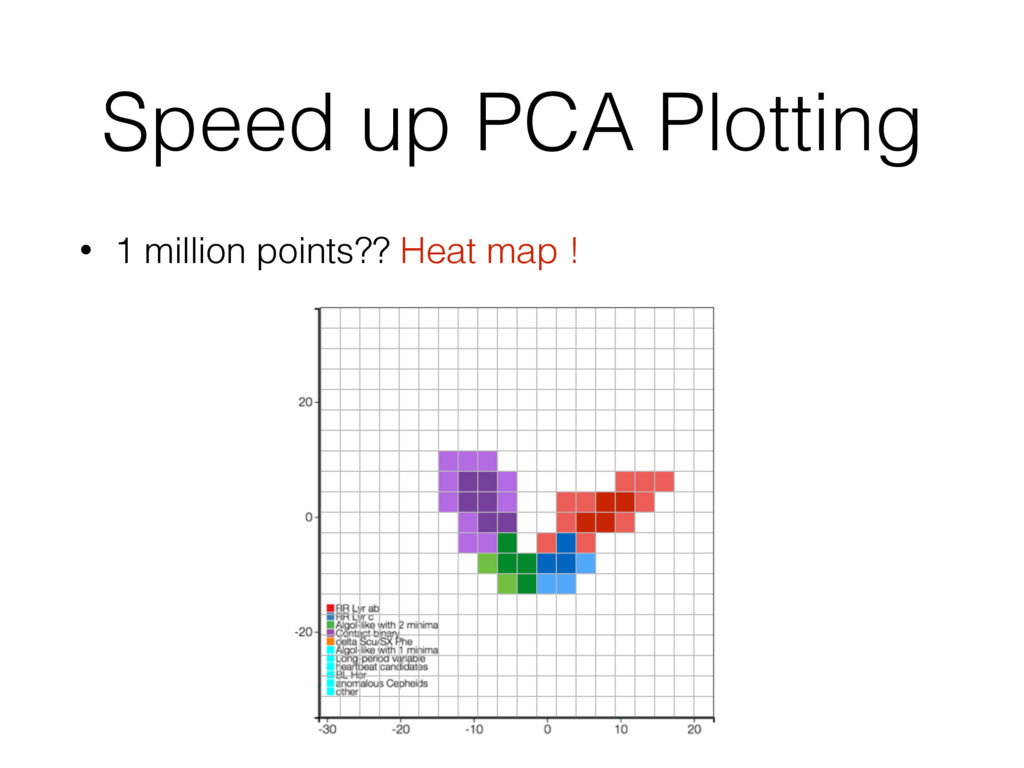
Speed up PCA Plotting • 1 million points?? Heat map
!
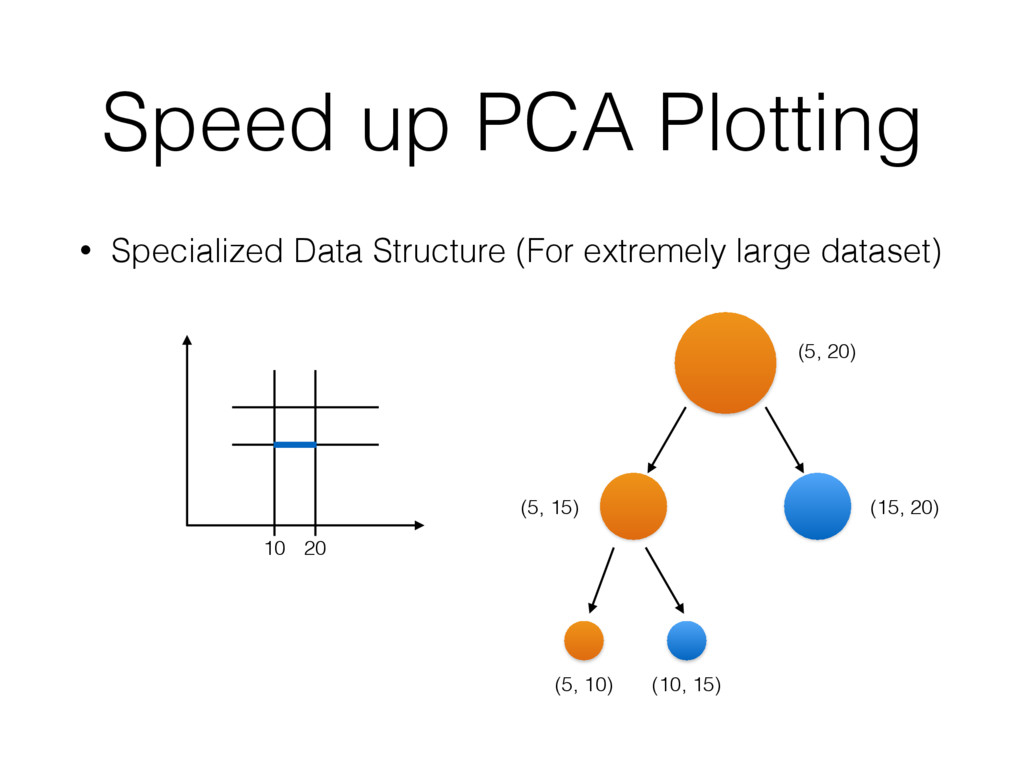
Speed up PCA Plotting • Specialized Data Structure (For extremely
large dataset) 10 20 (5, 20) (5, 15) (15, 20) (5, 10) (10, 15)
Demo
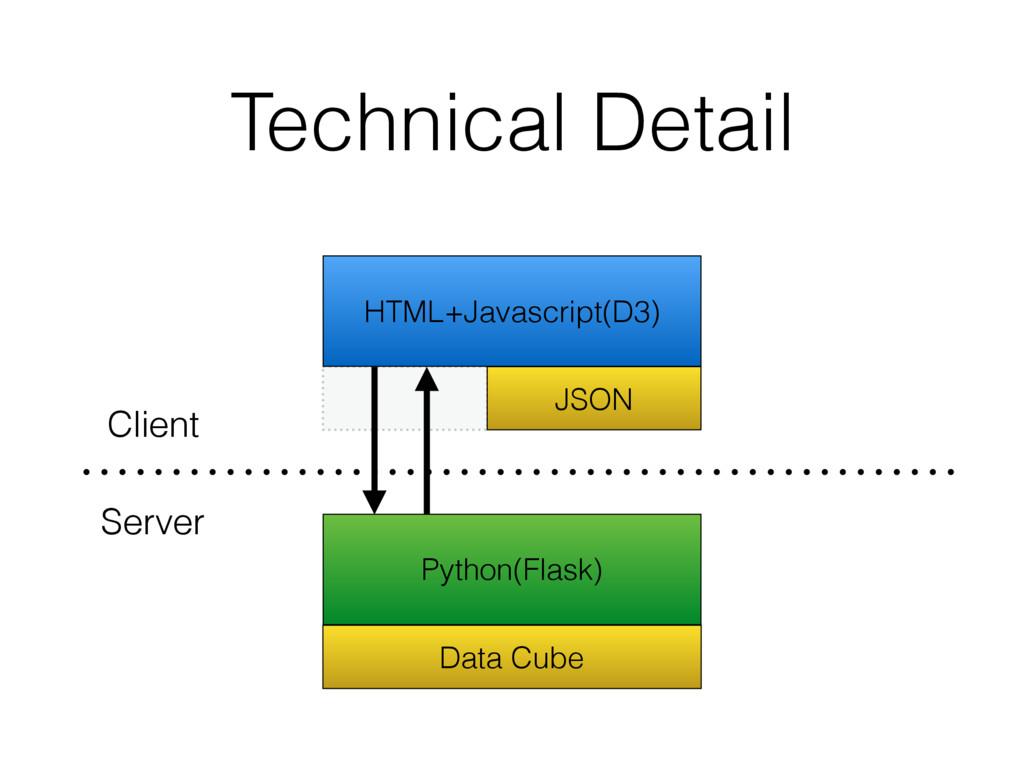
Technical Detail HTML+Javascript(D3) JSON Client Server Python(Flask) Data Cube
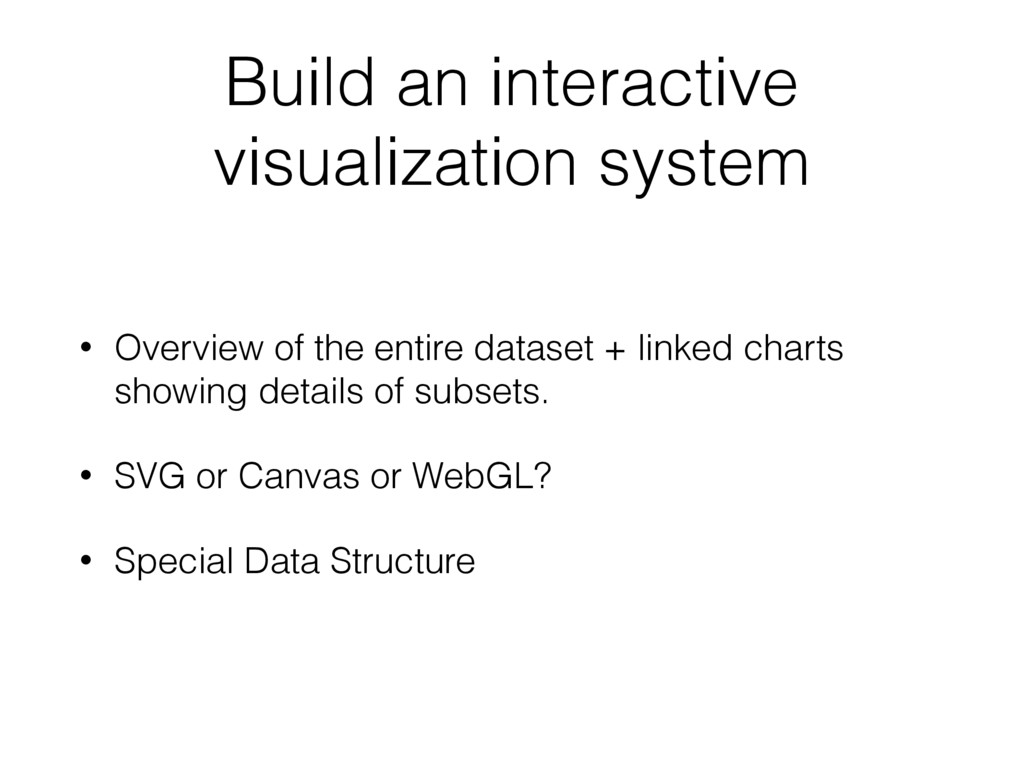
Build an interactive visualization system • Overview of the entire
dataset + linked charts showing details of subsets. • SVG or Canvas or WebGL? • Special Data Structure
Thanks!