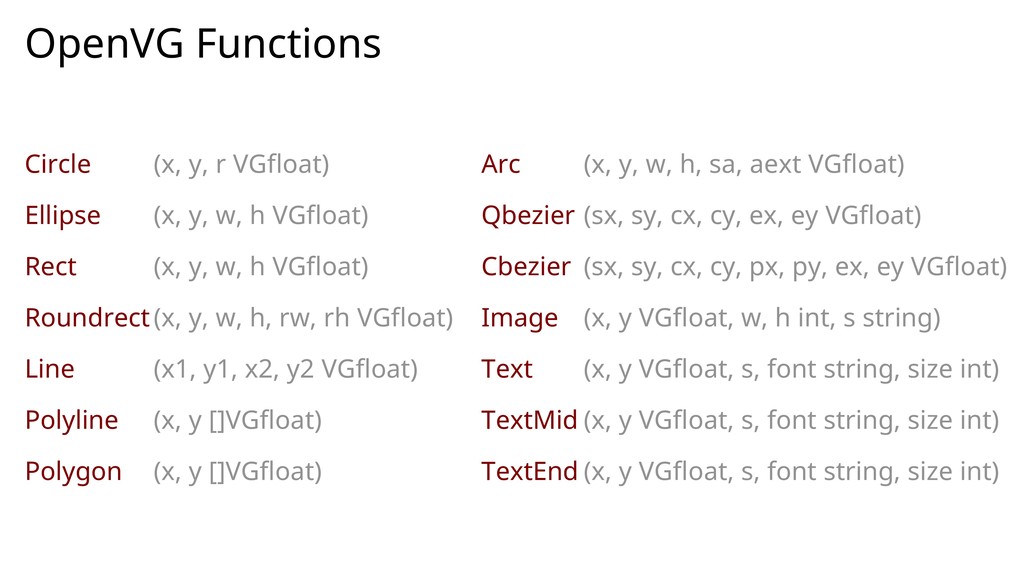
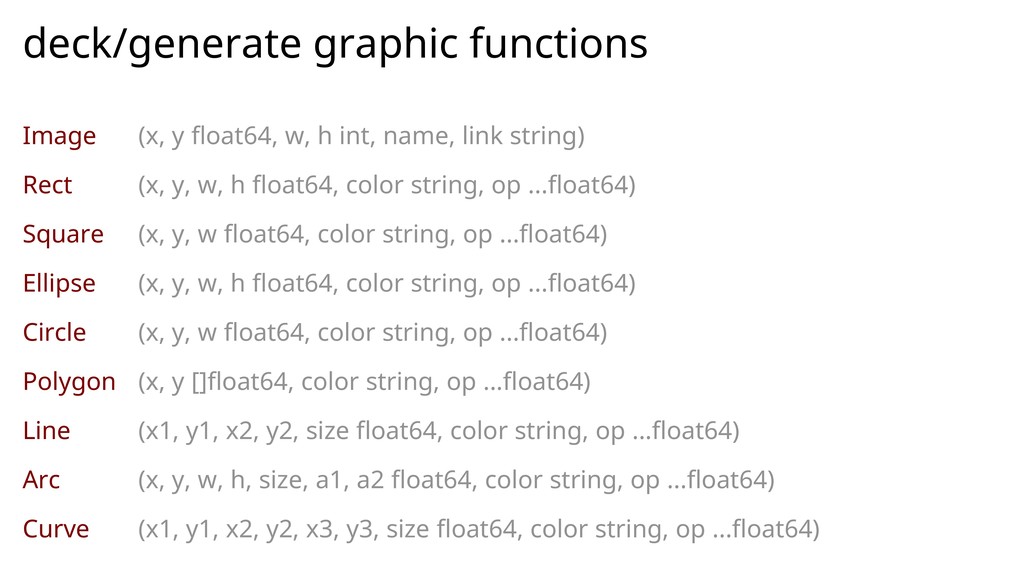
y, r VGfloat) (x, y, w, h VGfloat) (x, y, w, h VGfloat) (x, y, w, h, rw, rh VGfloat) (x1, y1, x2, y2 VGfloat) (x, y []VGfloat) (x, y []VGfloat) Arc Qbezier Cbezier Image Text TextMid TextEnd (x, y, w, h, sa, aext VGfloat) (sx, sy, cx, cy, ex, ey VGfloat) (sx, sy, cx, cy, px, py, ex, ey VGfloat) (x, y VGfloat, w, h int, s string) (x, y VGfloat, s, font string, size int) (x, y VGfloat, s, font string, size int) (x, y VGfloat, s, font string, size int)
![// List items := []string{"First", "Second", "Third", "Fourth", "Fifth"} deck.StartSlide("blanchedalmond",](https://files.speakerdeck.com/presentations/c58584259a4d4e35839a3d8cf87c5254/slide_68.jpg)
![Deck Web API sex -dir [start dir] -listen [address:port] -maxupload](https://files.speakerdeck.com/presentations/c58584259a4d4e35839a3d8cf87c5254/slide_72.jpg)
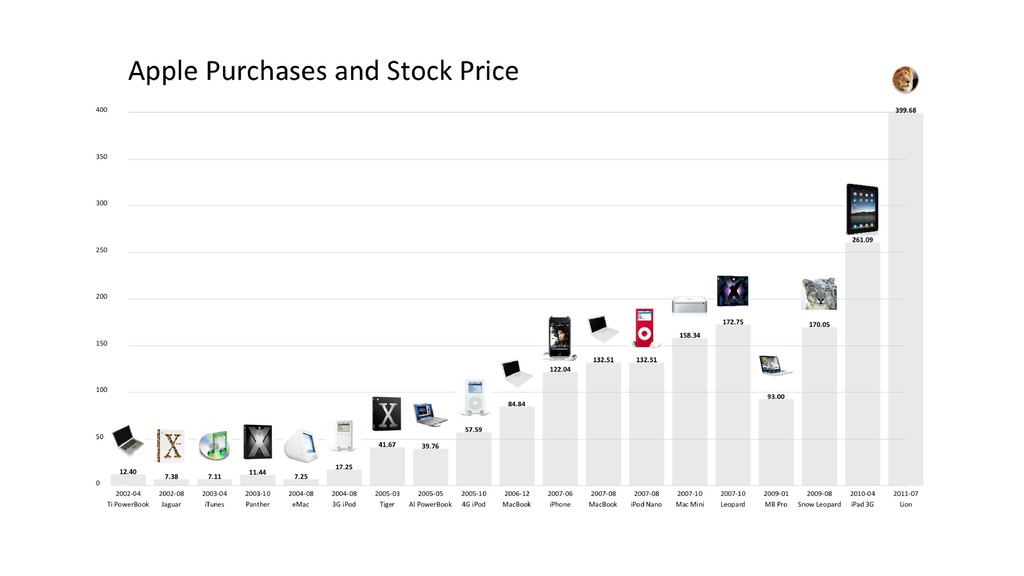
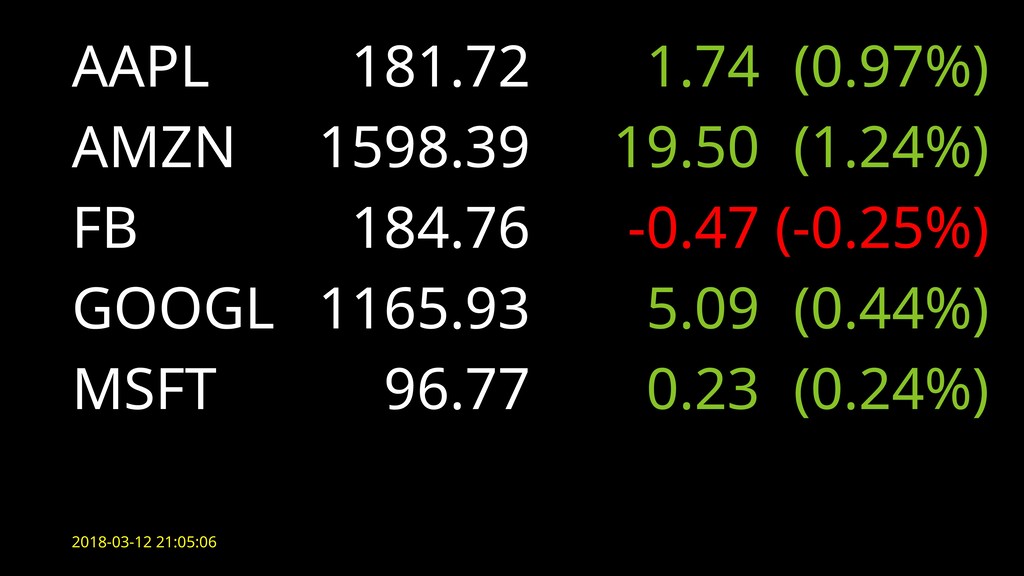
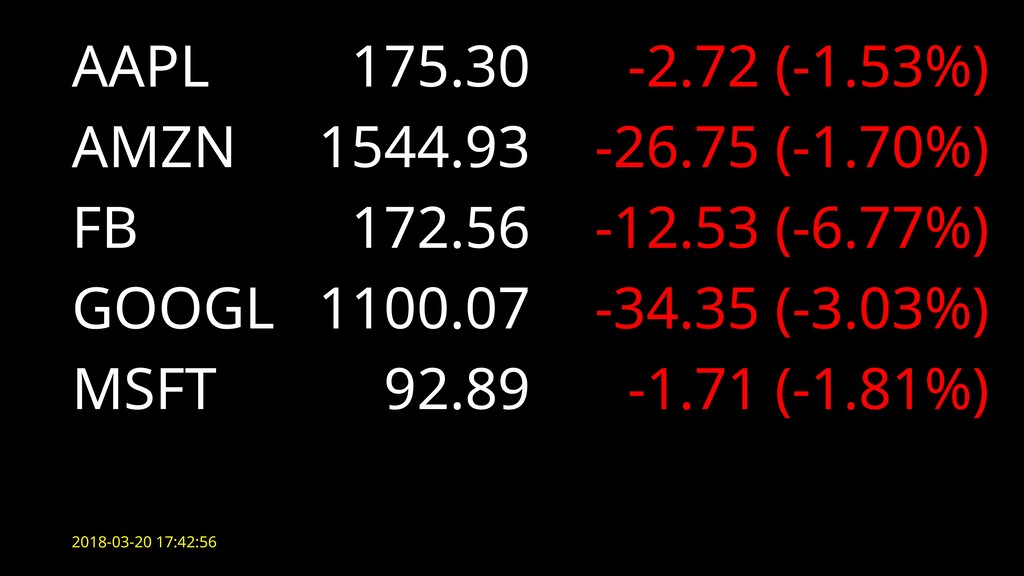
![func stockslide(deck *generate.Deck, symbols []string) { x := left y](https://files.speakerdeck.com/presentations/c58584259a4d4e35839a3d8cf87c5254/slide_86.jpg)
![From: Russ Cox Subject: Re: [go-nuts] Visualizing Random Number Generators...](https://files.speakerdeck.com/presentations/c58584259a4d4e35839a3d8cf87c5254/slide_135.jpg)
![Thank you @ajstarks [email protected] github.com/ajstarks speakerdeck.com/ajstarks flickr.com/photos/ajstarks](https://files.speakerdeck.com/presentations/c58584259a4d4e35839a3d8cf87c5254/slide_142.jpg)