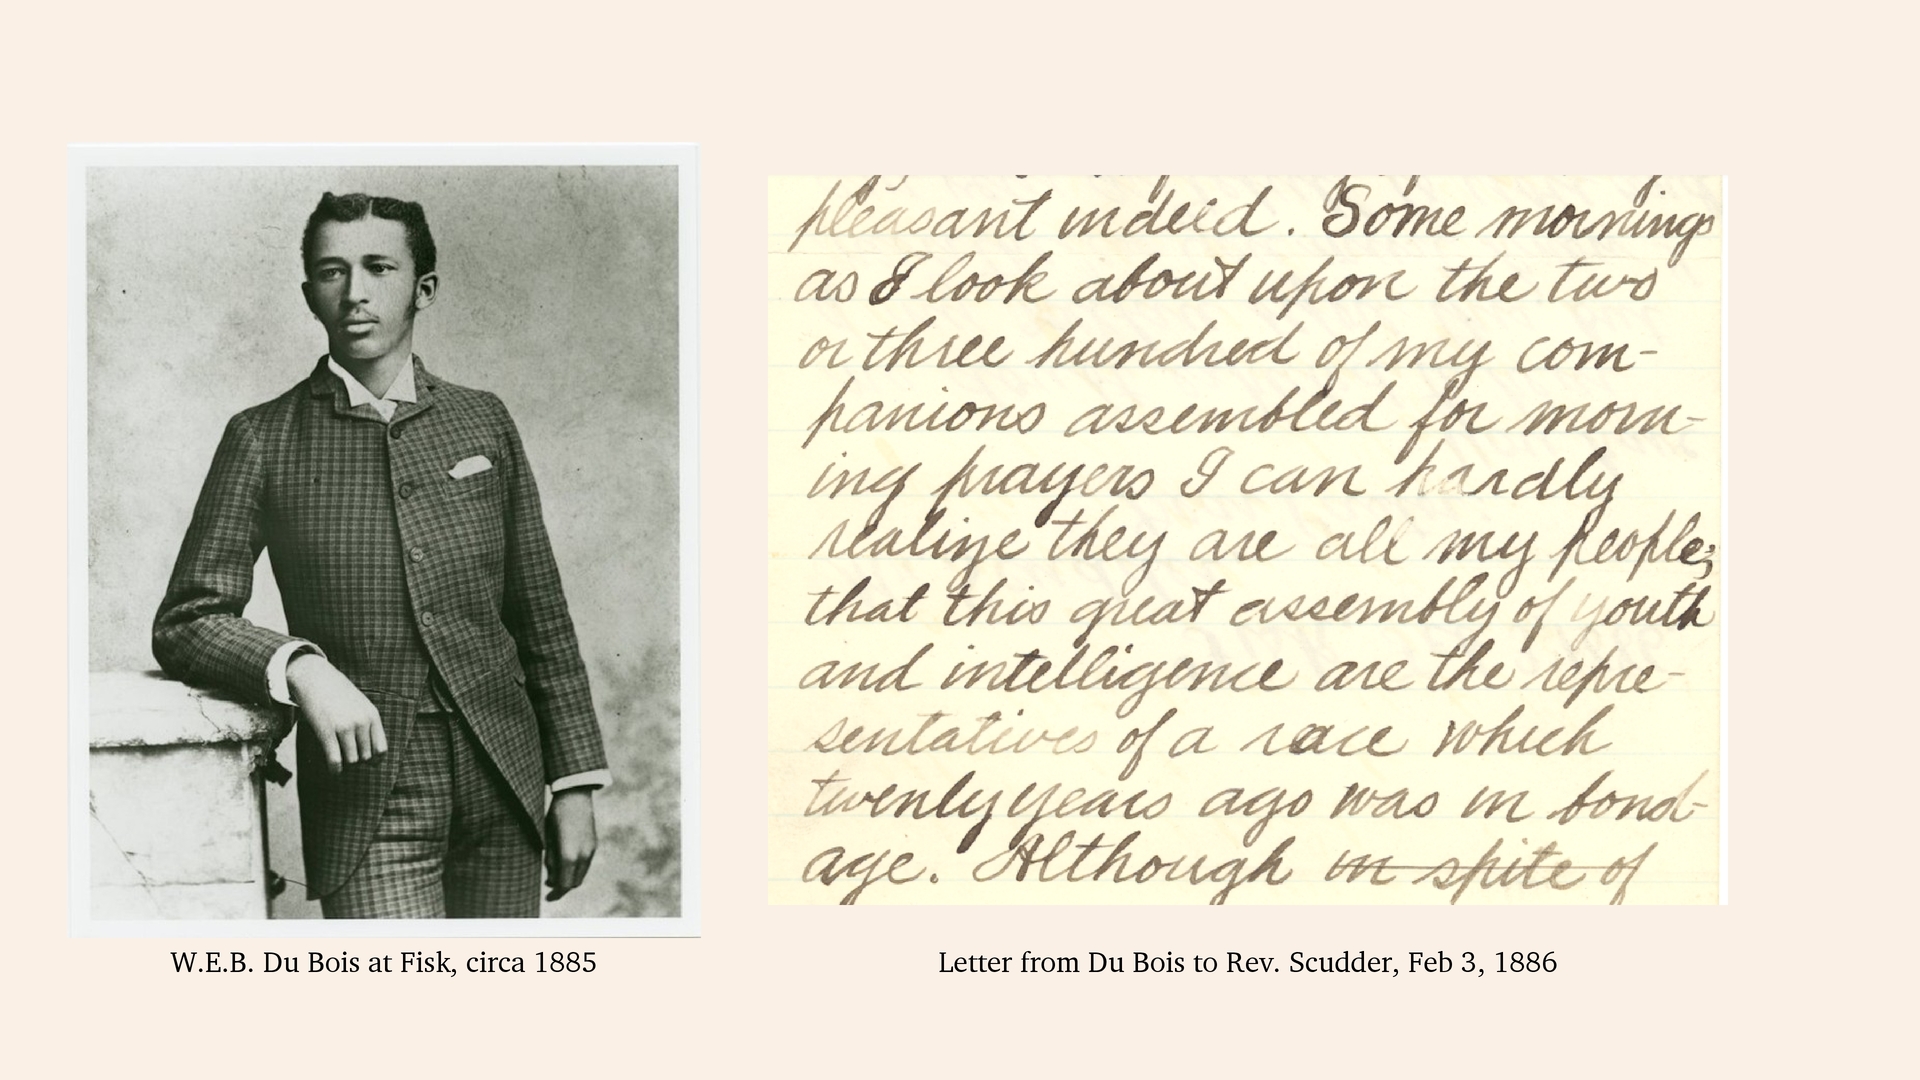
three hundred of my companions assembled for morning prayers I can hardly realize they are all my people; that this great assembly of youth and intelligence are representatives of a race which twenty years ago was in bondage.” Letter from Du Bois to Pastor Scudder, Feb 3, 1886 W.E.B. Du Bois at Fisk, circa 1885
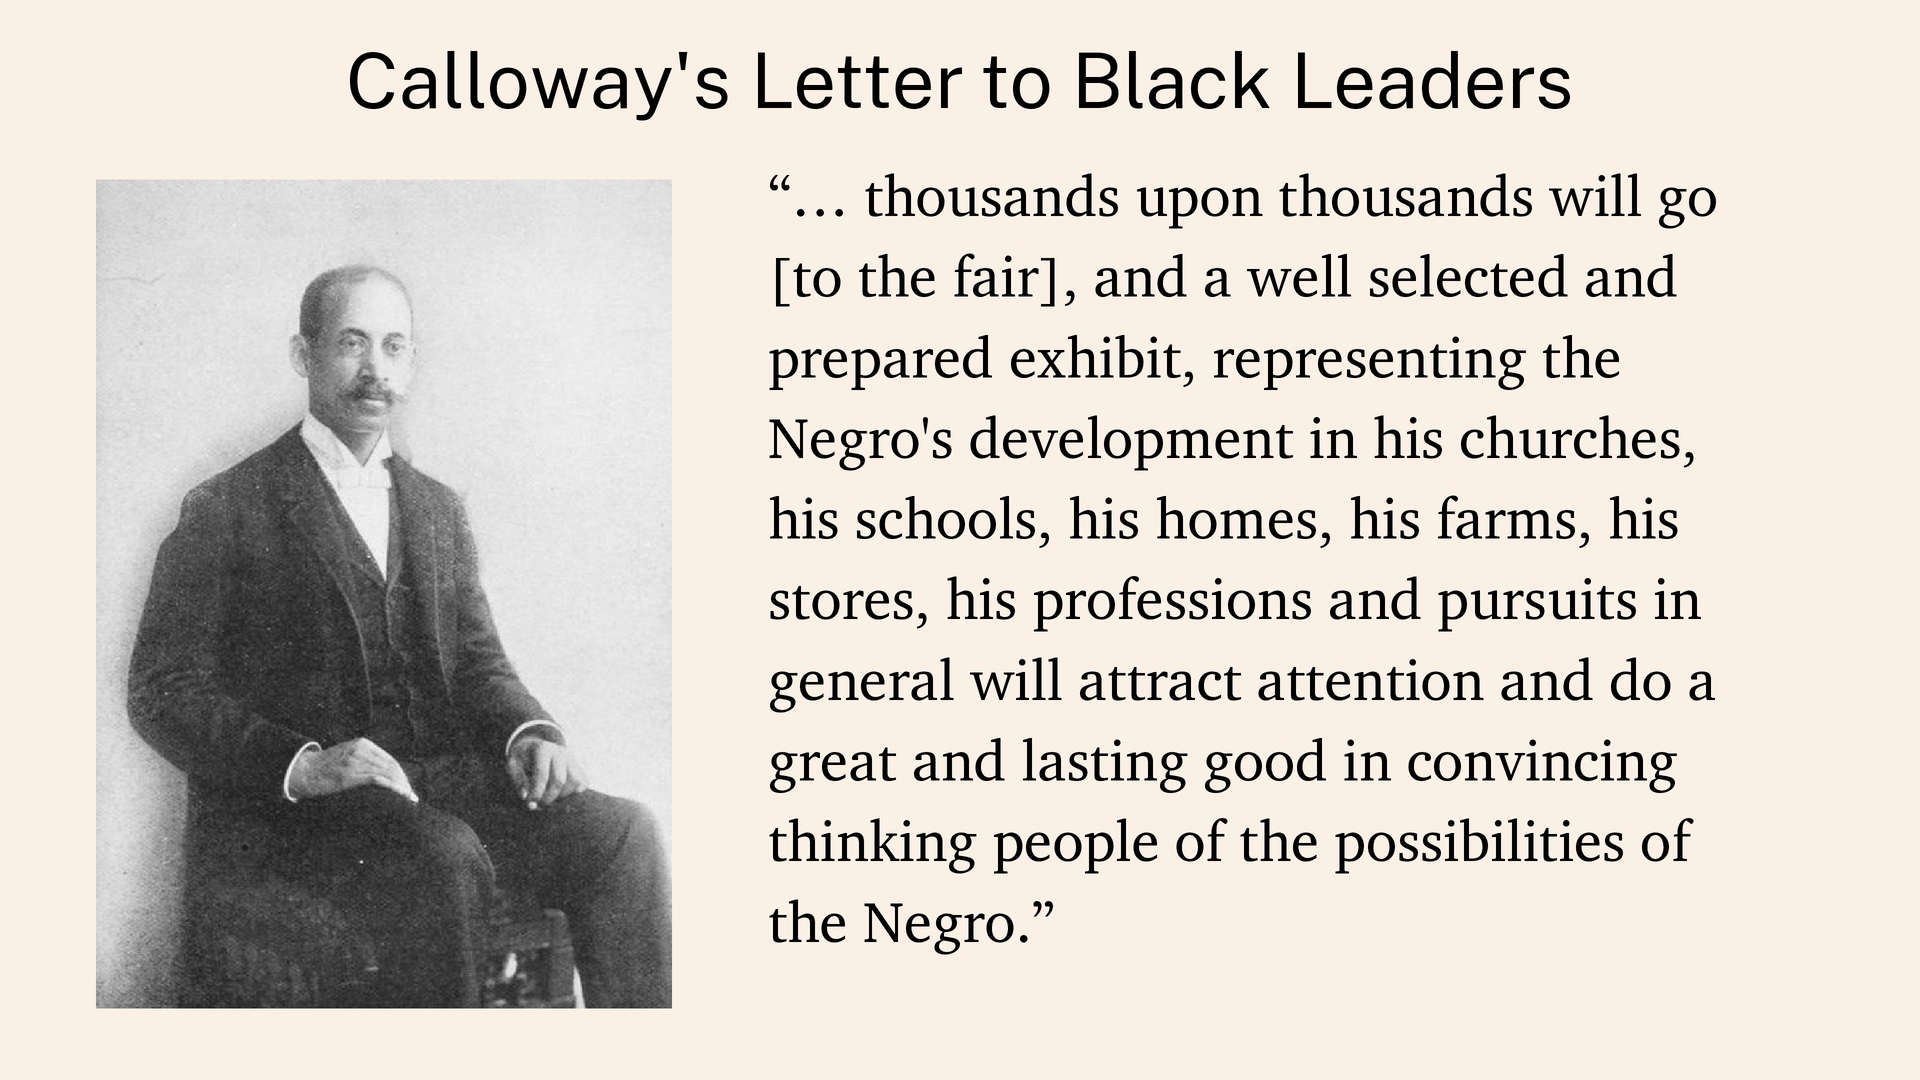
go [to the fair], and a well selected and prepared exhibit, representing the Negro's development in his churches, his schools, his homes, his farms, his stores, his professions and pursuits in general will attract attention and do a great and lasting good in convincing thinking people of the possibilities of the Negro.”
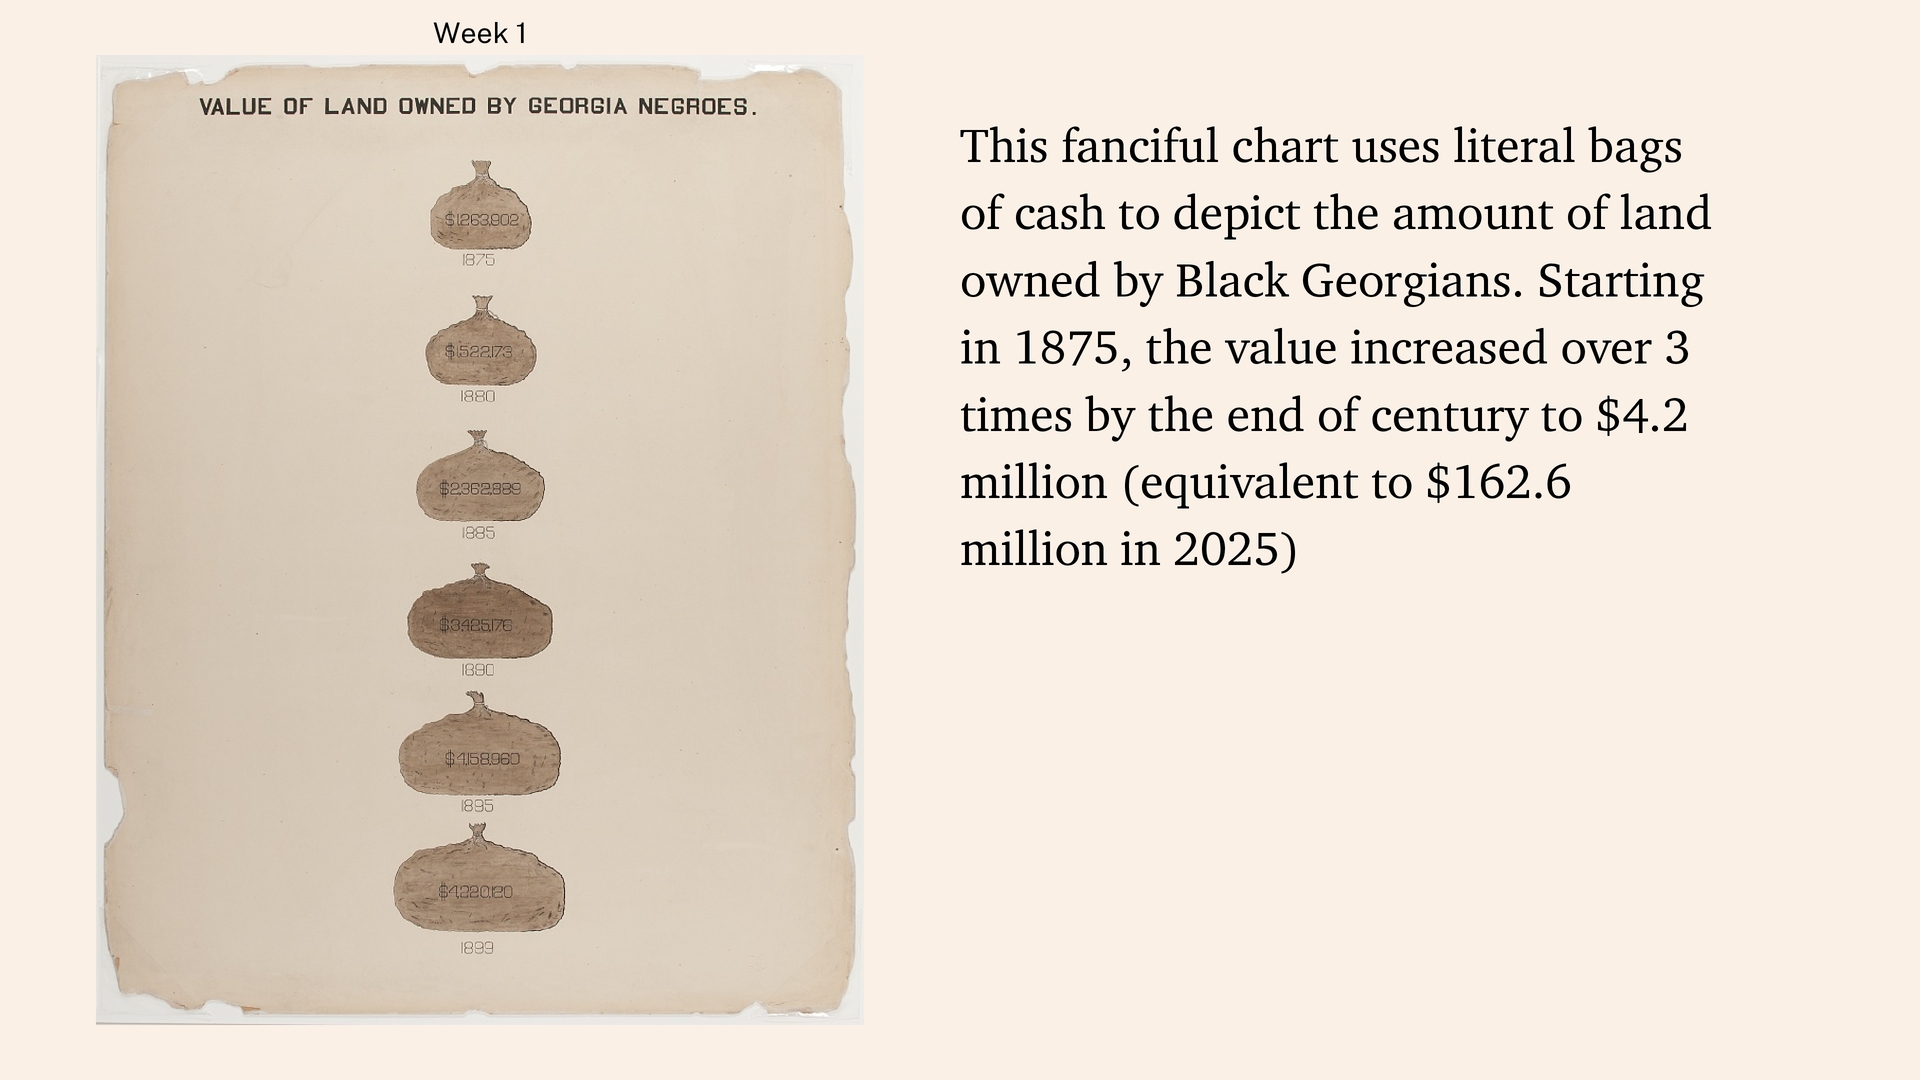
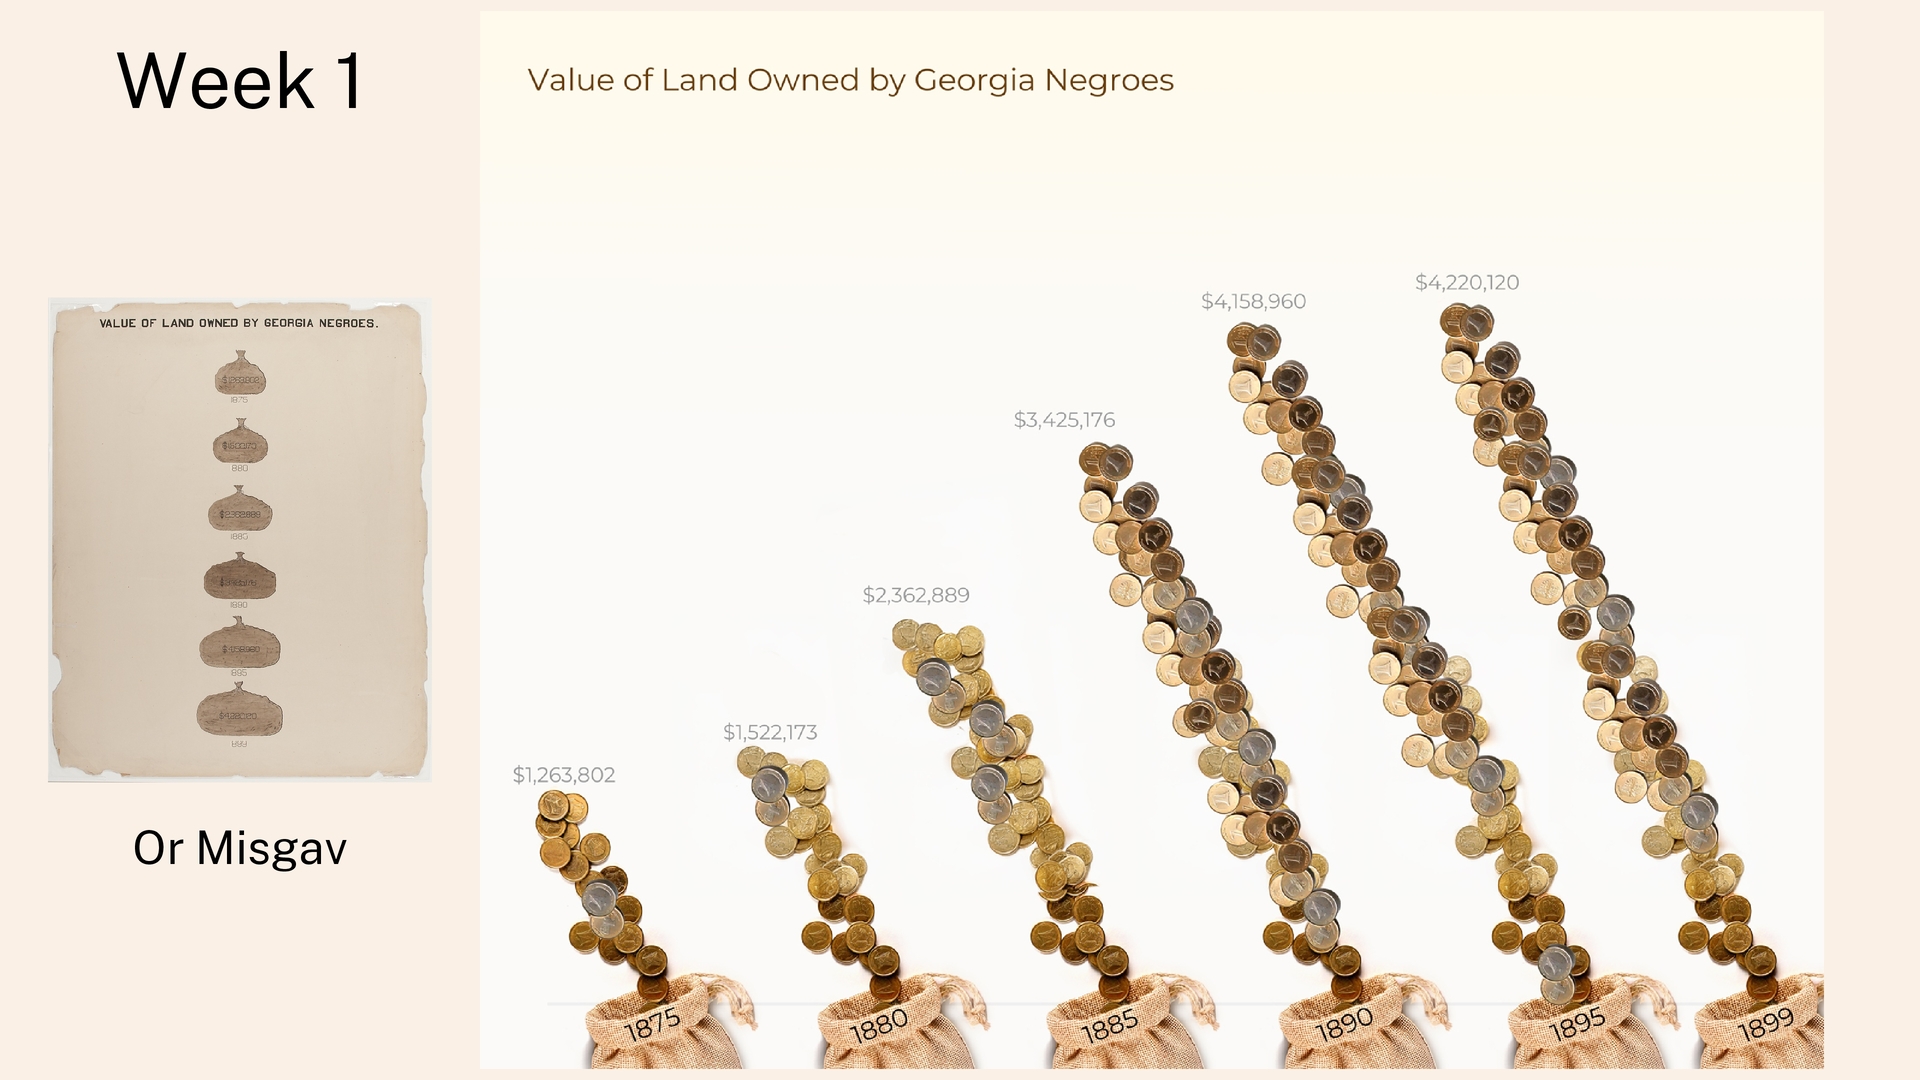
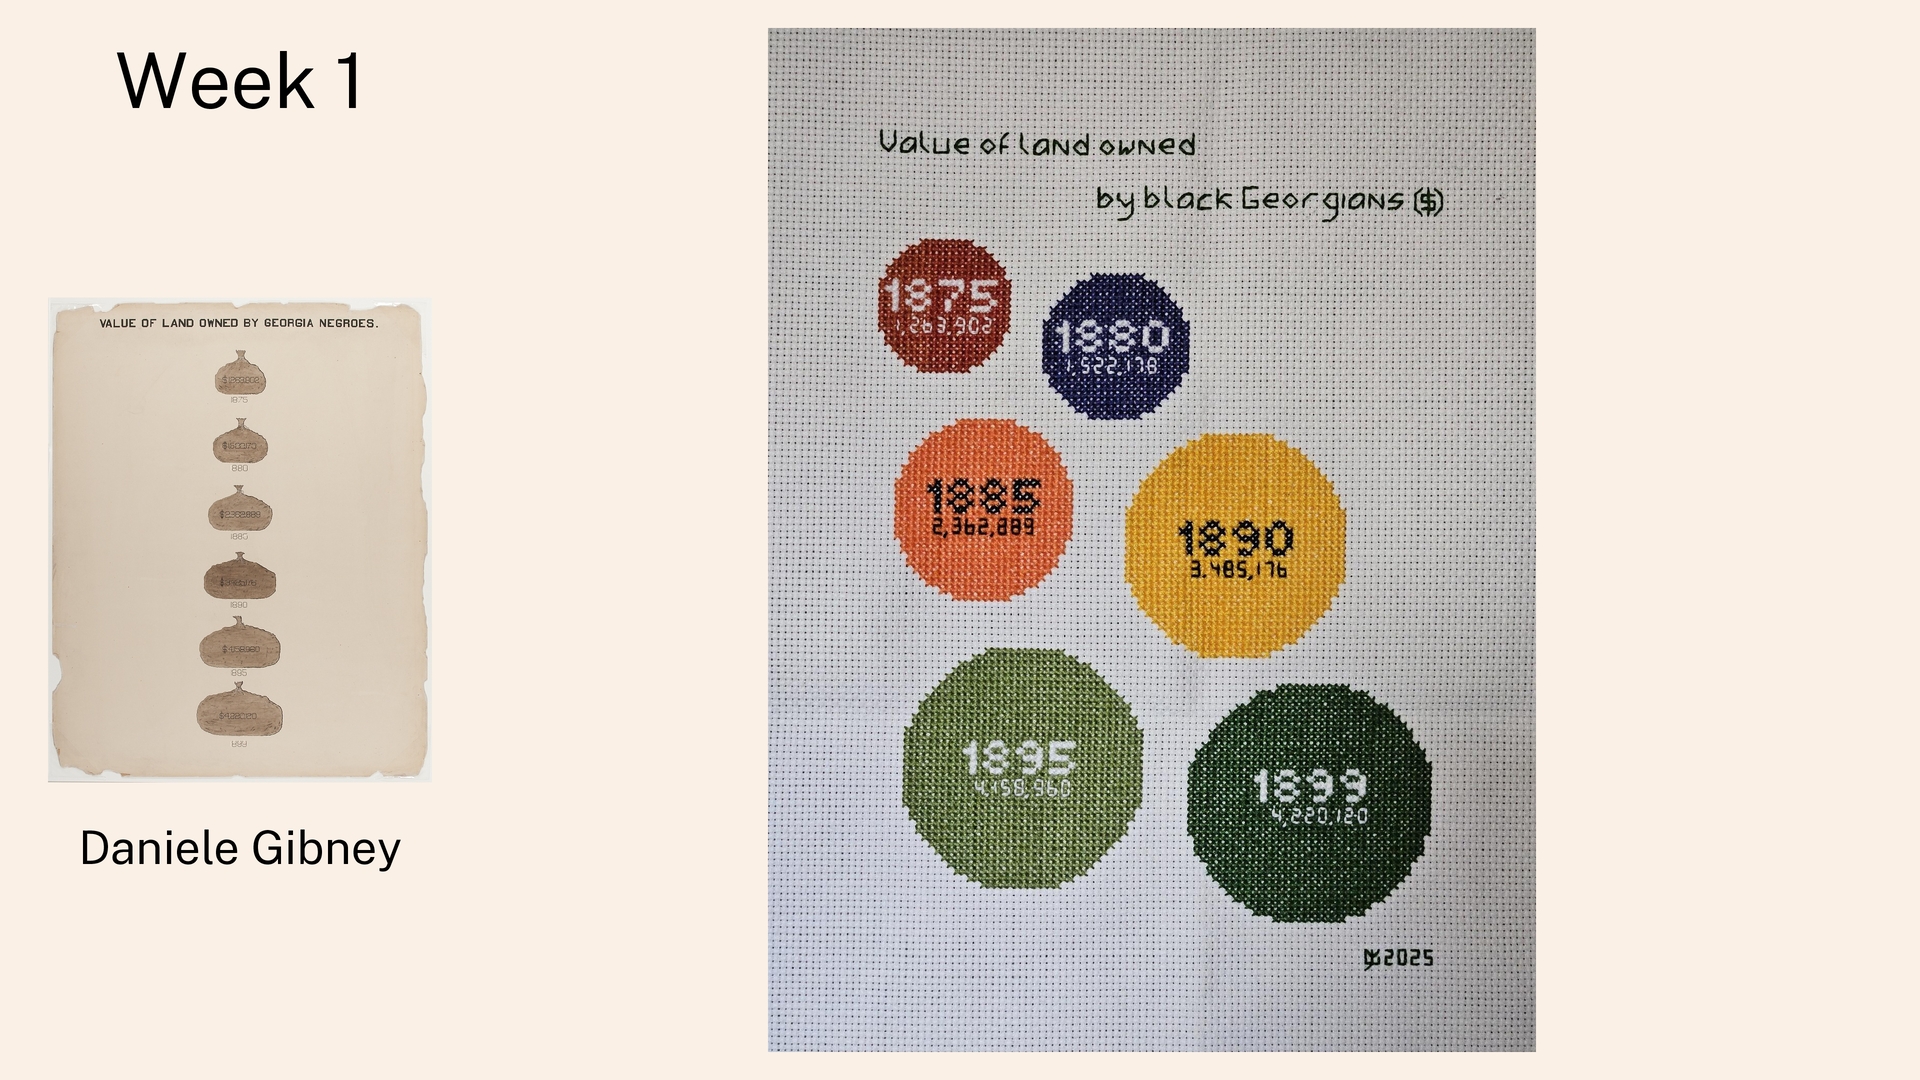
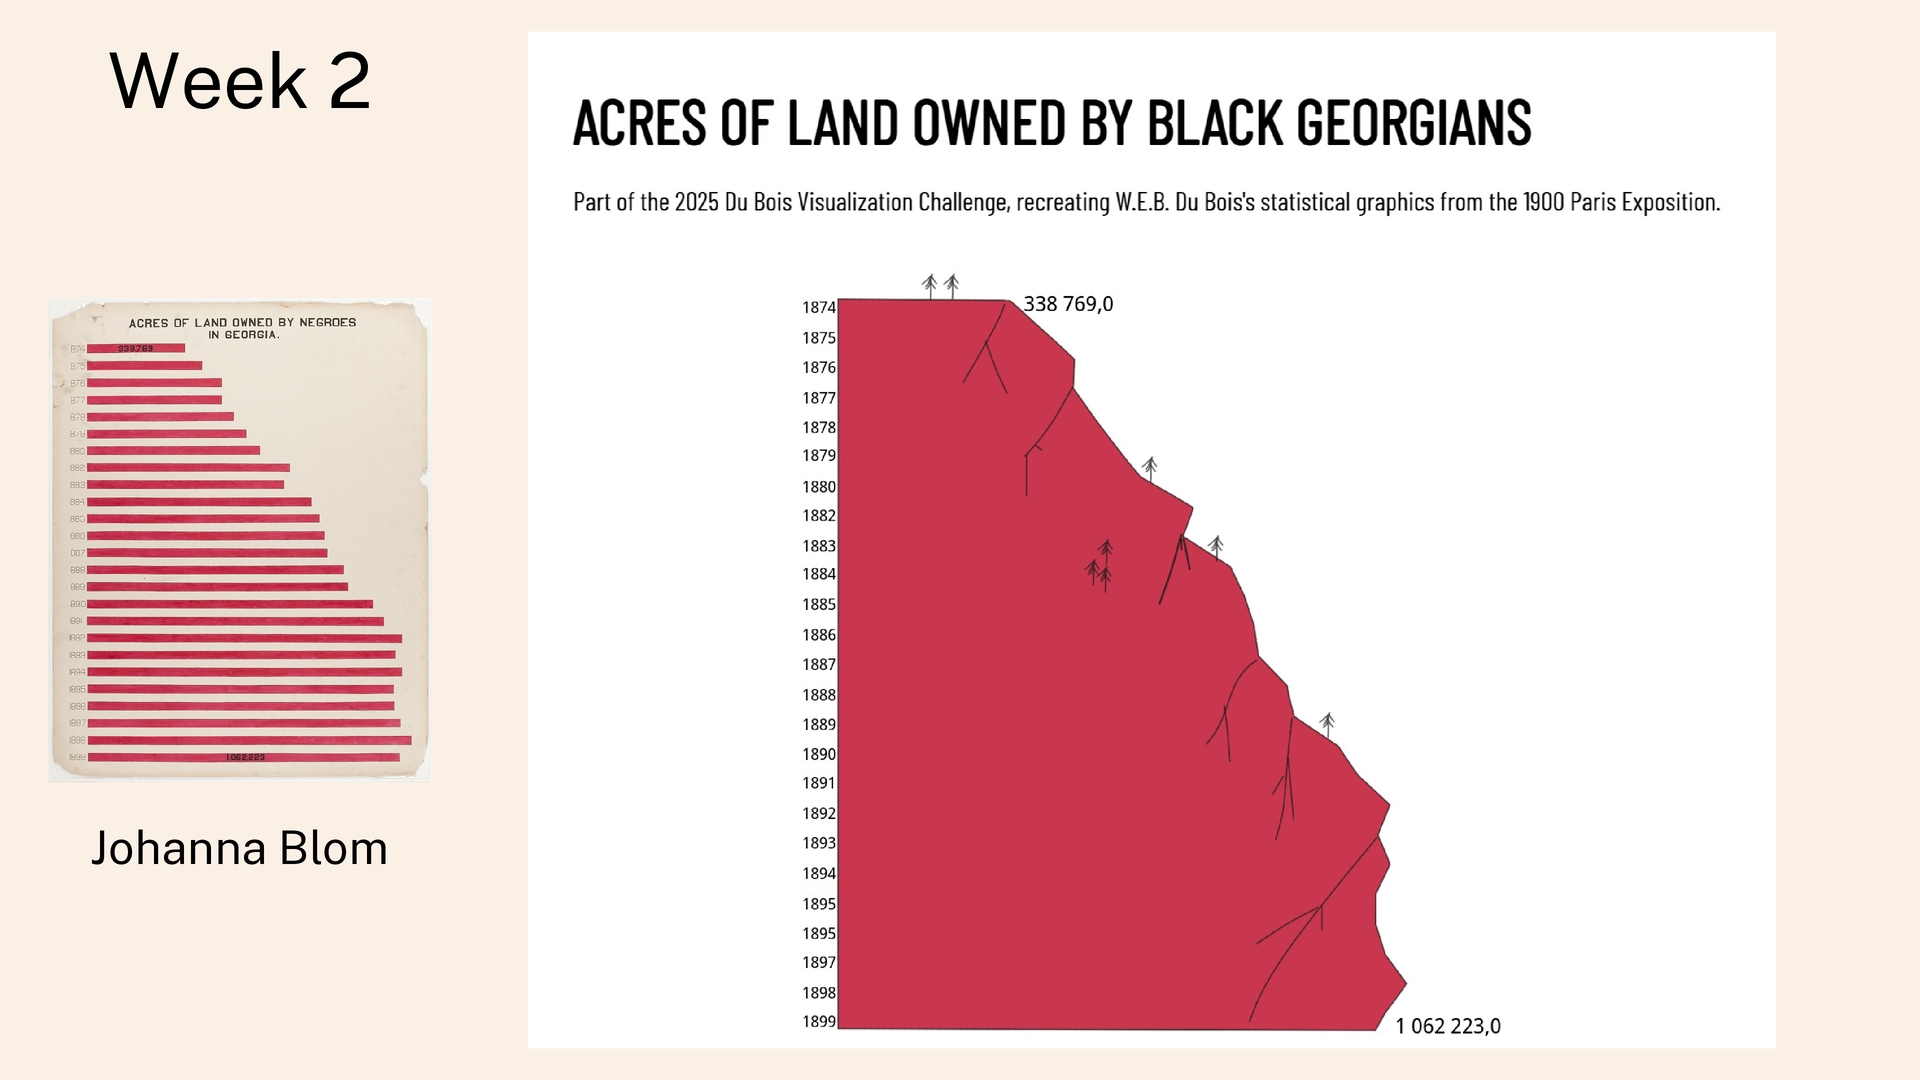
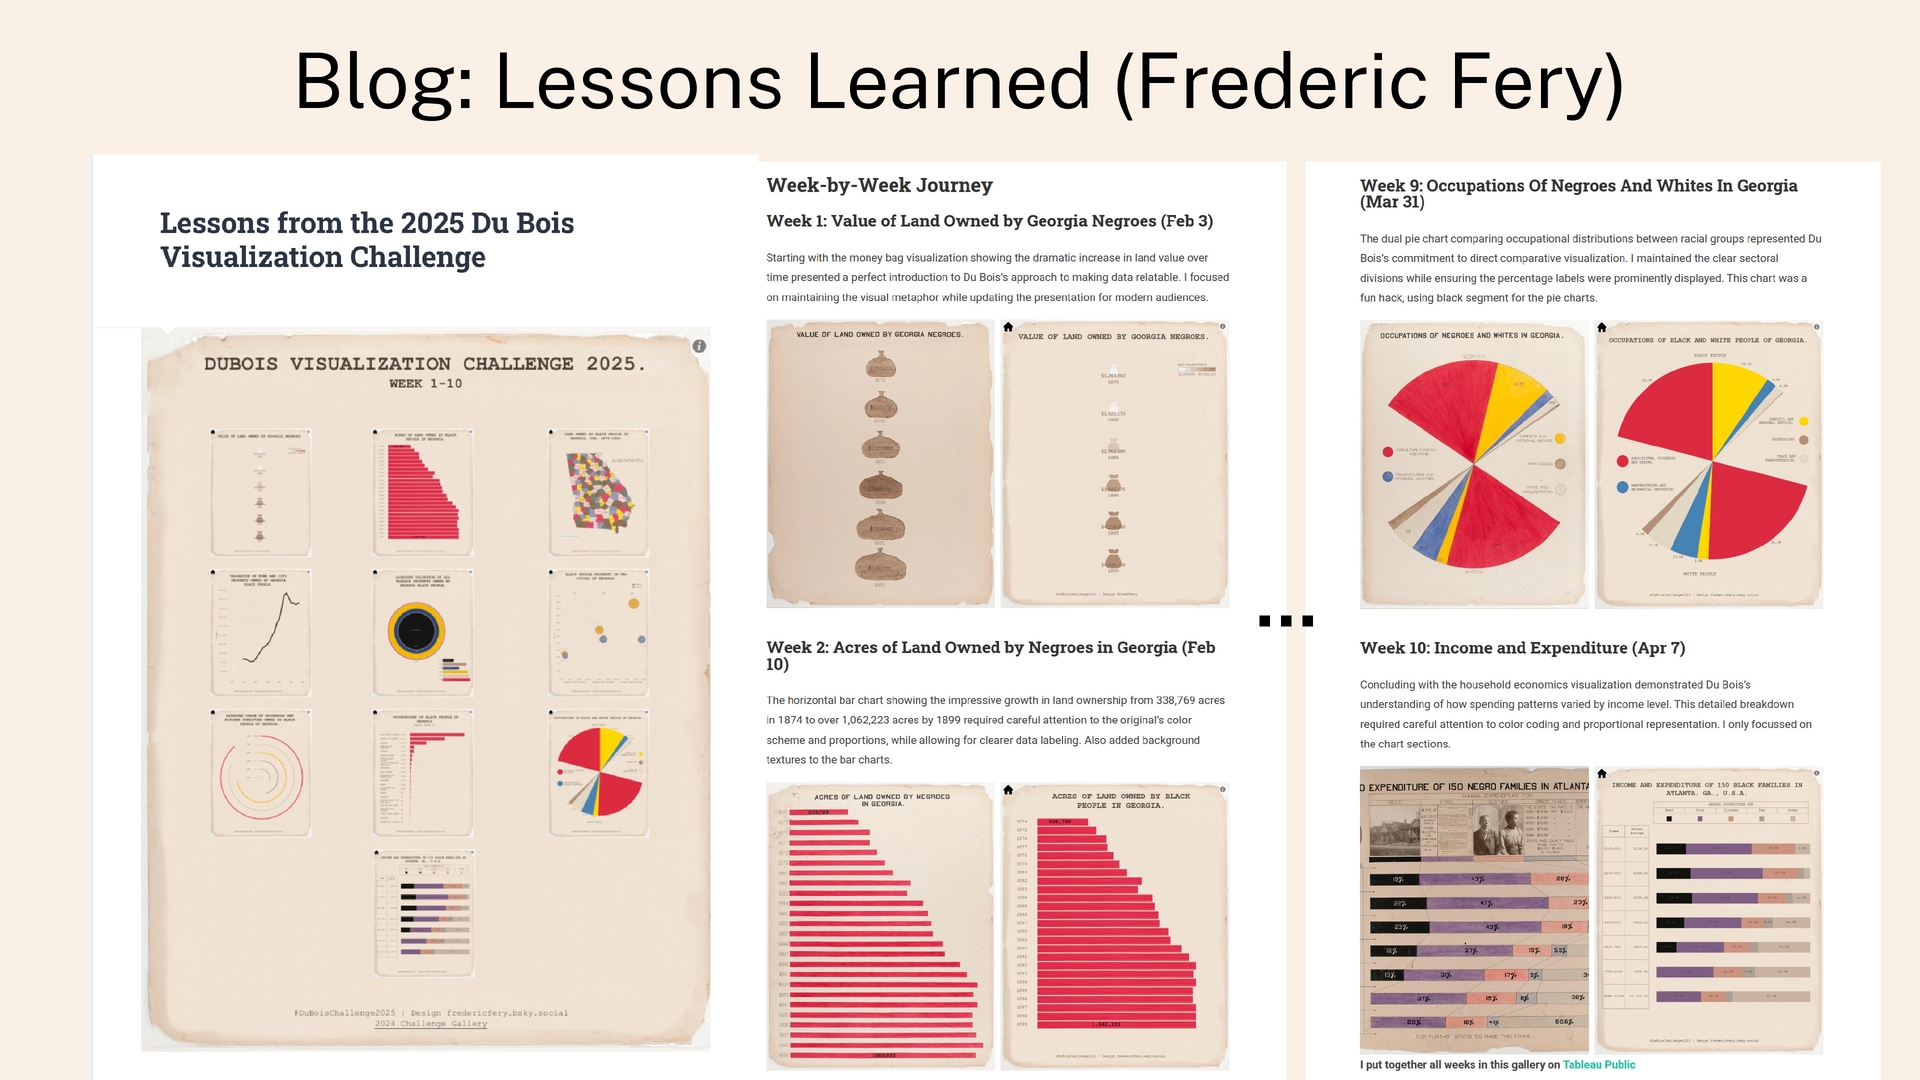
to depict the amount of land owned by Black Georgians. Starting in 1875, the value increased over 3 times by the end of century to $4.2 million (equivalent to $162.6 million in 2025)
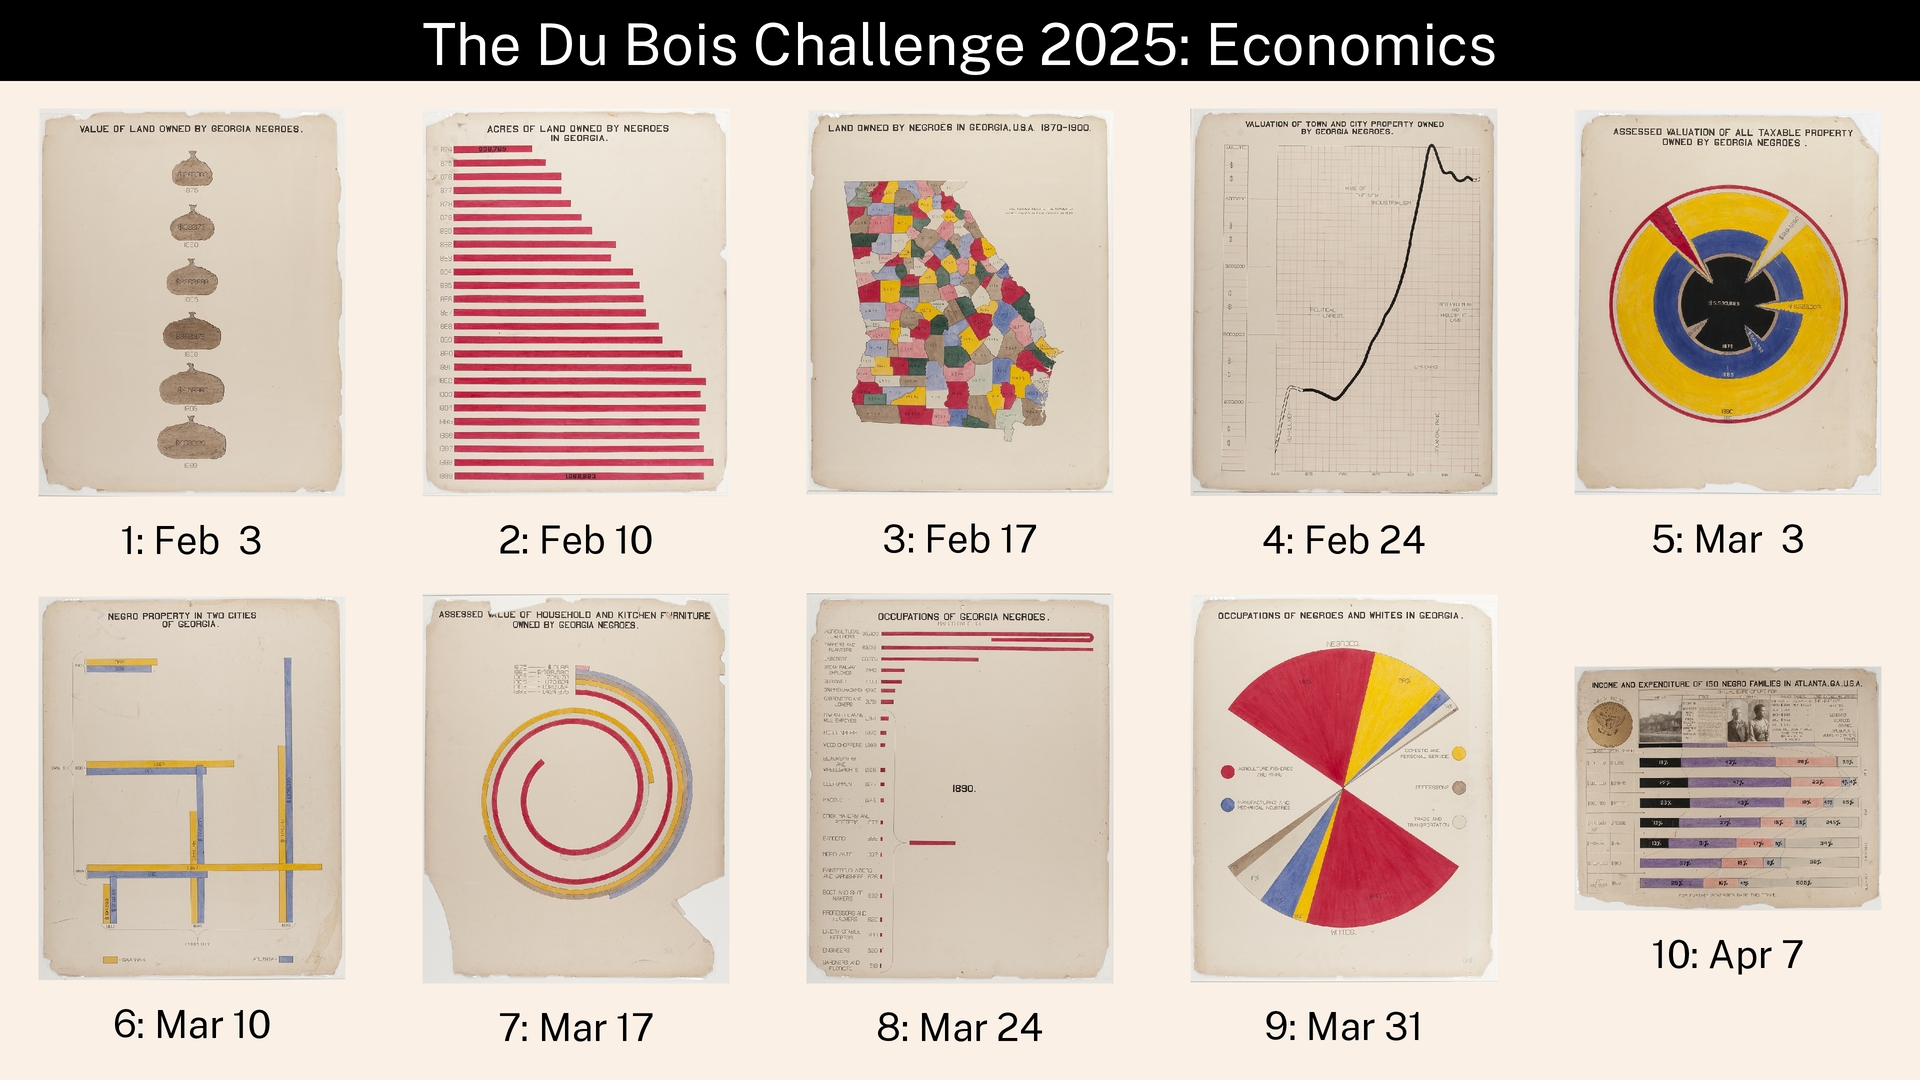
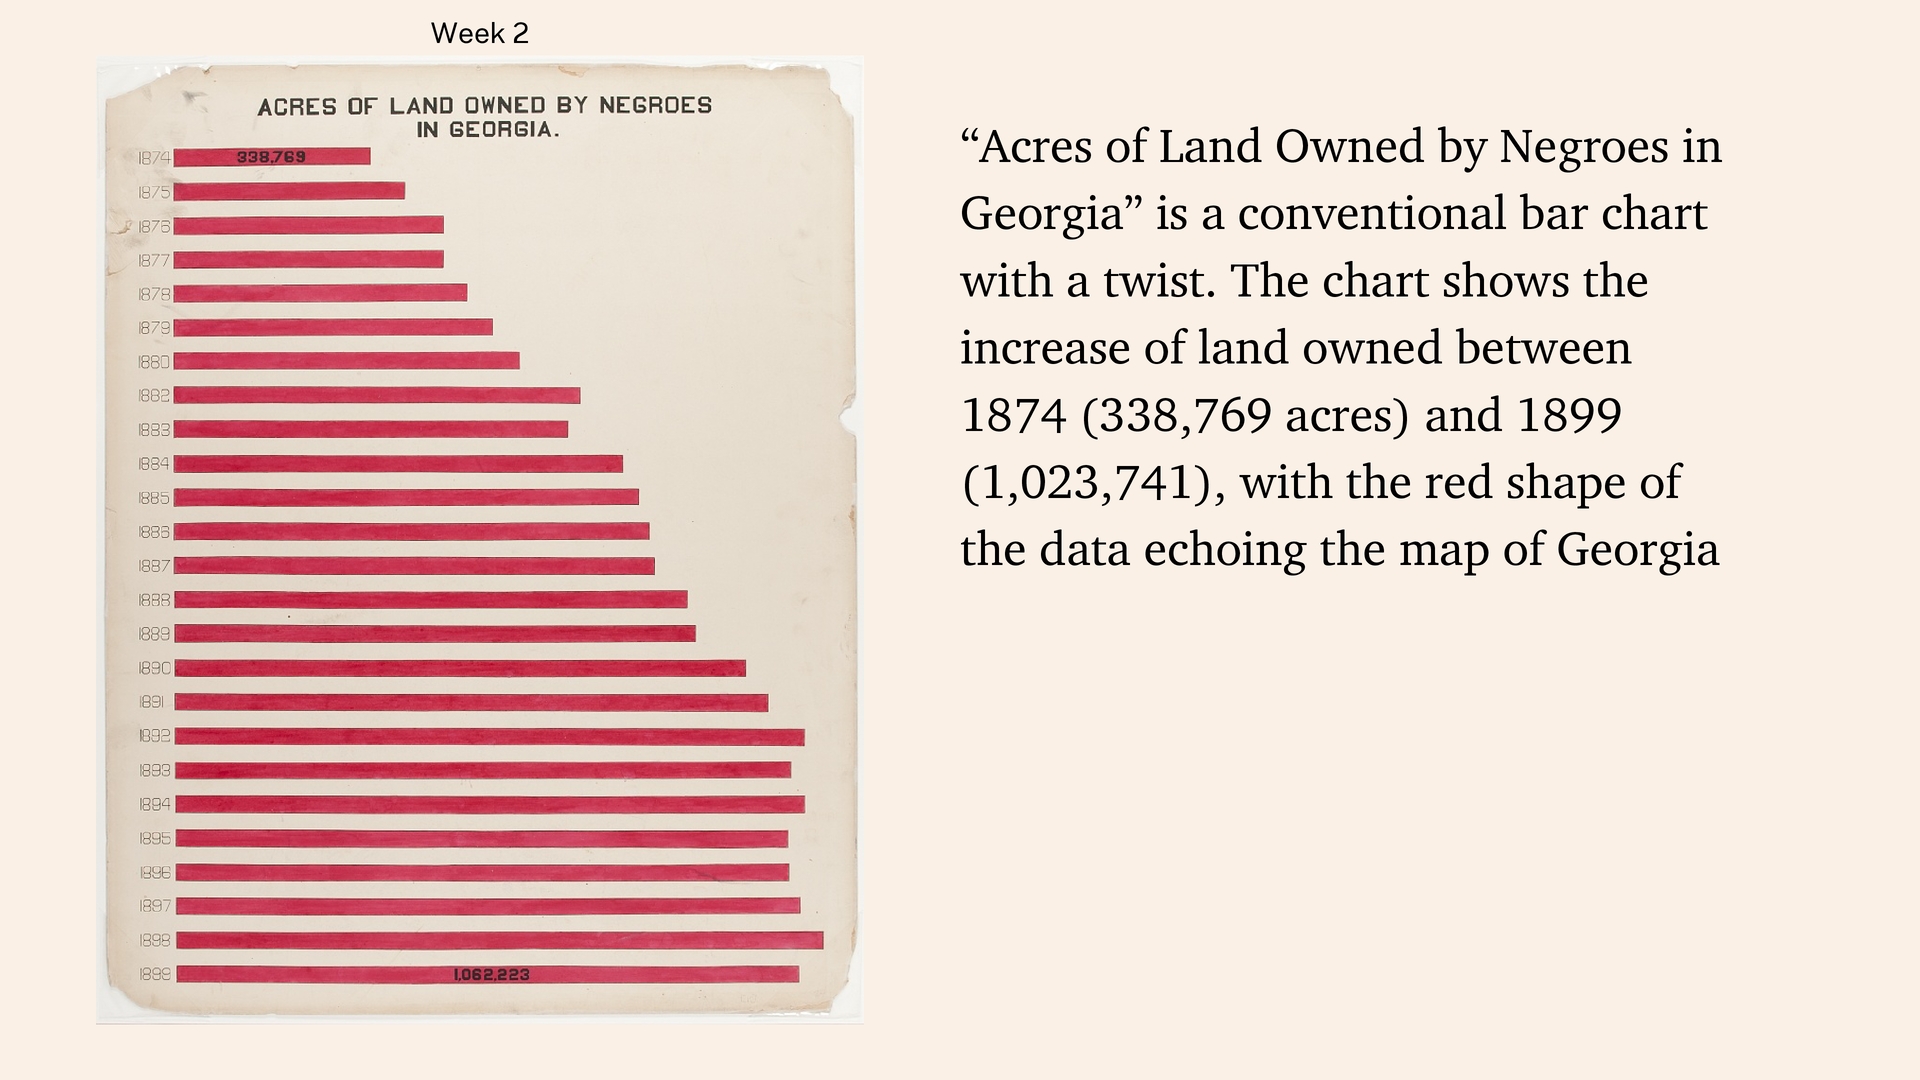
is a conventional bar chart with a twist. The chart shows the increase of land owned between 1874 (338,769 acres) and 1899 (1,023,741), with the red shape of the data echoing the map of Georgia
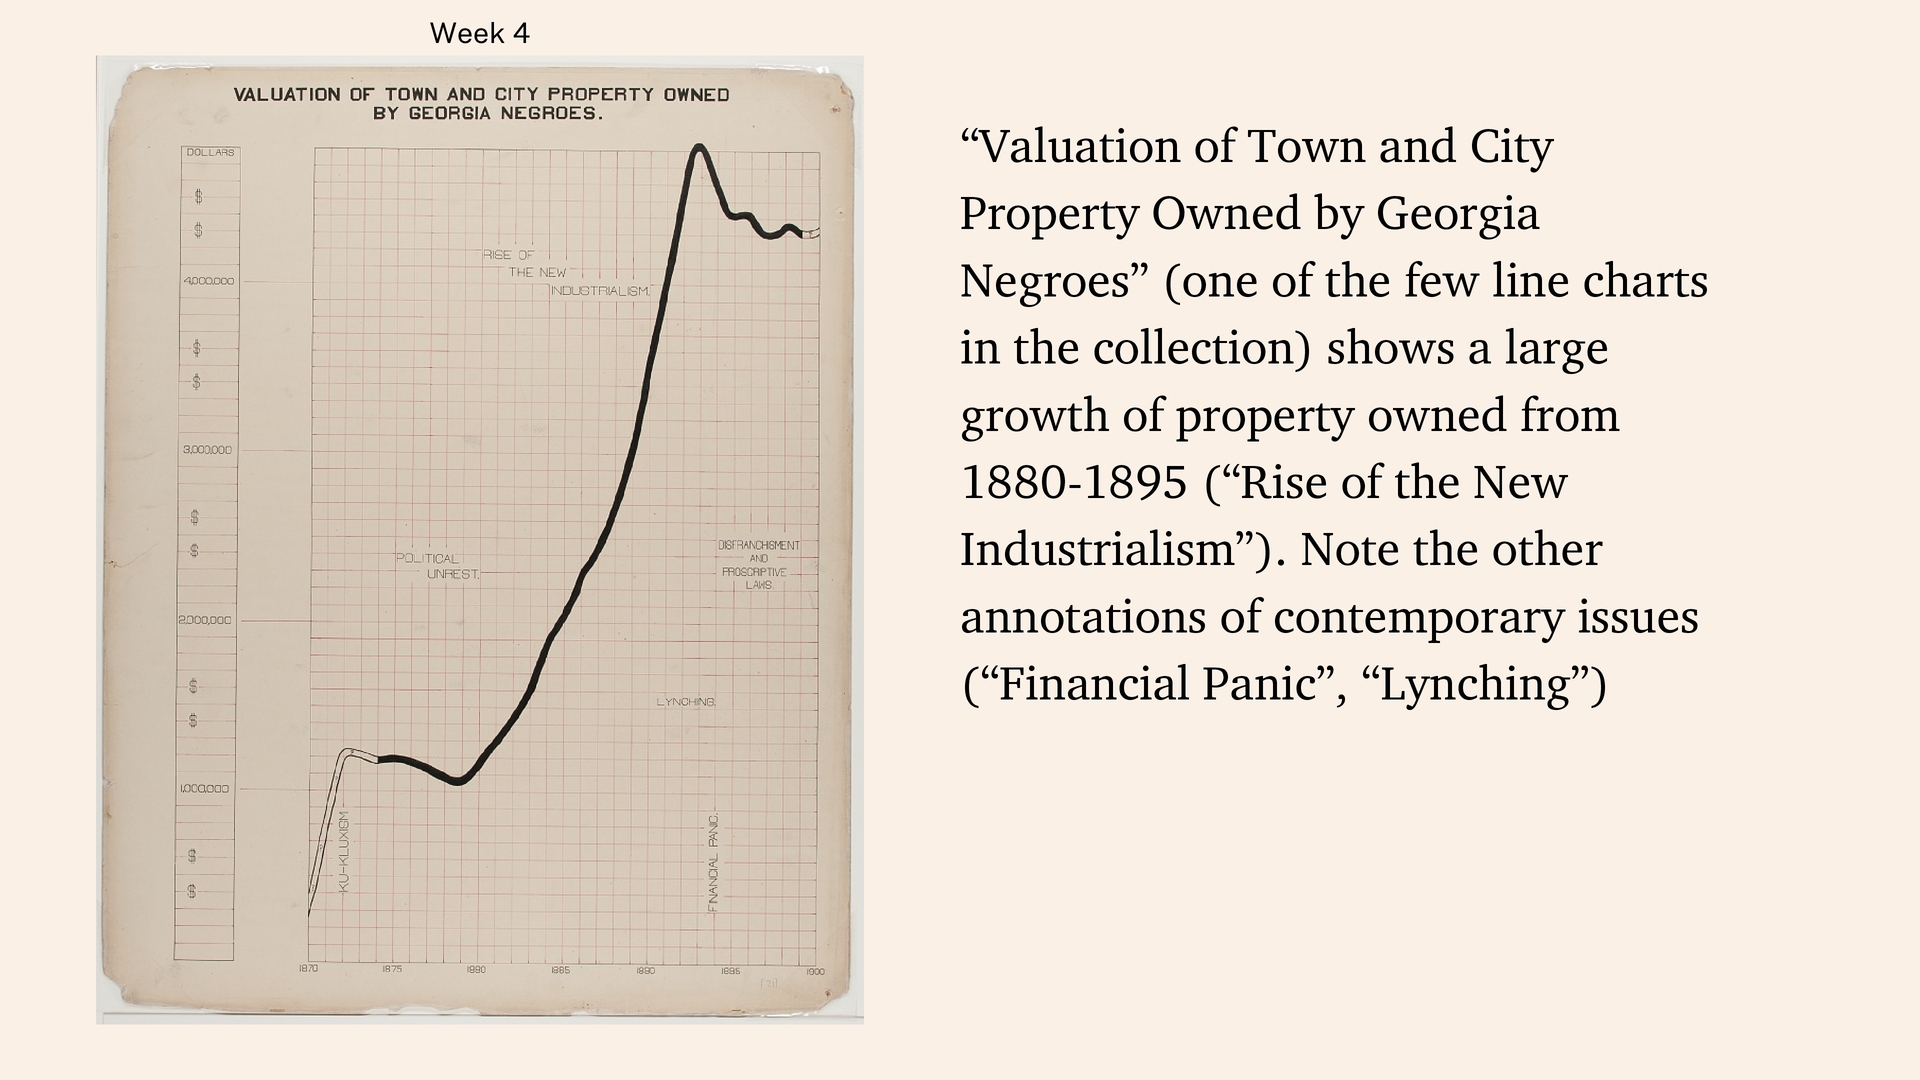
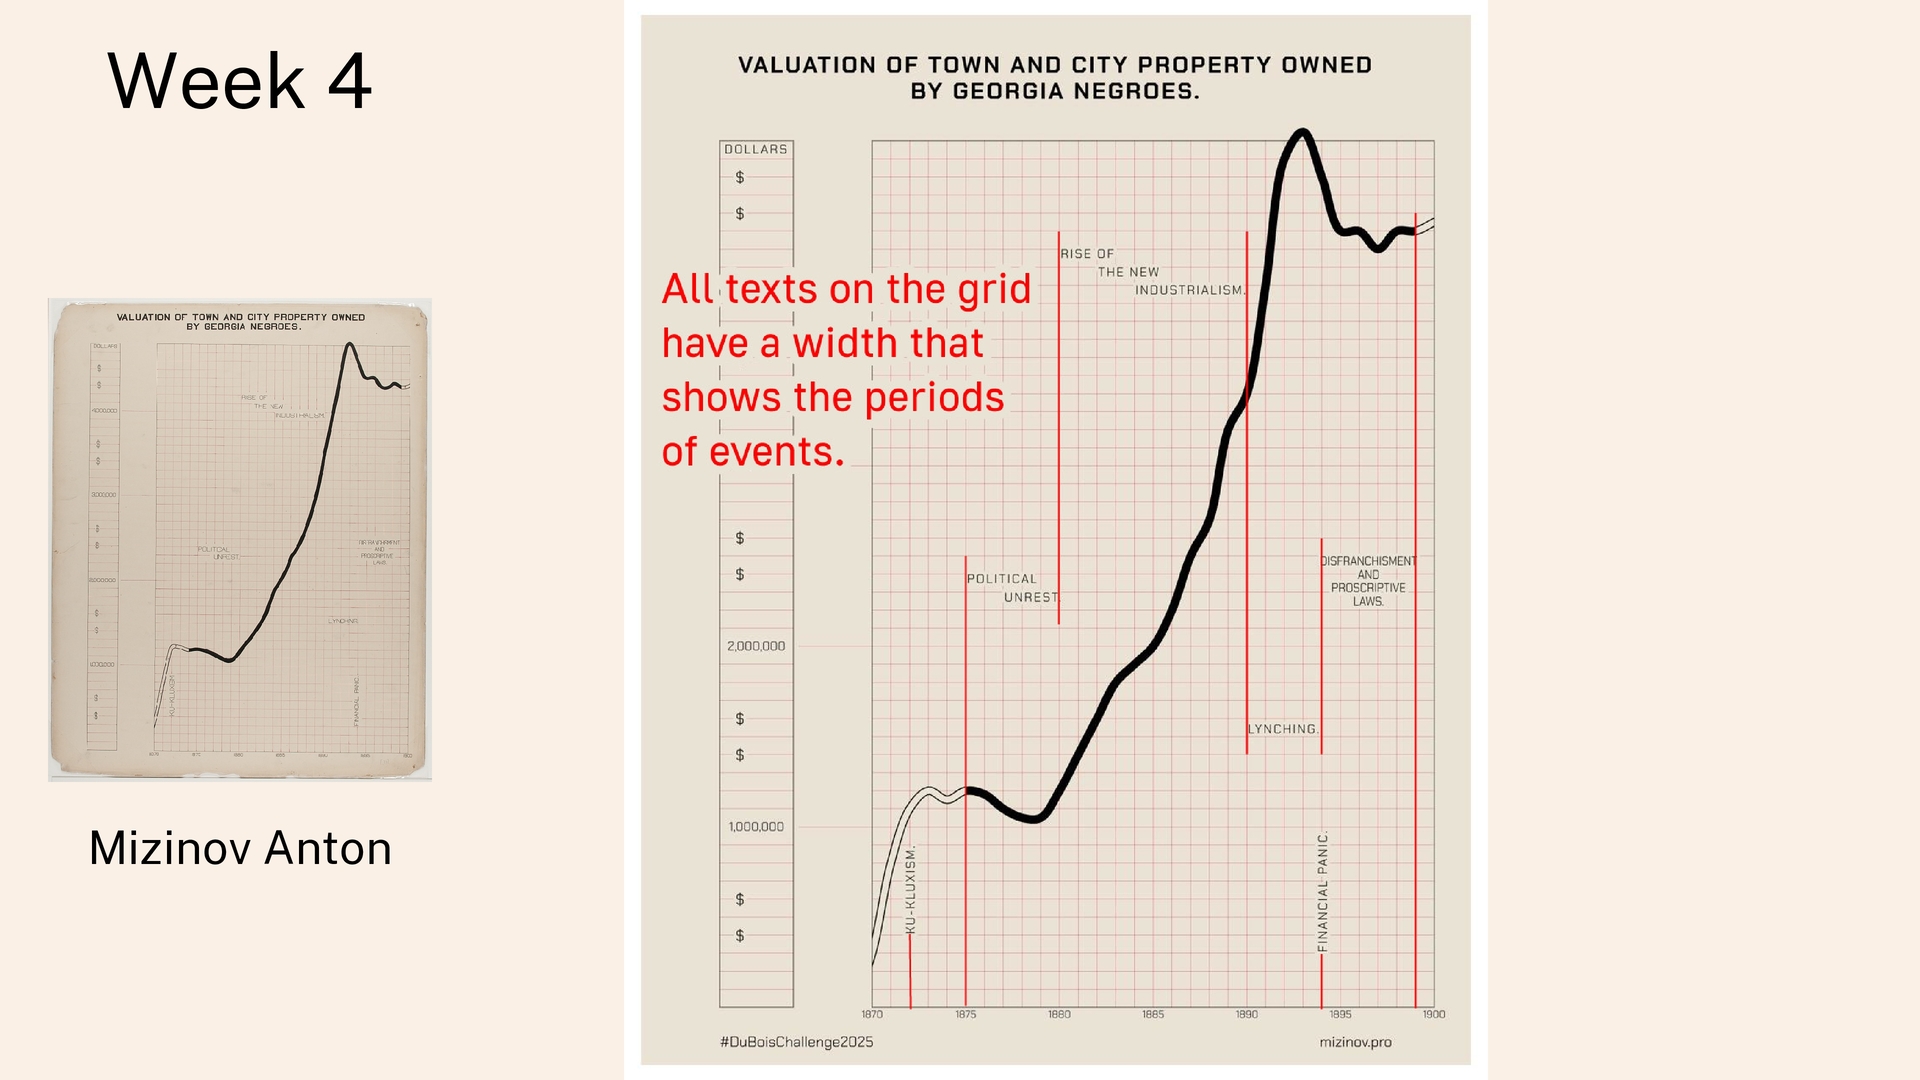
Georgia Negroes” (one of the few line charts in the collection) shows a large growth of property owned from 1880-1895 (“Rise of the New Industrialism”). Note the other annotations of contemporary issues (“Financial Panic”, “Lynching”)
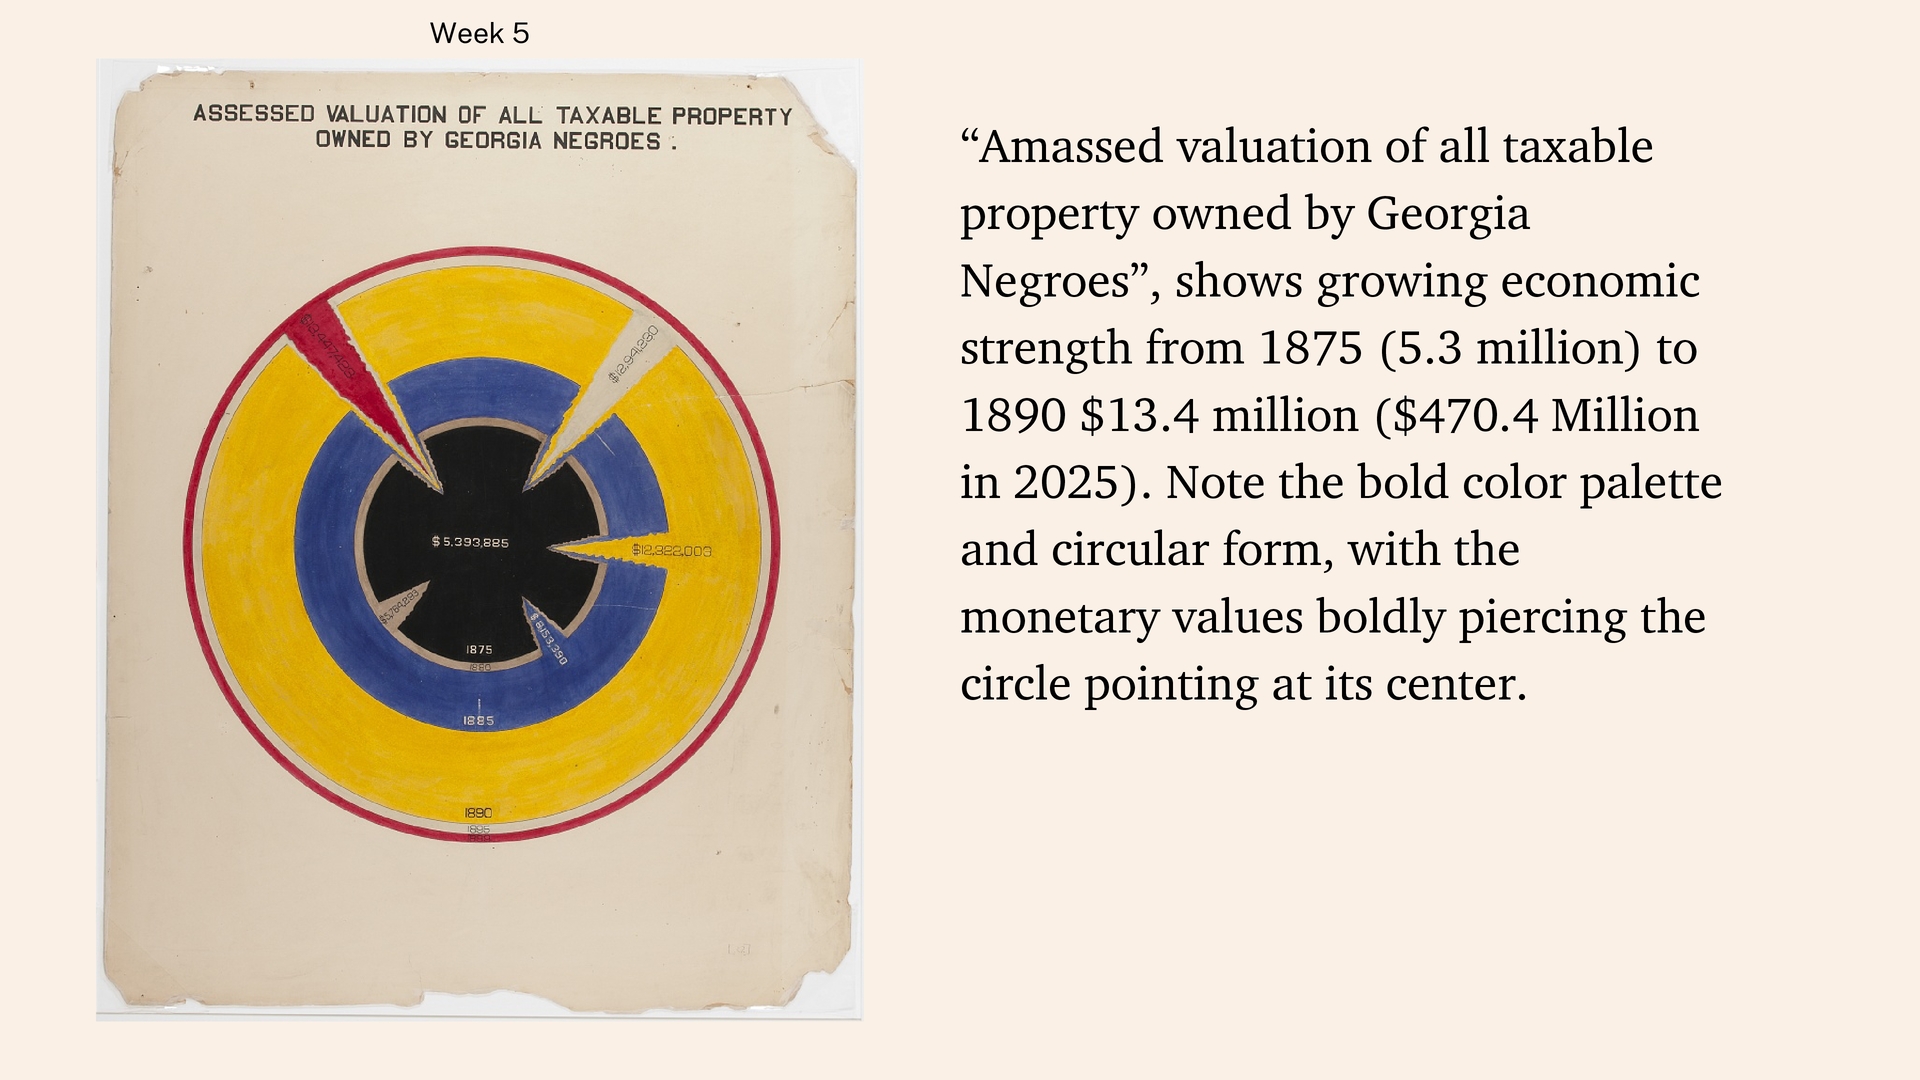
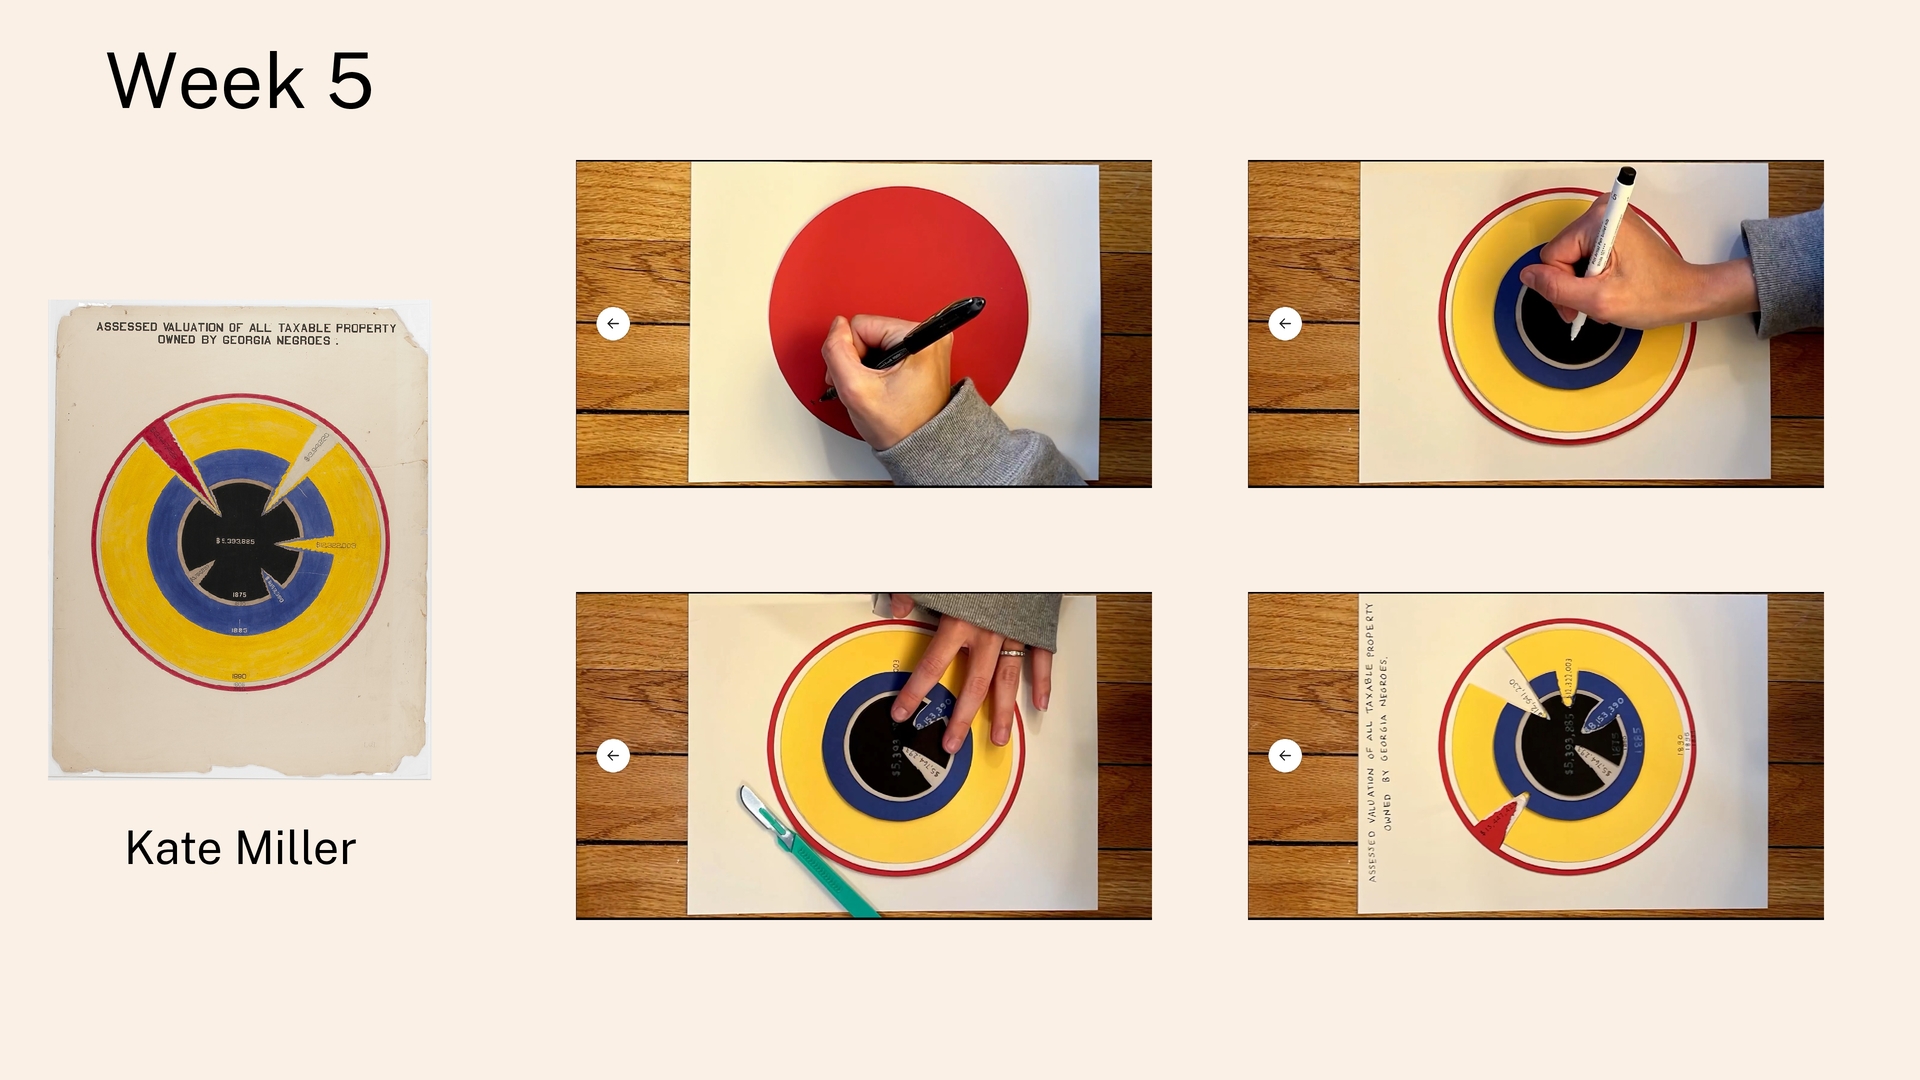
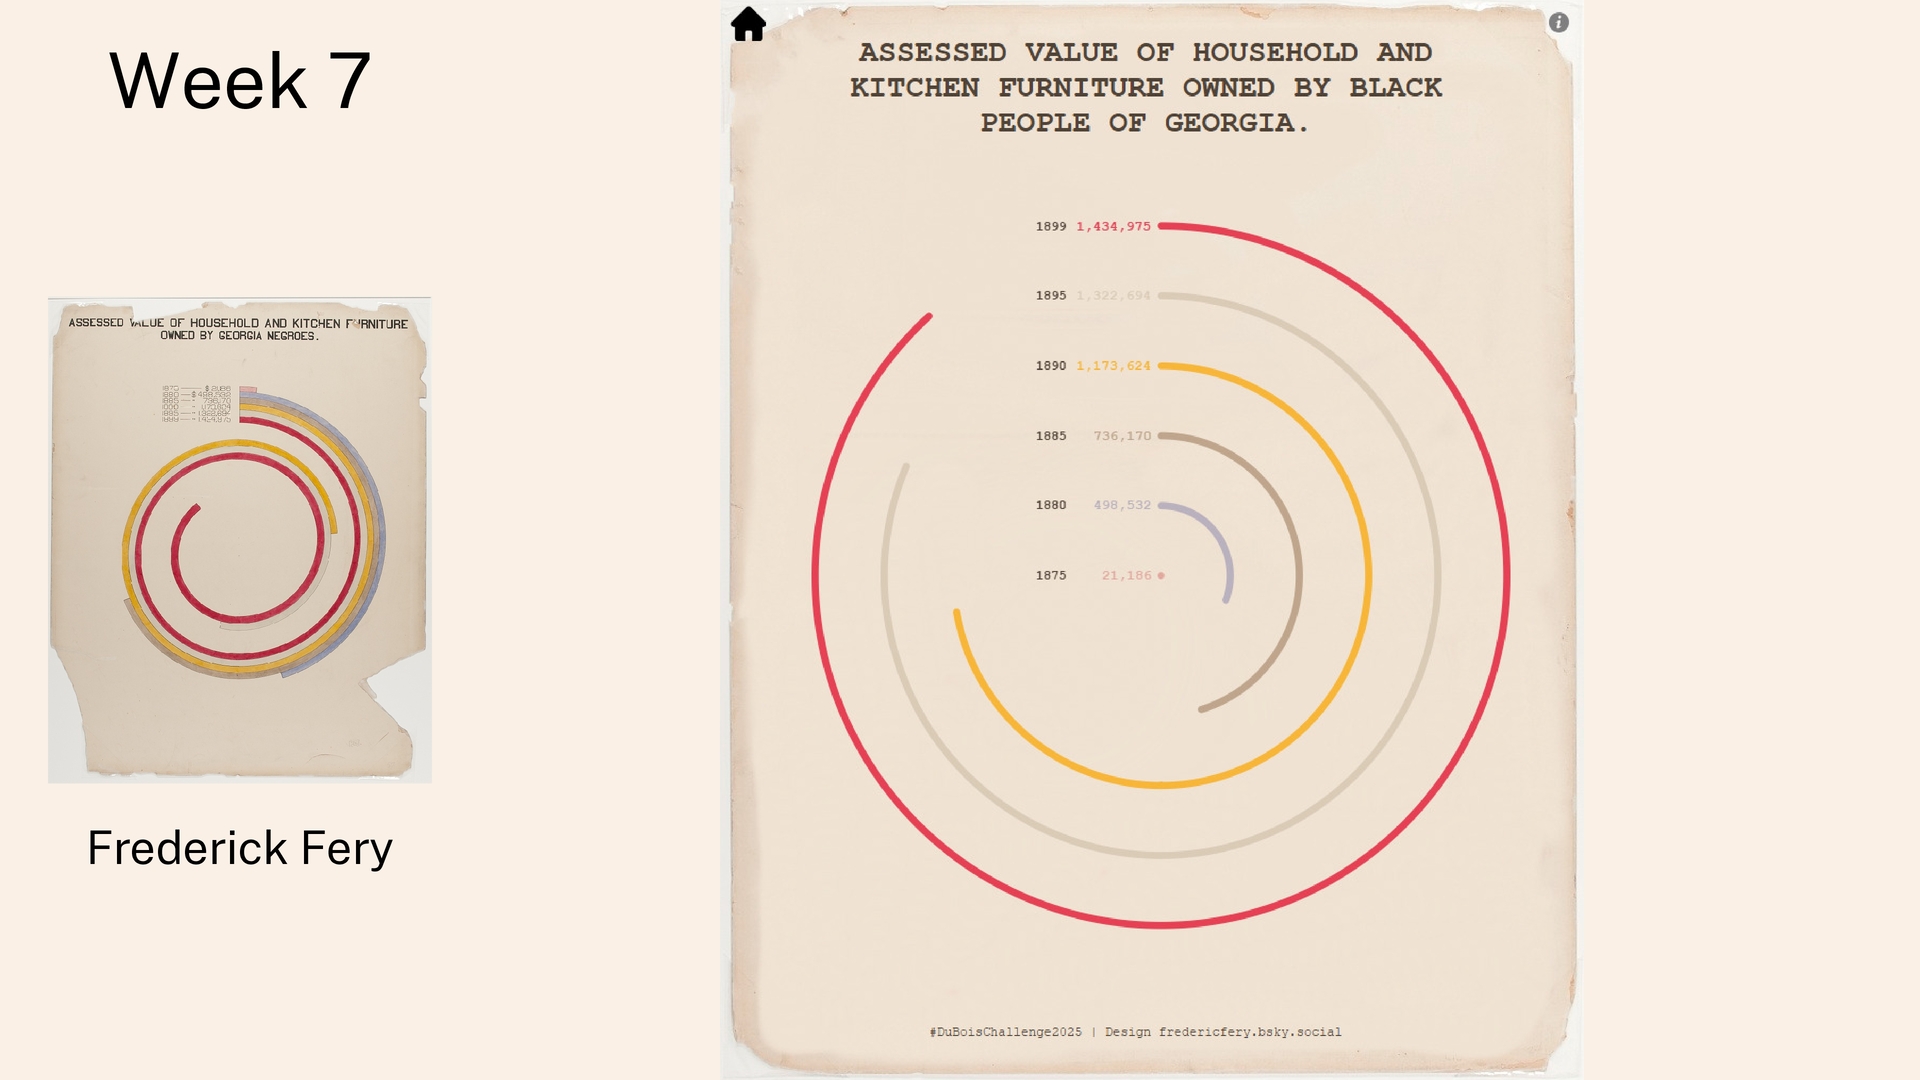
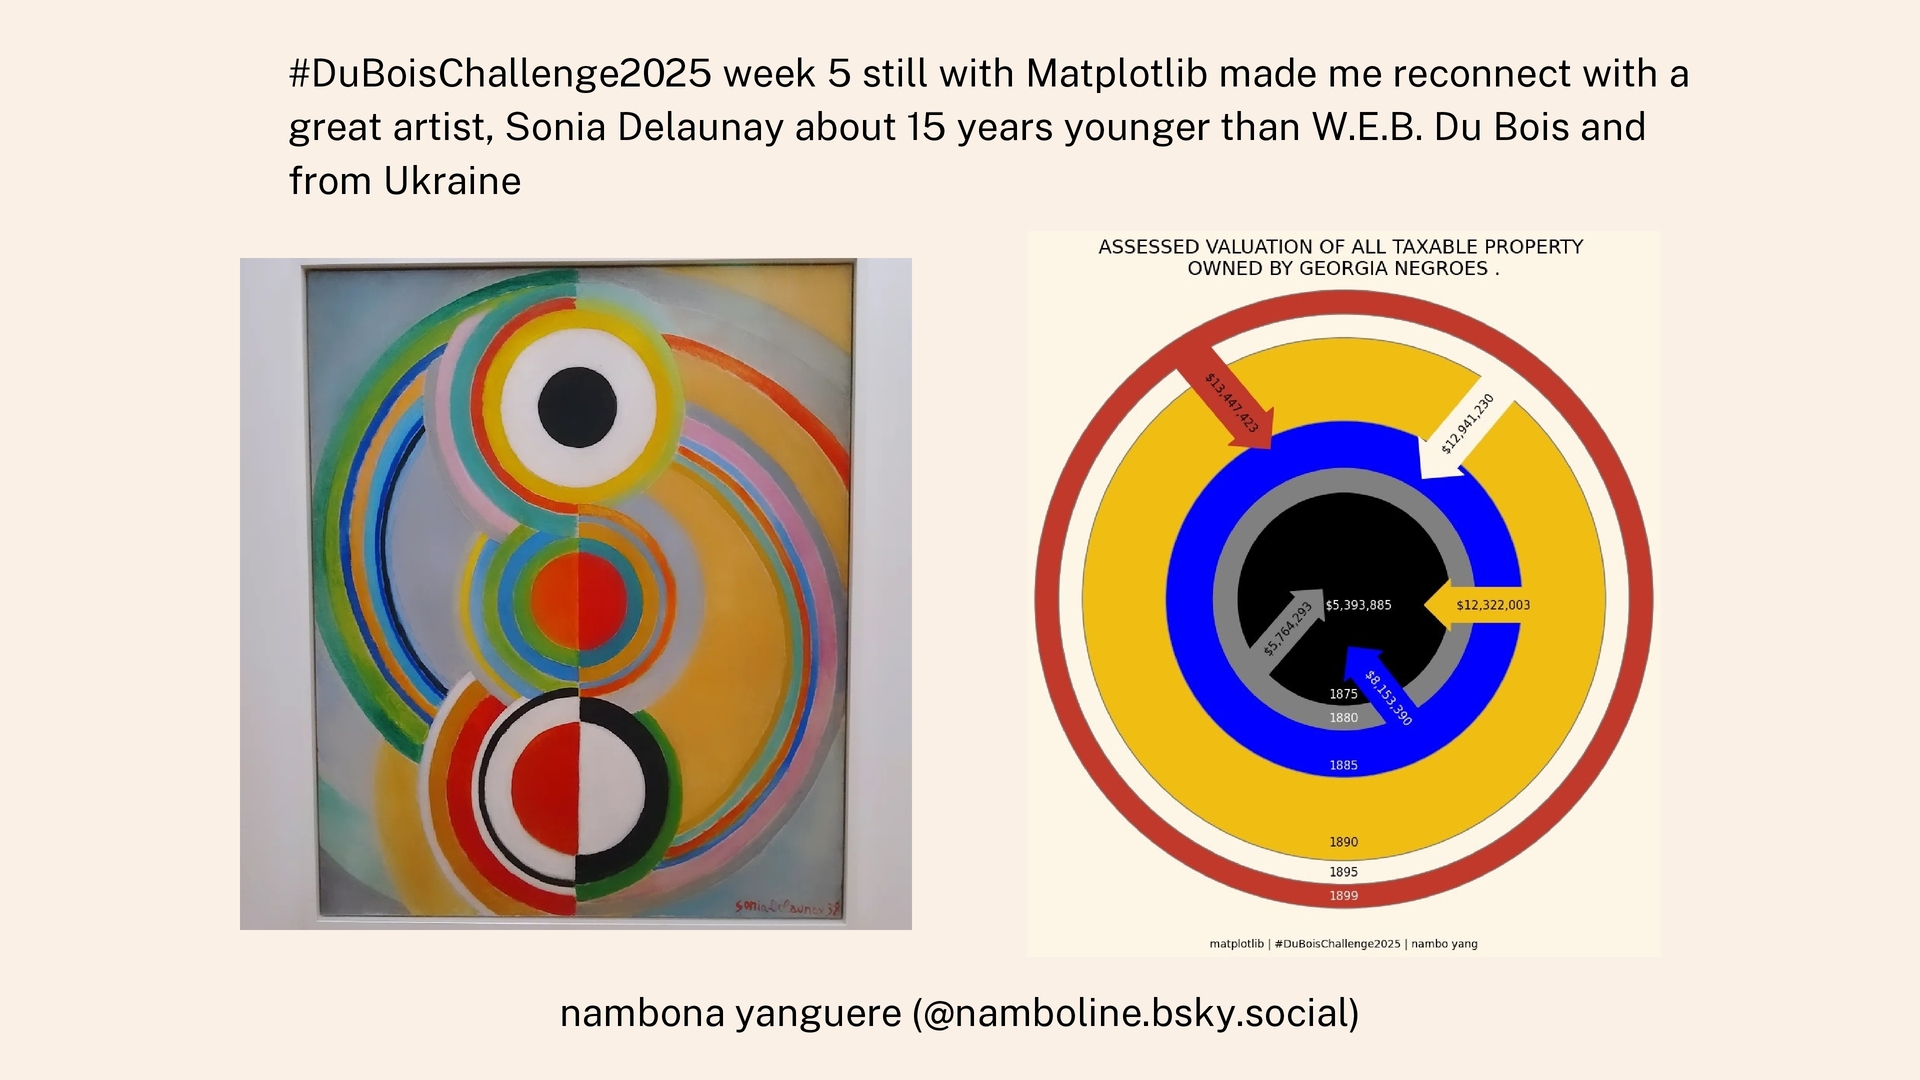
Georgia Negroes”, shows growing economic strength from 1875 (5.3 million) to 1890 $13.4 million ($470.4 Million in 2025). Note the bold color palette and circular form, with the monetary values boldly piercing the circle pointing at its center.
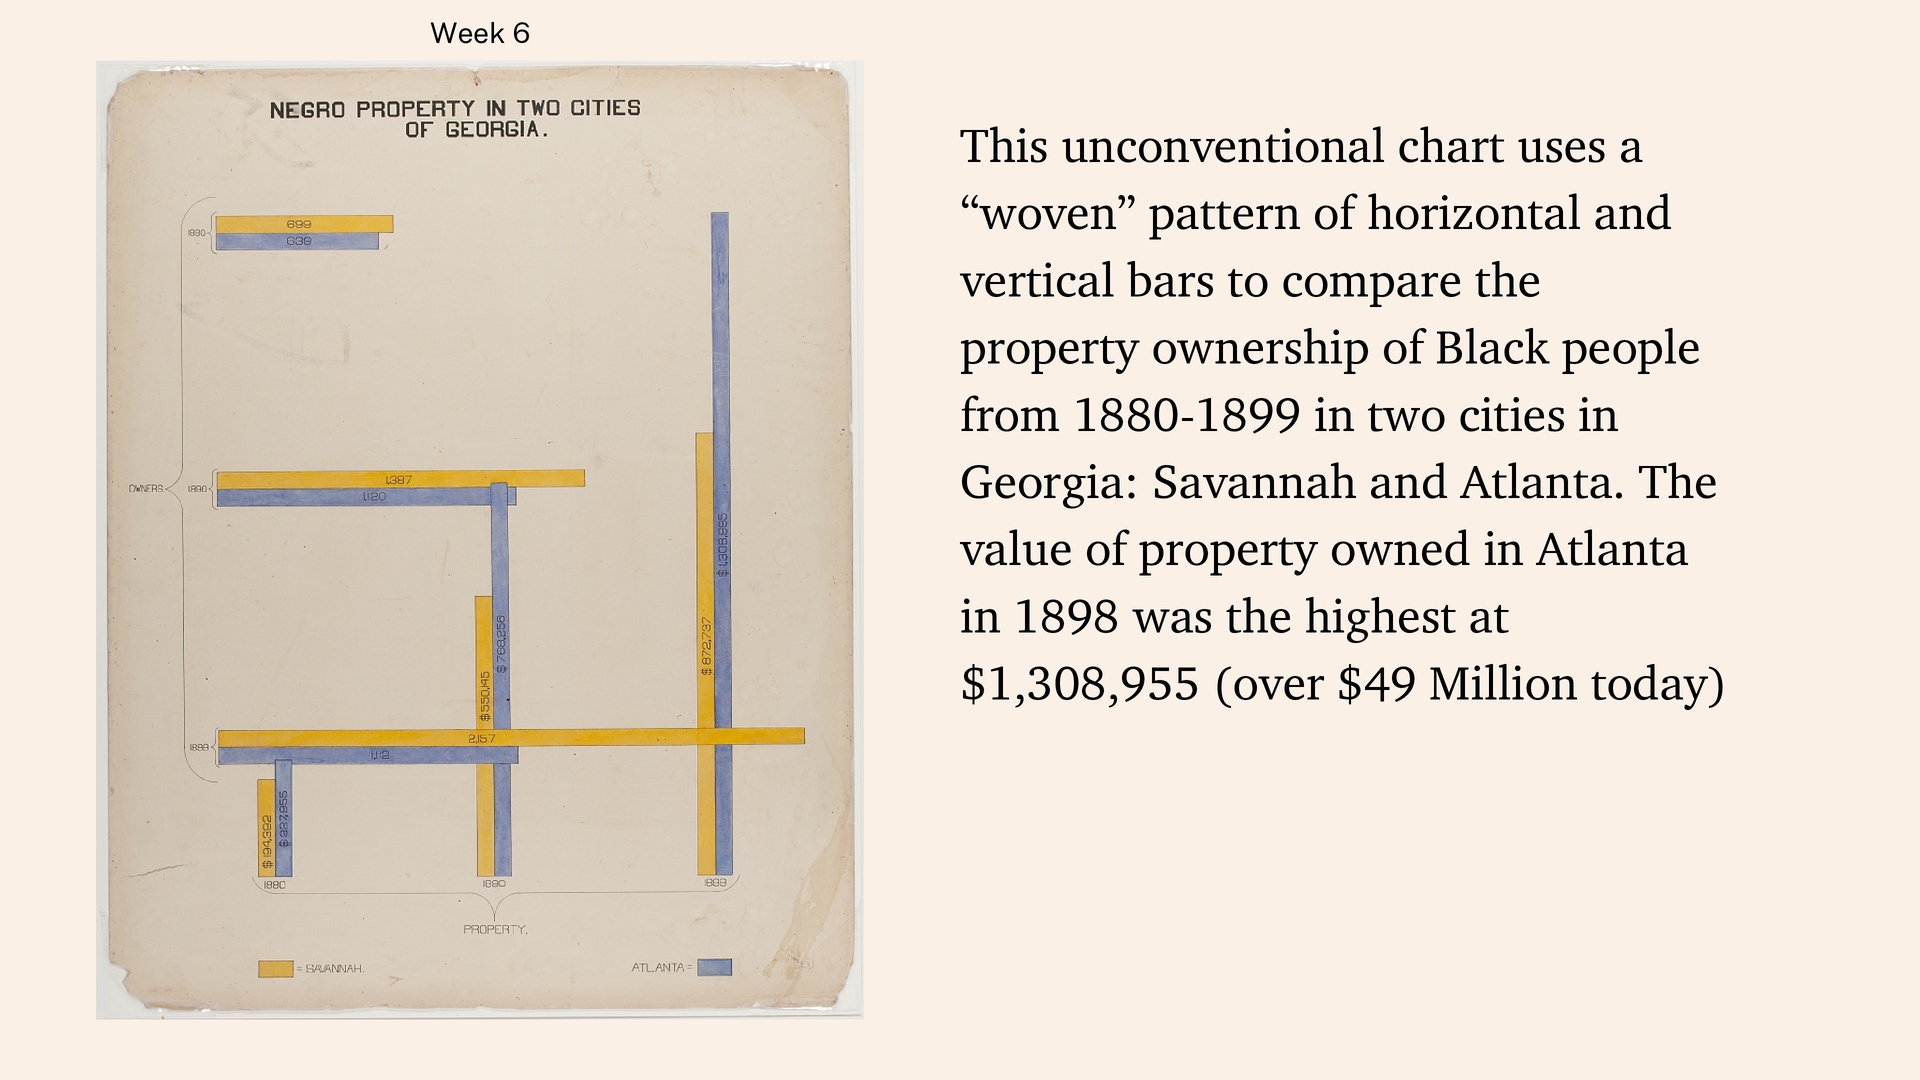
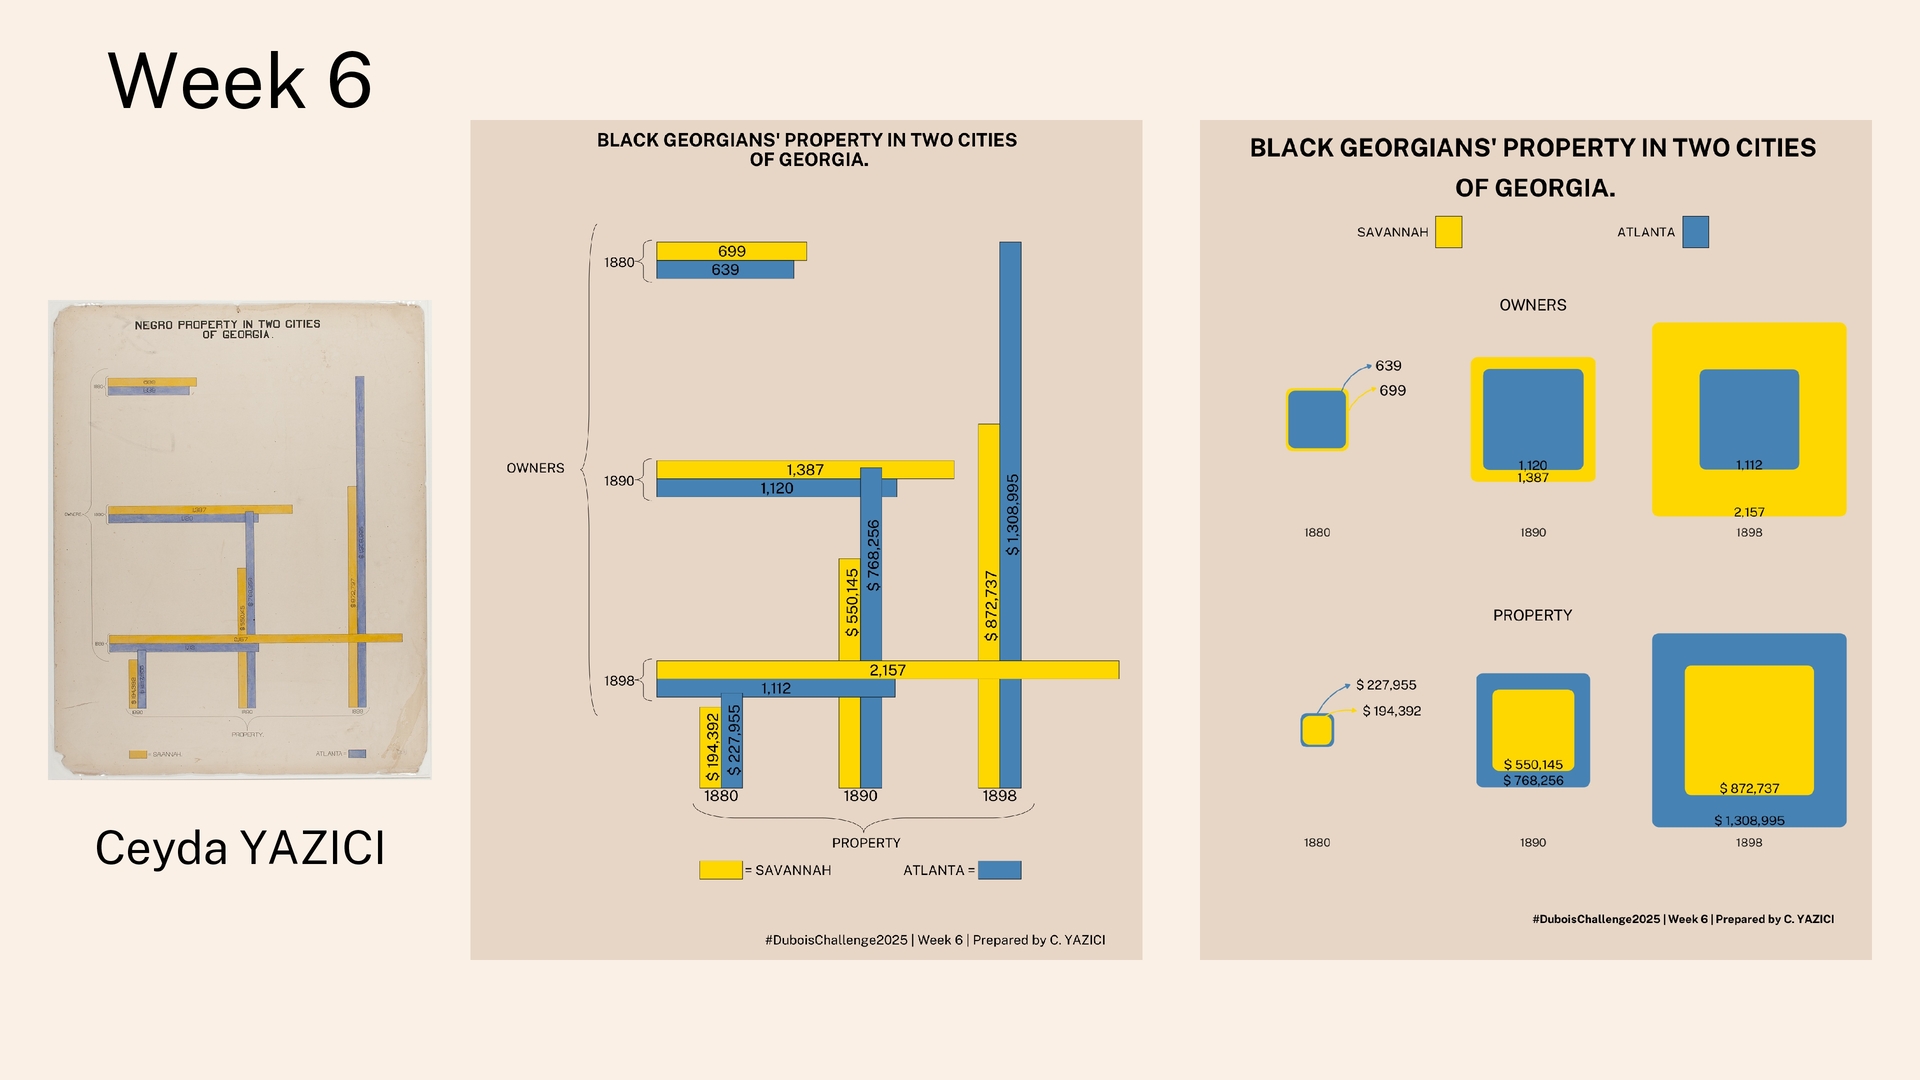
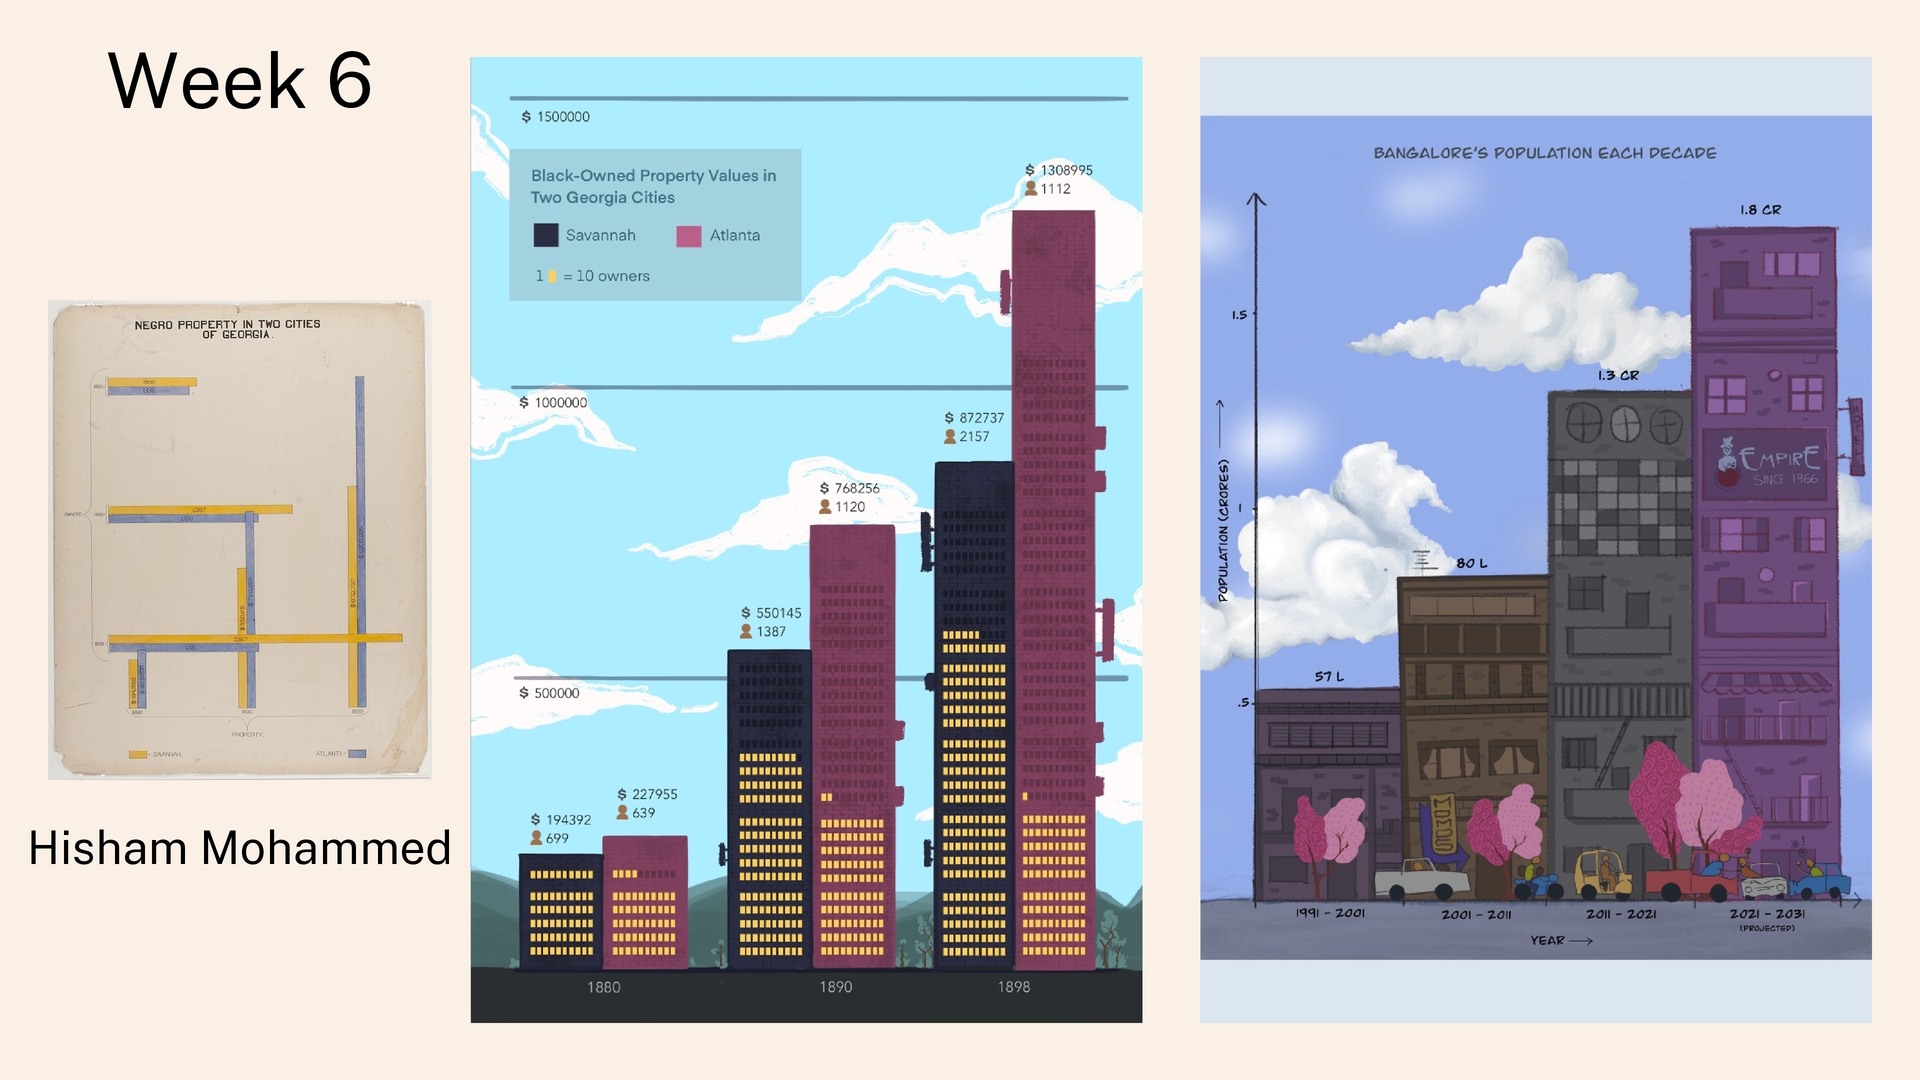
horizontal and vertical bars to compare the property ownership of Black people from 1880-1899 in two cities in Georgia: Savannah and Atlanta. The value of property owned in Atlanta in 1898 was the highest at $1,308,955 (over $49 Million today)
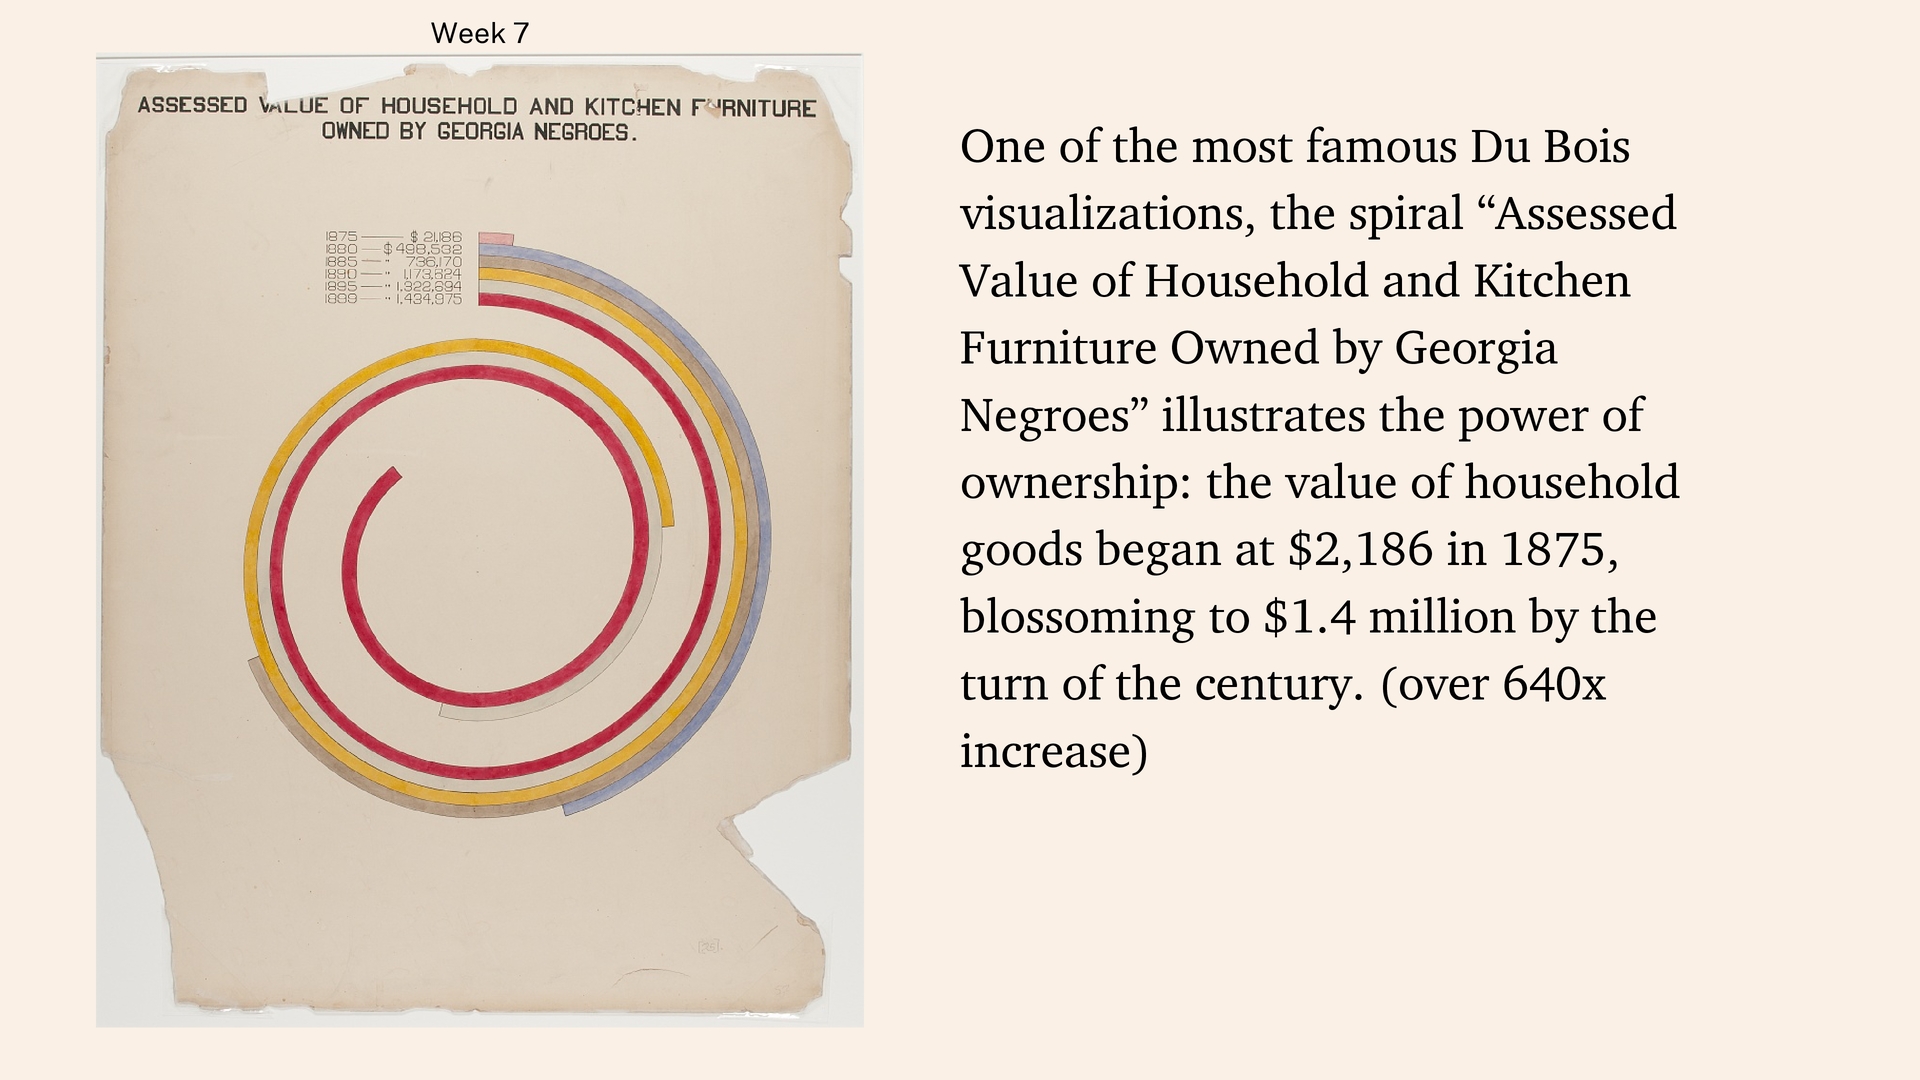
the spiral “Assessed Value of Household and Kitchen Furniture Owned by Georgia Negroes” illustrates the power of ownership: the value of household goods began at $2,186 in 1875, blossoming to $1.4 million by the turn of the century. (over 640x increase)
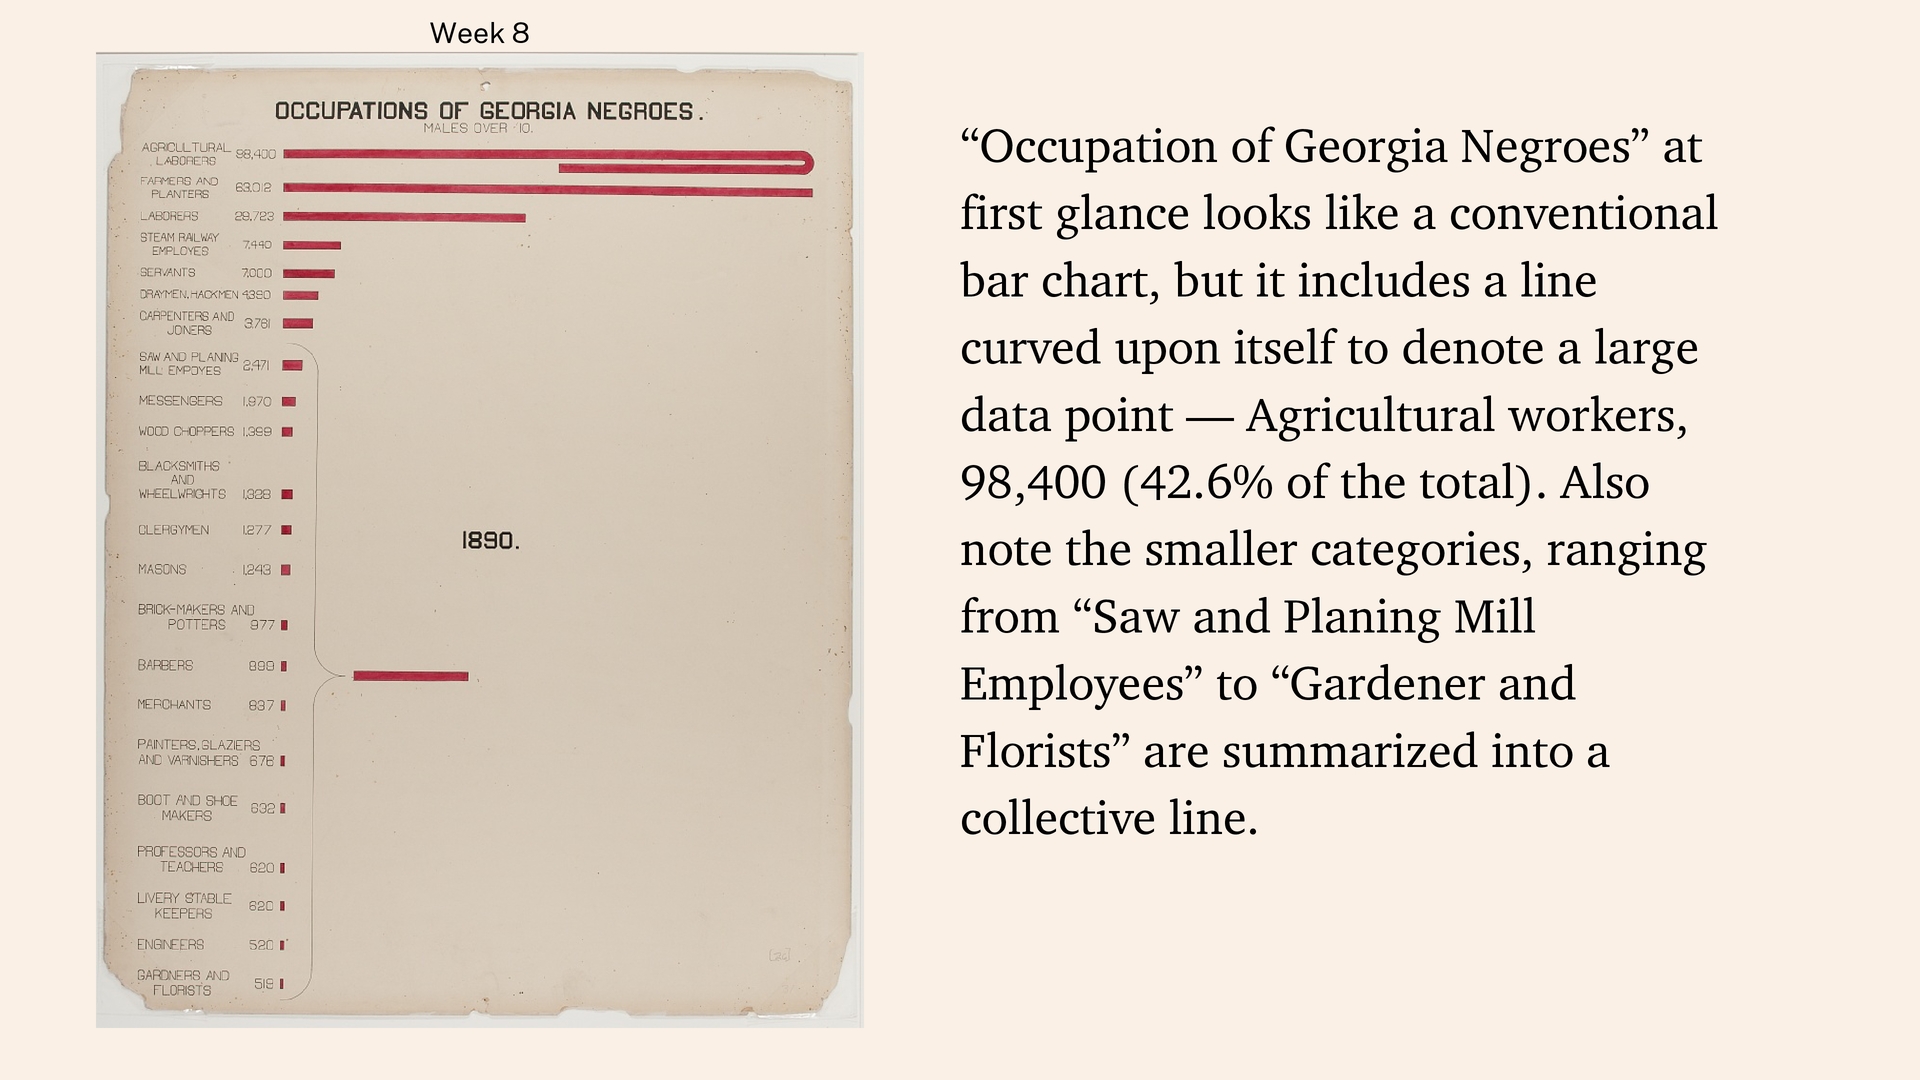
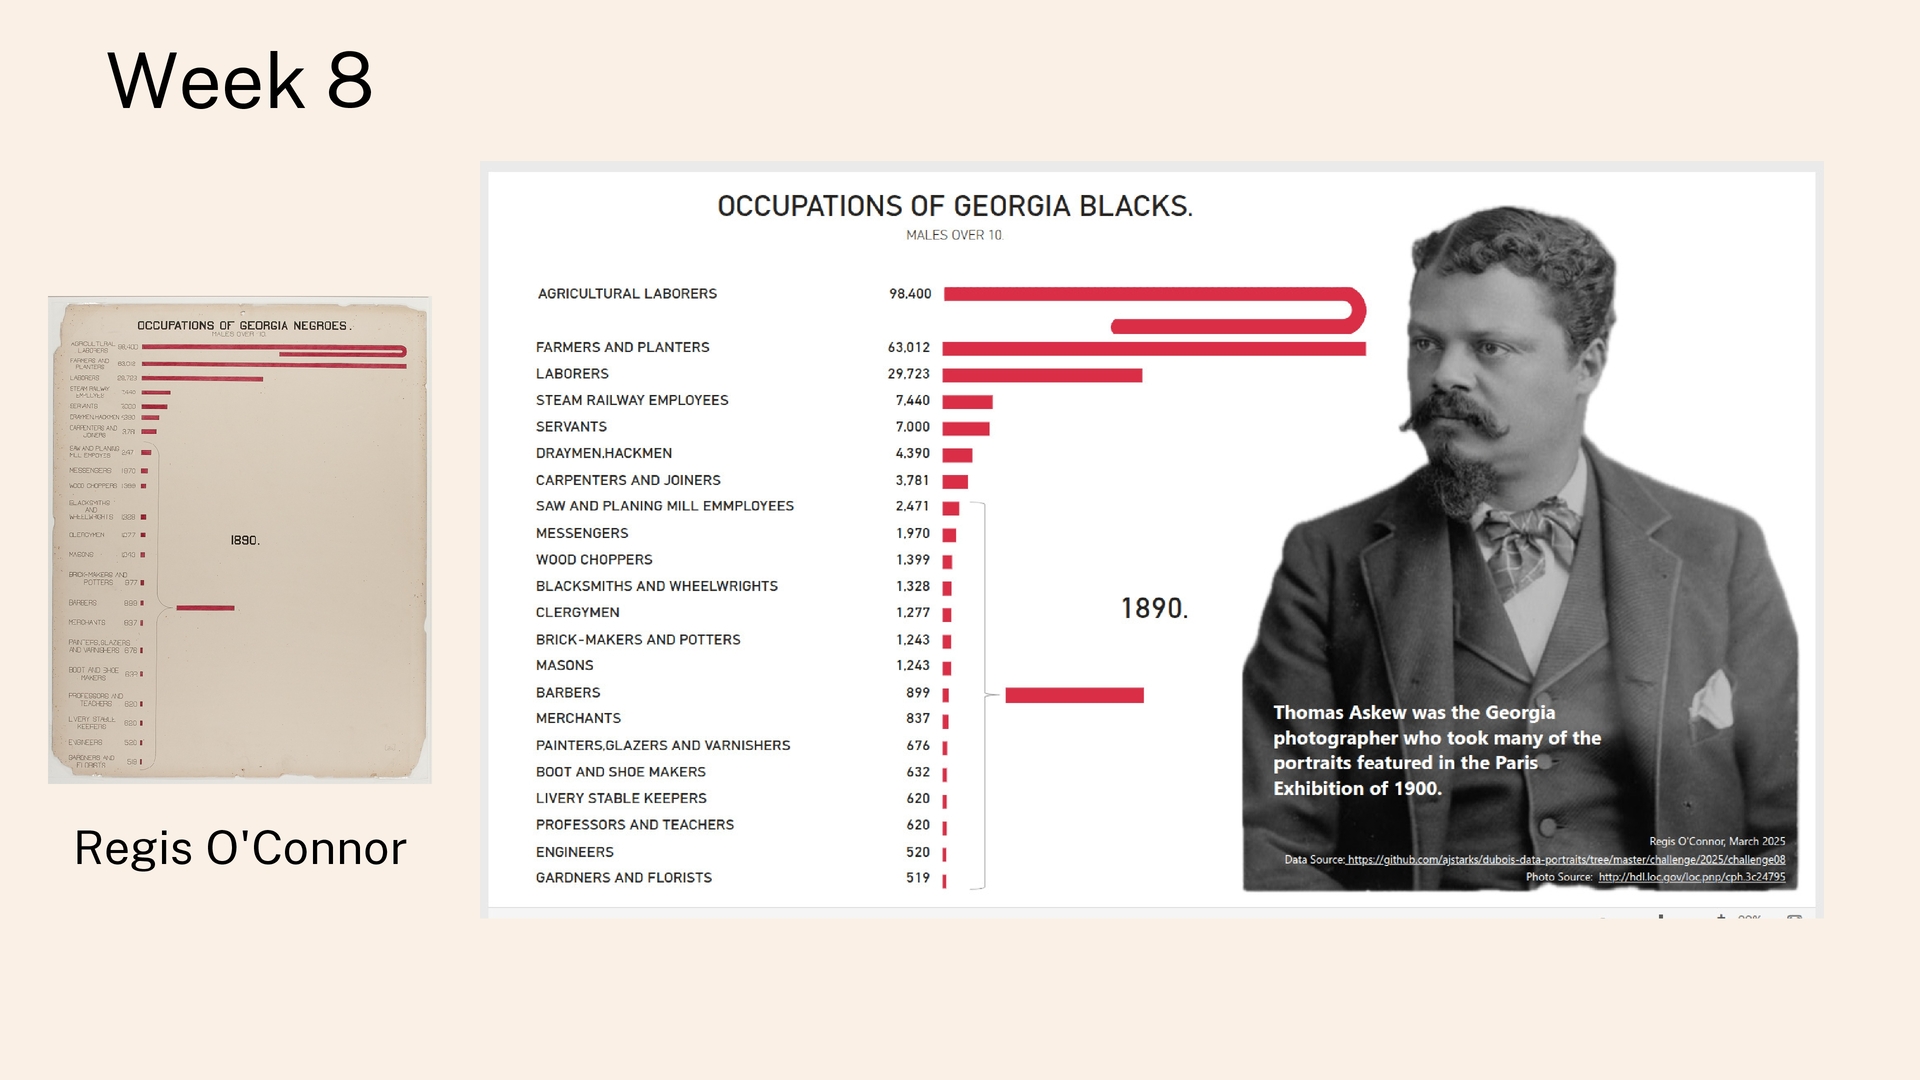
like a conventional bar chart, but it includes a line curved upon itself to denote a large data point — Agricultural workers, 98,400 (42.6% of the total). Also note the smaller categories, ranging from “Saw and Planing Mill Employees” to “Gardener and Florists” are summarized into a collective line.
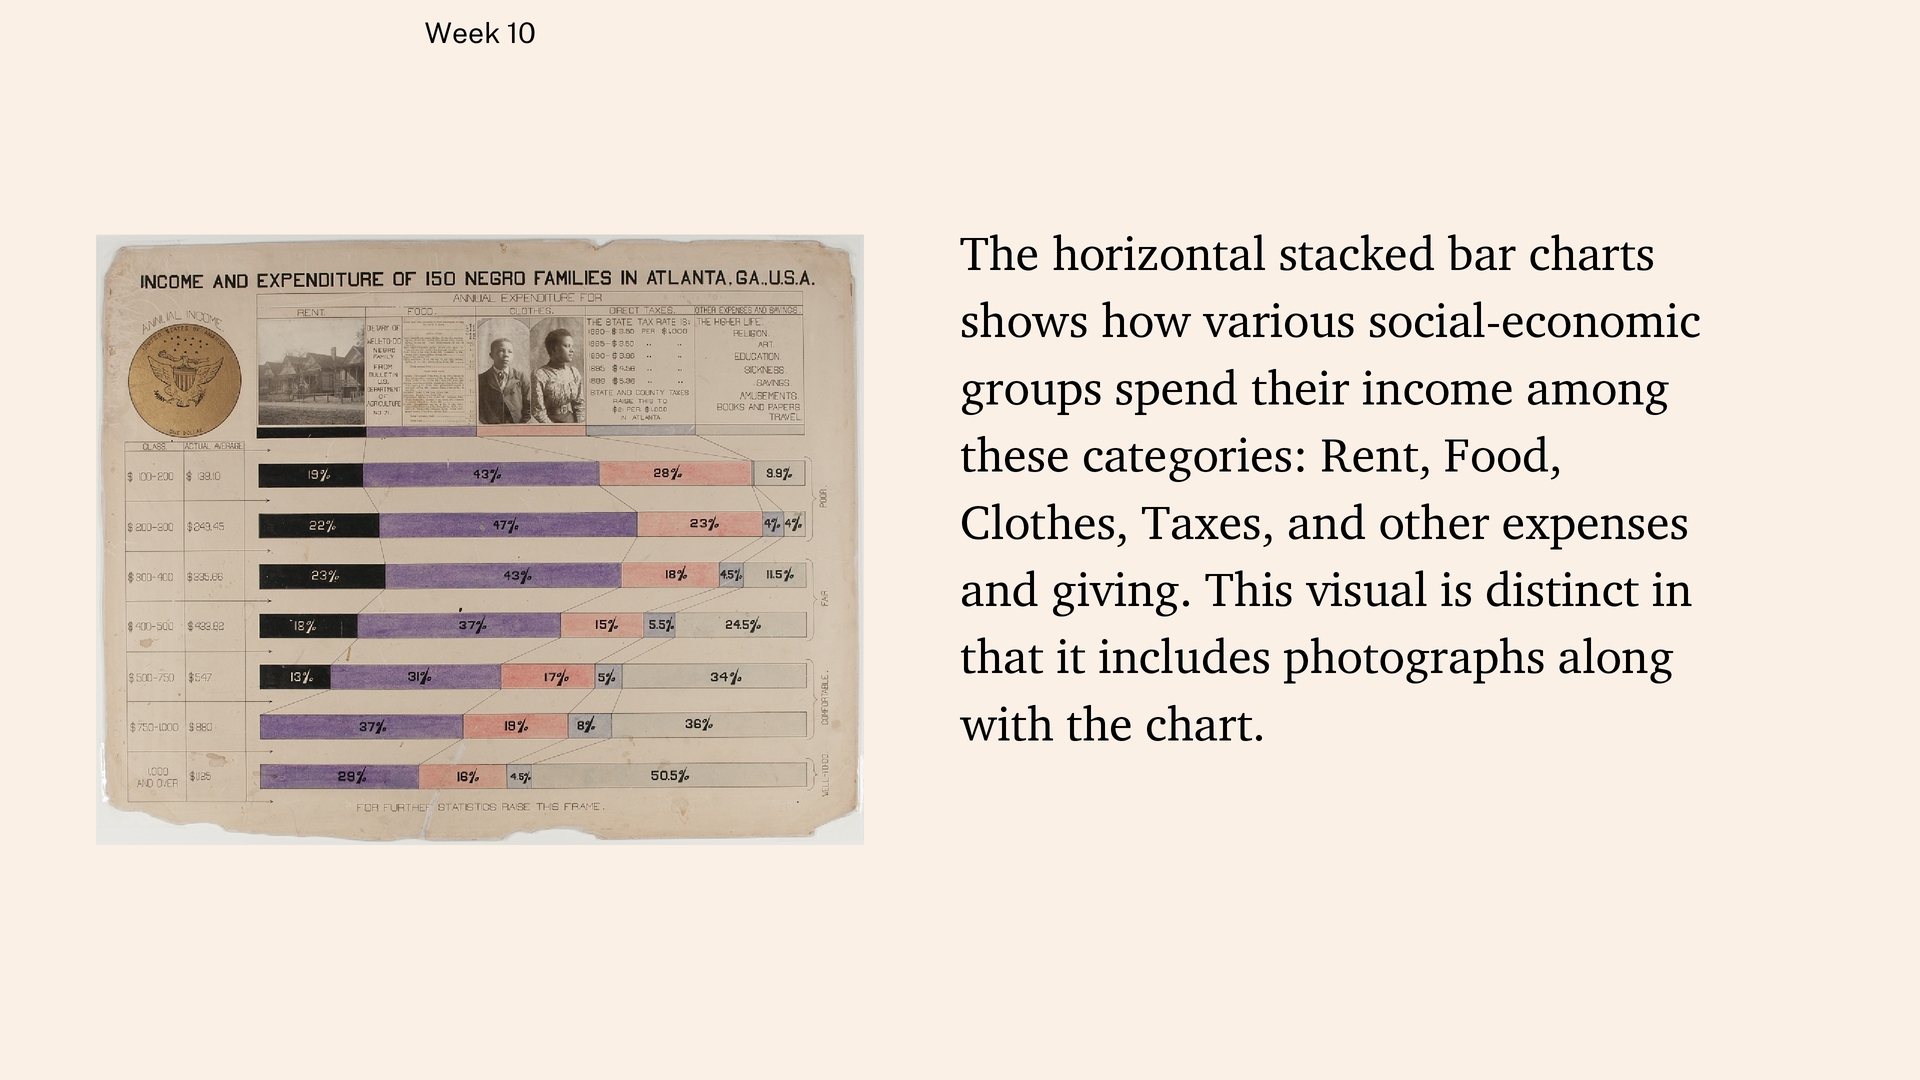
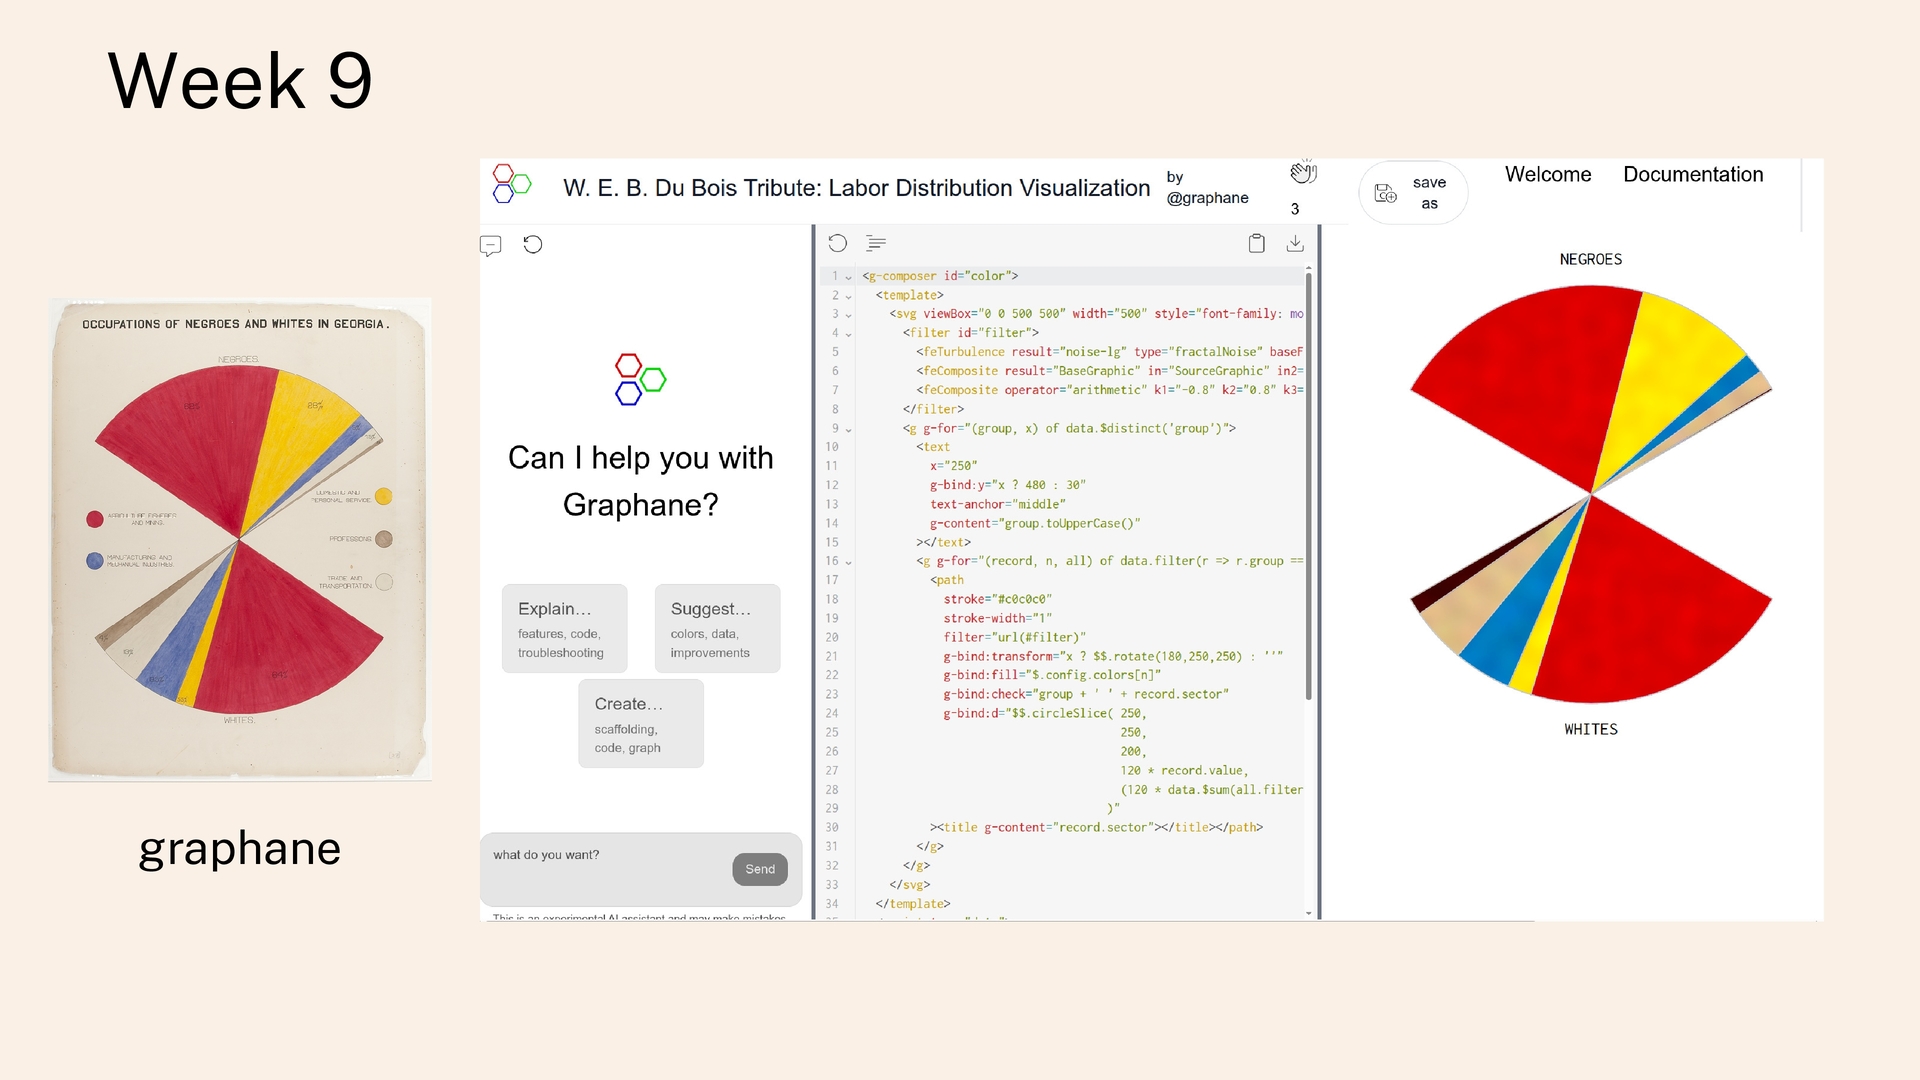
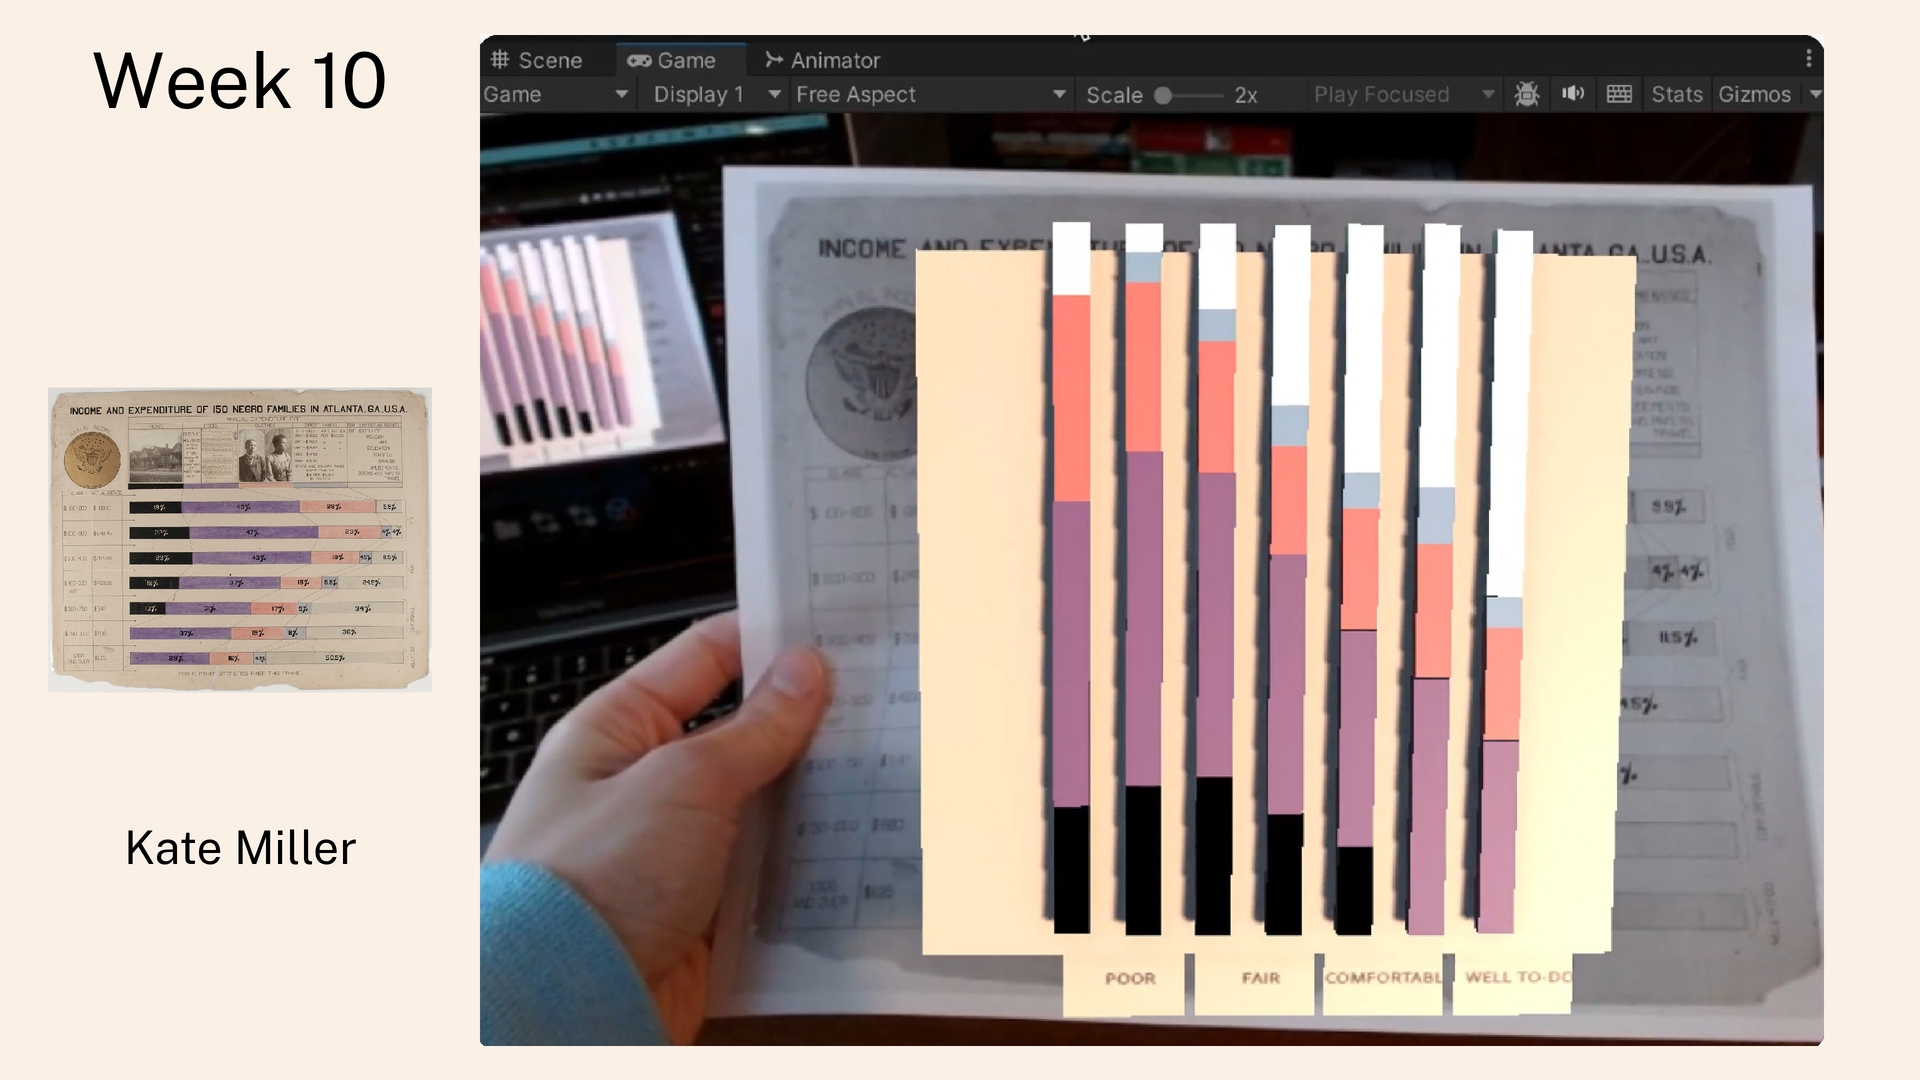
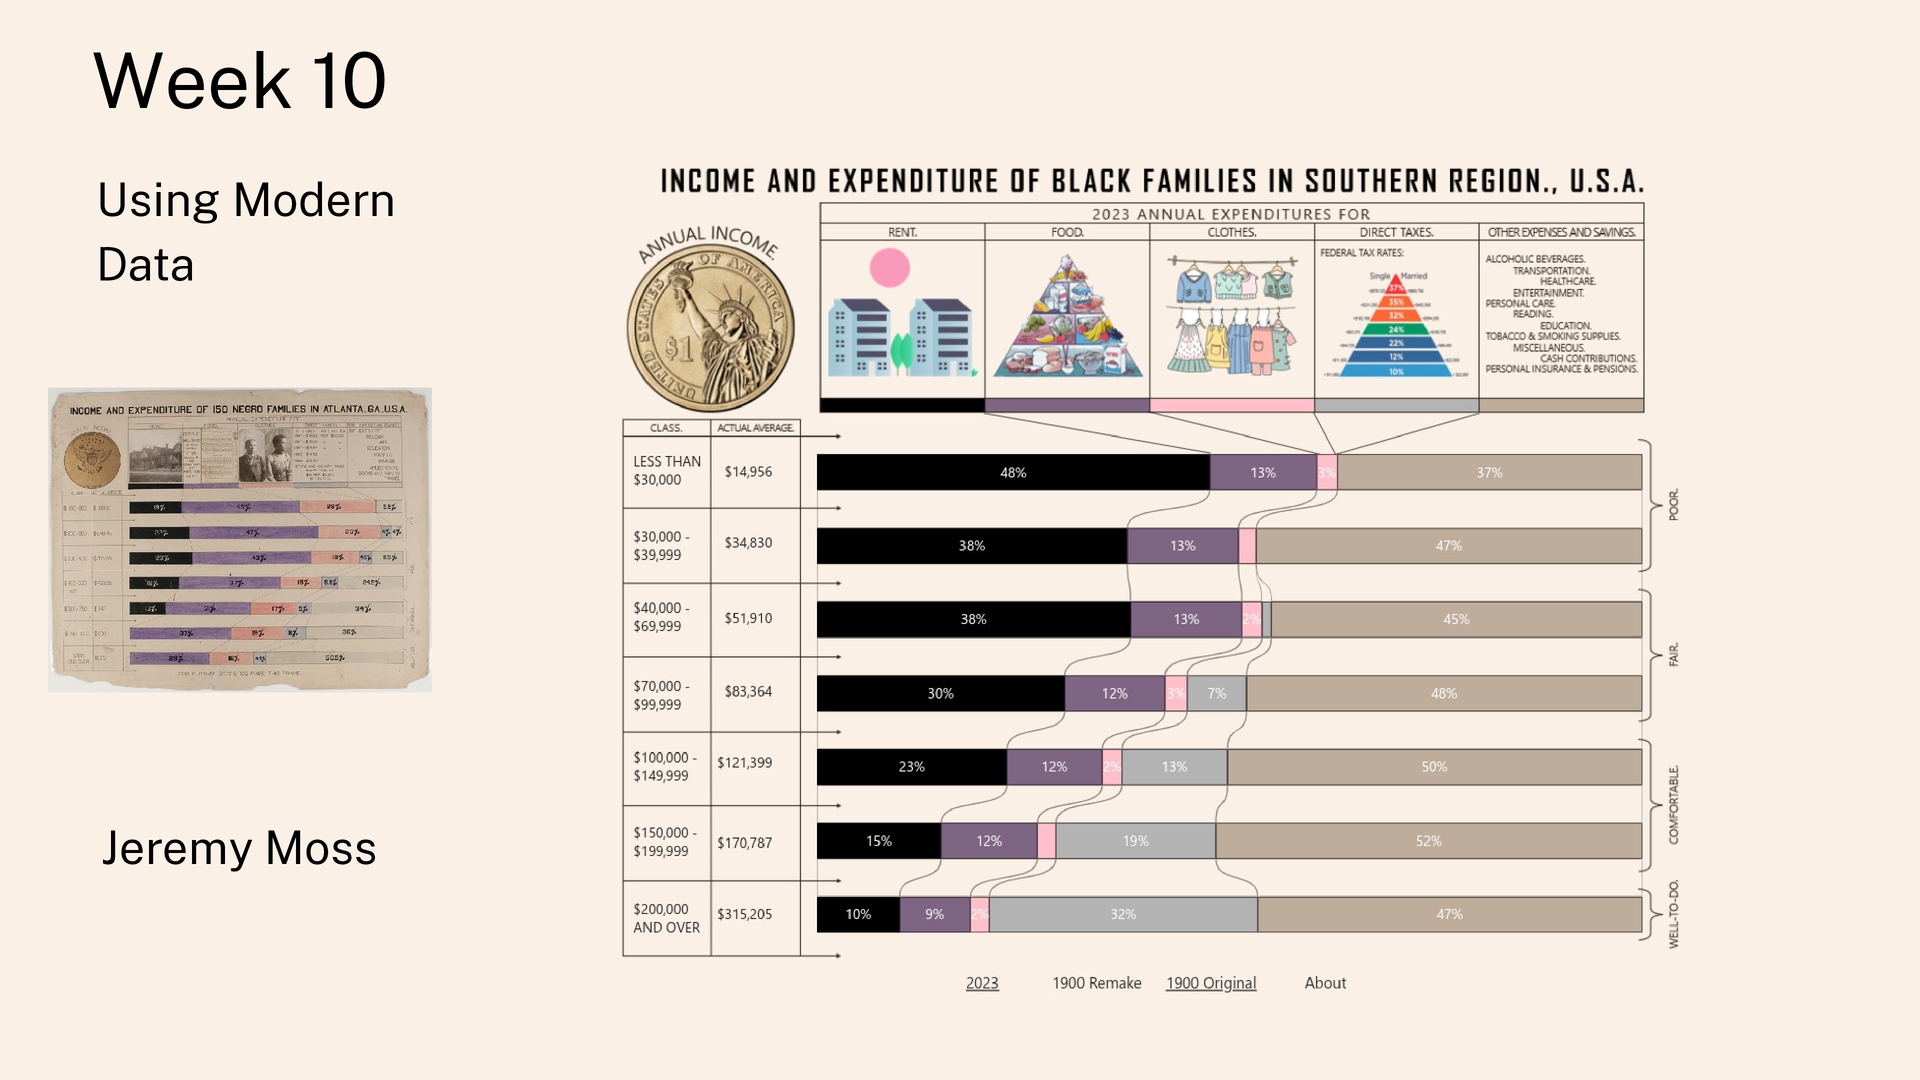
social-economic groups spend their income among these categories: Rent, Food, Clothes, Taxes, and other expenses and giving. This visual is distinct in that it includes photographs along with the chart.
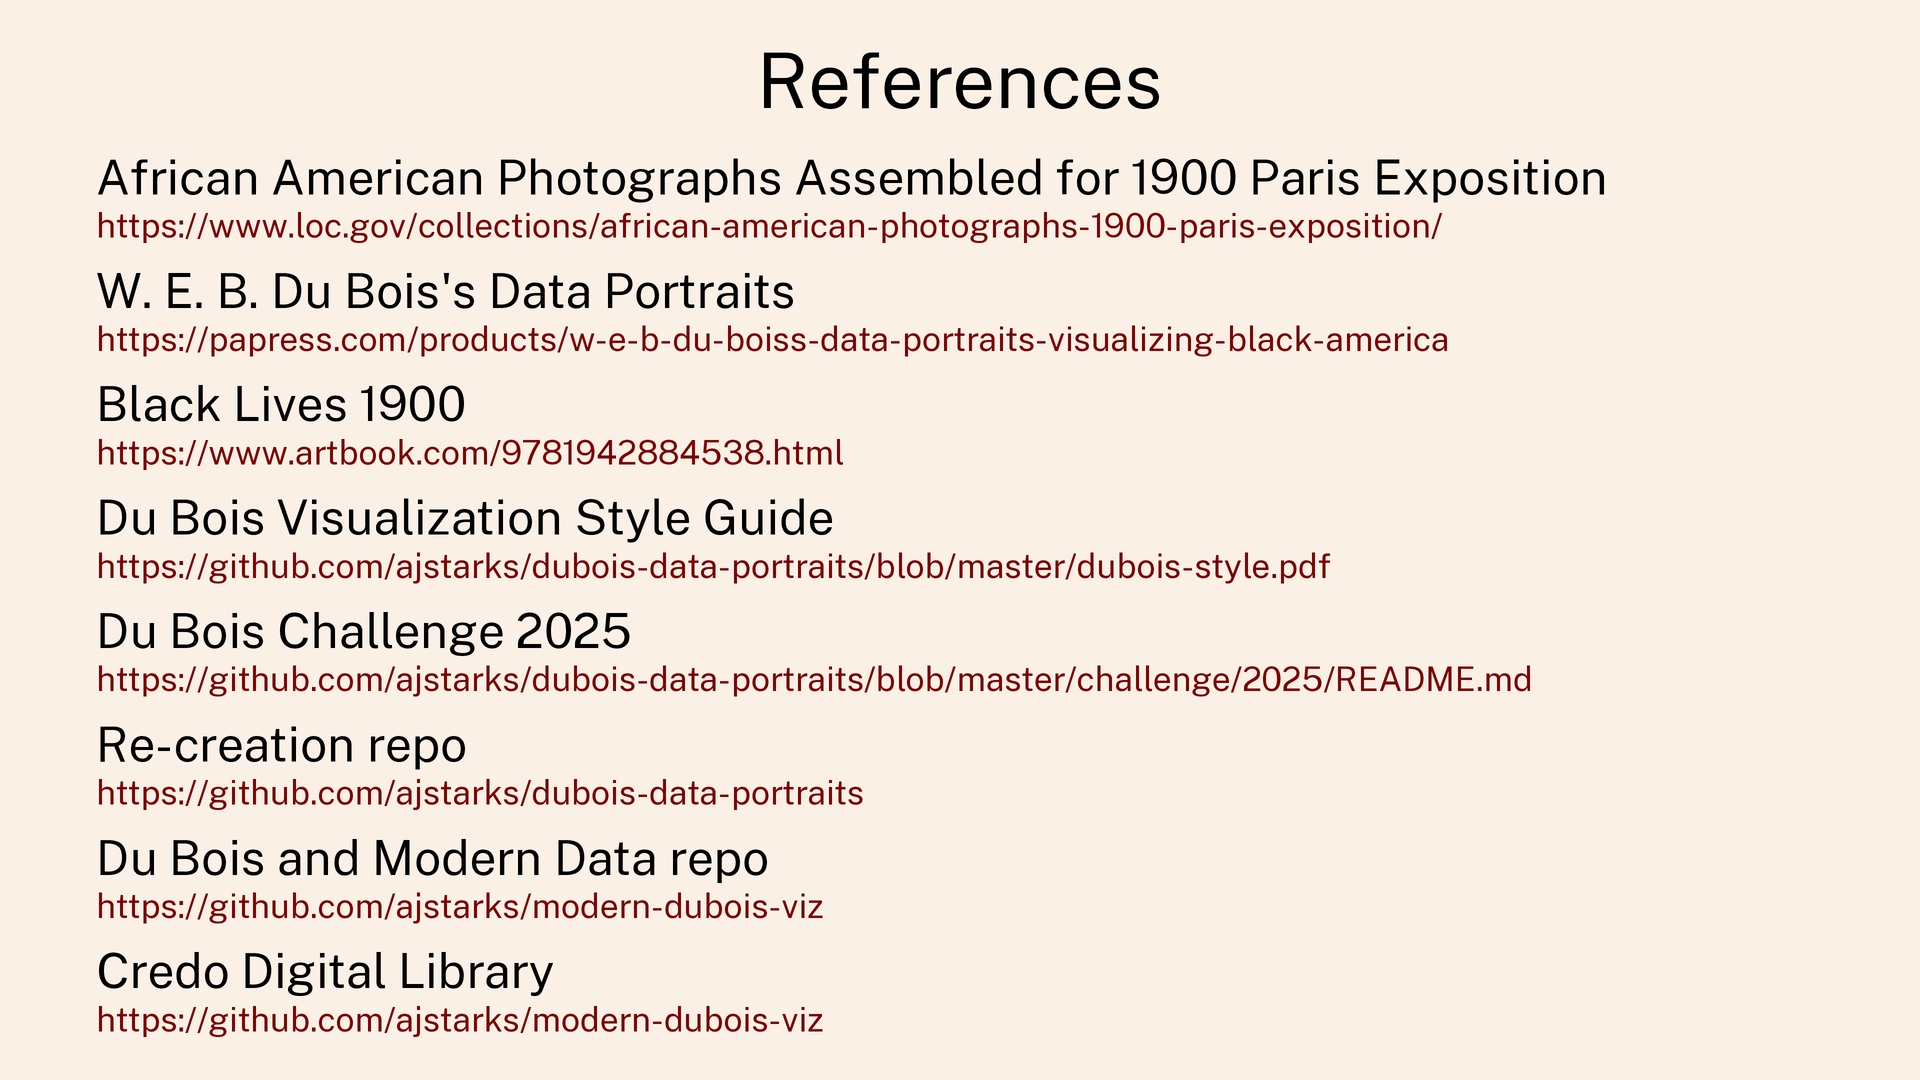
E. B. Du Bois's Data Portraits Black Lives 1900 Du Bois Visualization Style Guide Du Bois Challenge 2025 Re-creation repo Du Bois and Modern Data repo Credo Digital Library https://www.loc.gov/collections/african-american-photographs-1900-paris-exposition/ https://papress.com/products/w-e-b-du-boiss-data-portraits-visualizing-black-america https://www.artbook.com/9781942884538.html https://github.com/ajstarks/dubois-data-portraits/blob/master/dubois-style.pdf https://github.com/ajstarks/dubois-data-portraits/blob/master/challenge/2025/README.md https://github.com/ajstarks/dubois-data-portraits https://github.com/ajstarks/modern-dubois-viz https://github.com/ajstarks/modern-dubois-viz
![Anthony J. Starks Art + Code [email protected] github.com/ajstarks speakerdeck.com/ajstarks @ajstarks](https://files.speakerdeck.com/presentations/02124b996742457e8e00dee46ed84bde/slide_57.jpg)