Upgrade to Pro
— share decks privately, control downloads, hide ads and more …
Speaker Deck
Features
Speaker Deck
PRO
Sign in
Sign up for free
Search
Search
CMNS 801 - Intro to Tableau II
Search
Alberto Lusoli
January 13, 2021
230
0
Share
Embed
Copy iframe code
Copy JS code
Copy link
Start on current slide
CMNS 801 - Intro to Tableau II
Intro to Tableau
Alberto Lusoli
January 13, 2021
More Decks by Alberto Lusoli
See All by Alberto Lusoli
AI and Creativity - Professional Responsibility and Technical Writing (CMPT 376W)
albertolusoli
0
180
Make Fail Repeat - Digital Democracies Institute - University of Korea symposium
albertolusoli
0
120
CMNS201 - Lab 8. Assignment 3
albertolusoli
0
100
Remote work and the redrawing of the US rural imaginary during the COVID-19 Pandemic
albertolusoli
0
560
CMNS201 - Lab 7. SPSS Multivariate Analysis
albertolusoli
0
270
CMNS201 - Lab 6. SPSS Bivariate Analysis, Crosstab
albertolusoli
0
450
CMNS201 - Lab 5. Charts in SPSS
albertolusoli
1
400
CMNS201 - Lab 4. SPSS Univariate Analysis
albertolusoli
0
360
CMNS201 - Lab 3. SPSS Variables recoding
albertolusoli
0
350
Featured
See All Featured
Measuring Dark Social's Impact On Conversion and Attribution
stephenakadiri
2
230
4 Signs Your Business is Dying
shpigford
187
22k
Cheating the UX When There Is Nothing More to Optimize - PixelPioneers
stephaniewalter
287
14k
WCS-LA-2024
lcolladotor
0
680
Navigating the moral maze — ethical principles for Al-driven product design
skipperchong
2
410
Save Time (by Creating Custom Rails Generators)
garrettdimon
PRO
32
3.7k
Making the Leap to Tech Lead
cromwellryan
135
10k
For a Future-Friendly Web
brad_frost
183
10k
Applied NLP in the Age of Generative AI
inesmontani
PRO
4
2.4k
The Web Performance Landscape in 2024 [PerfNow 2024]
tammyeverts
12
1.2k
Joys of Absence: A Defence of Solitary Play
codingconduct
1
410
Helping Users Find Their Own Way: Creating Modern Search Experiences
danielanewman
31
3.2k
Transcript
Data Visualization Introduction to Tableau – Part II Alberto Lusoli,
Simon Fraser University. School of Communication EXPLORATORY DATA ANALYSIS
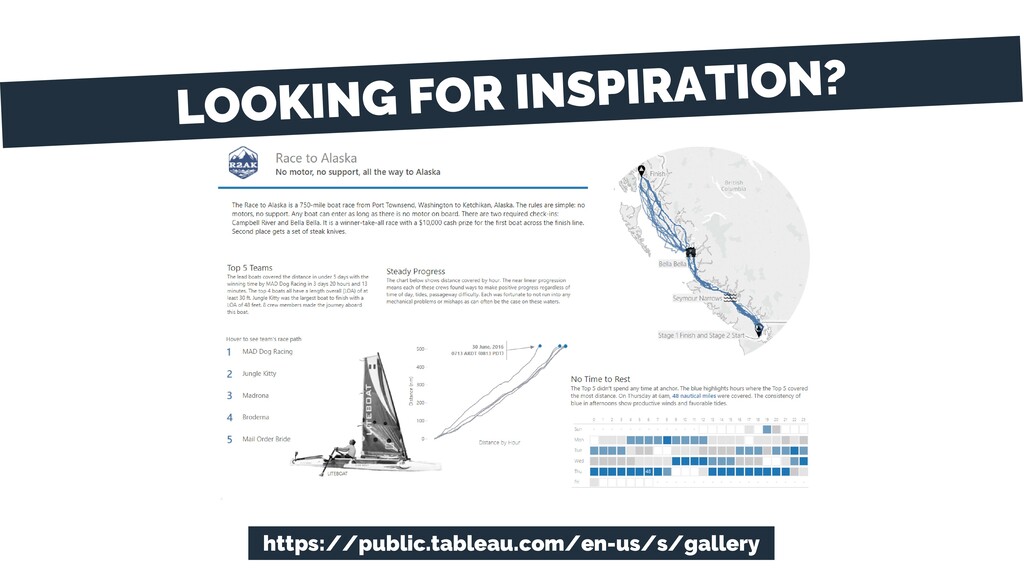
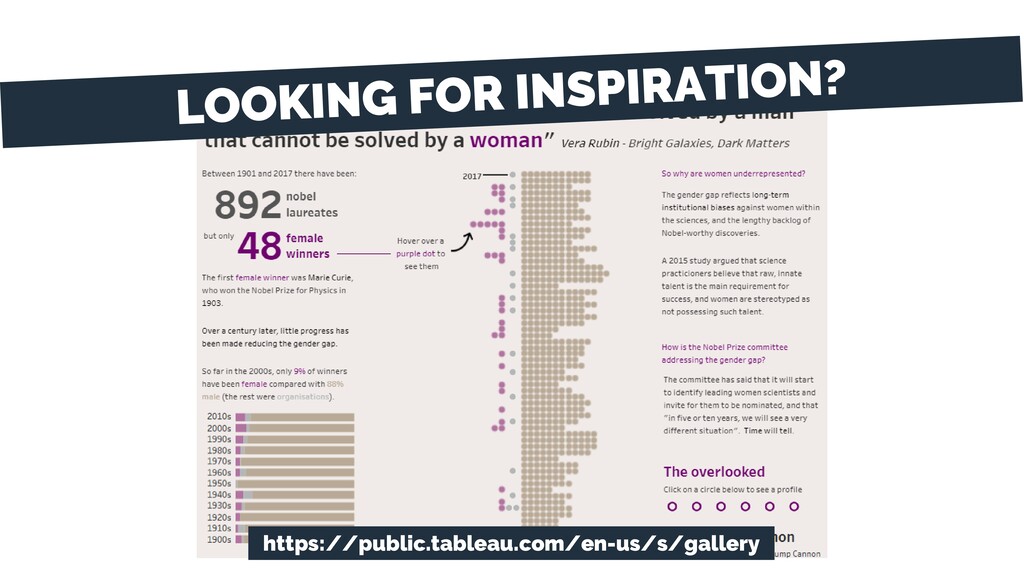
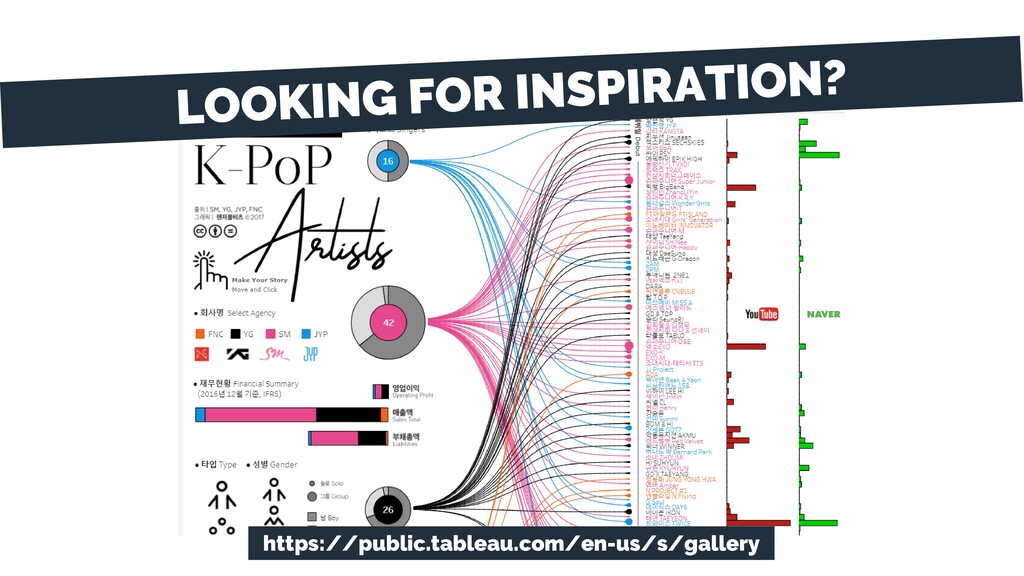
https://public.tableau.com/en-us/s/gallery
https://public.tableau.com/en-us/s/gallery
https://public.tableau.com/en-us/s/gallery
http://bit.ly/van-pub-art
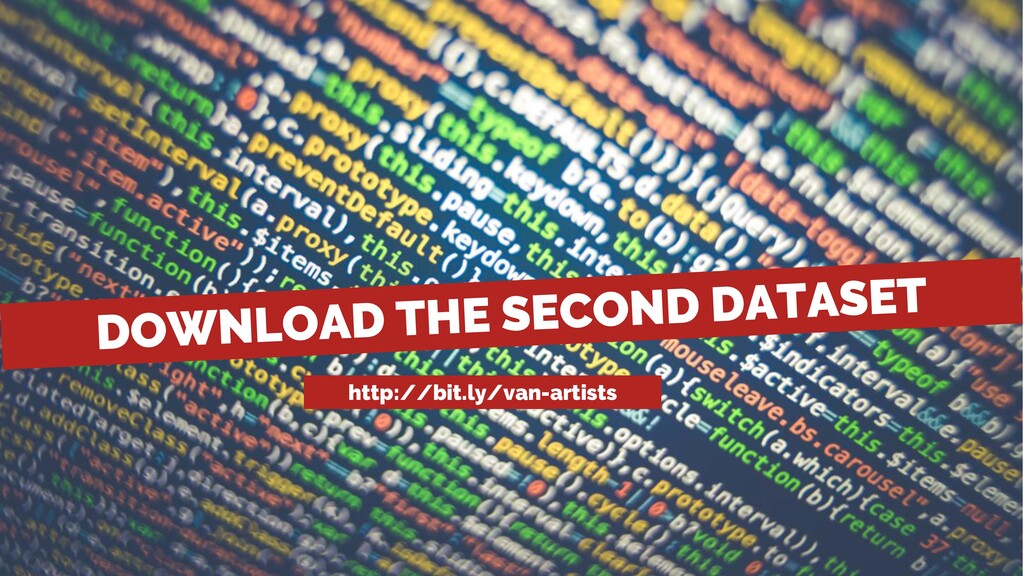
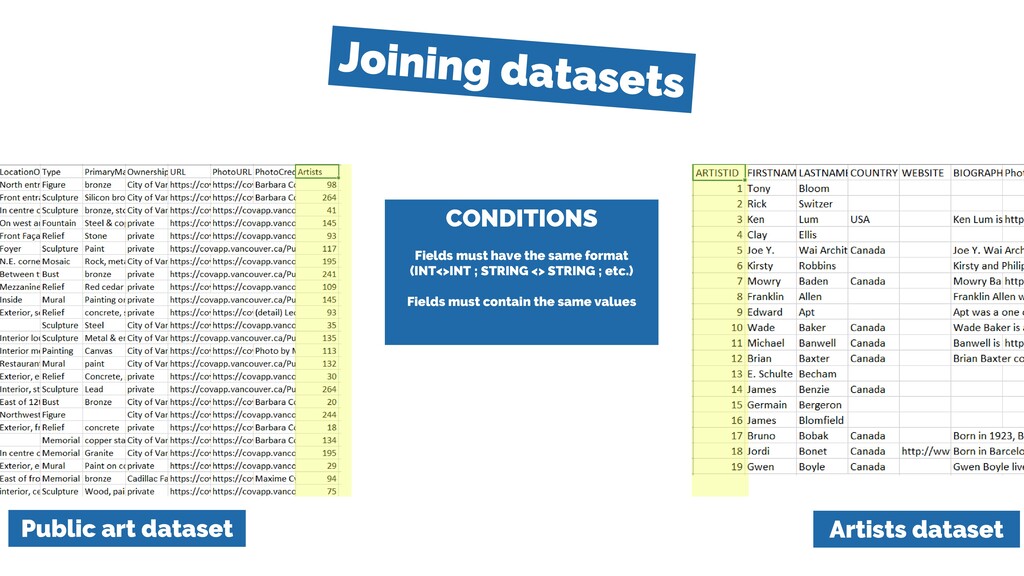
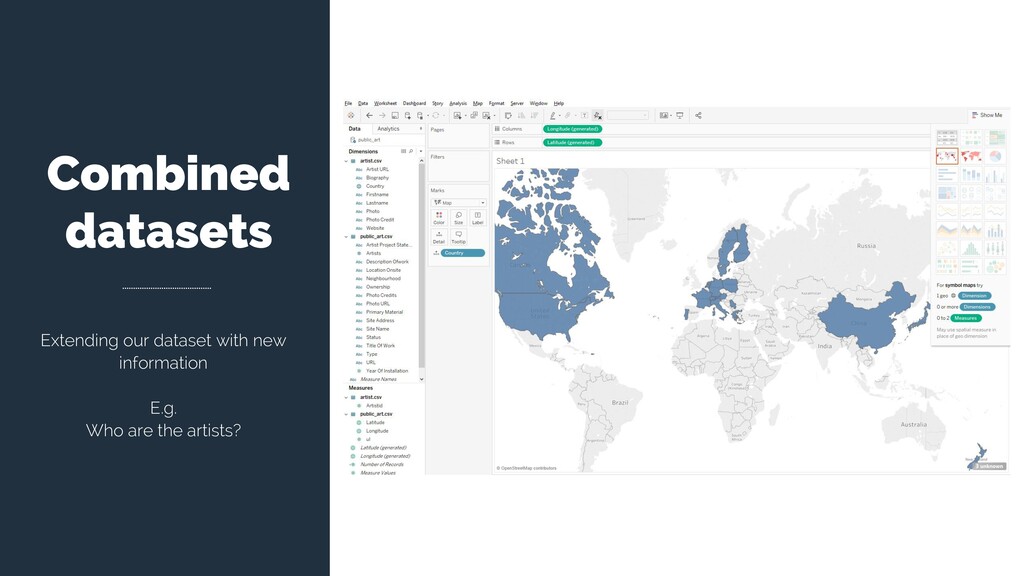
Public art in Vancouver Extending our dataset with new information
E.g. Who are the artists?
http://bit.ly/van-artists
None
None
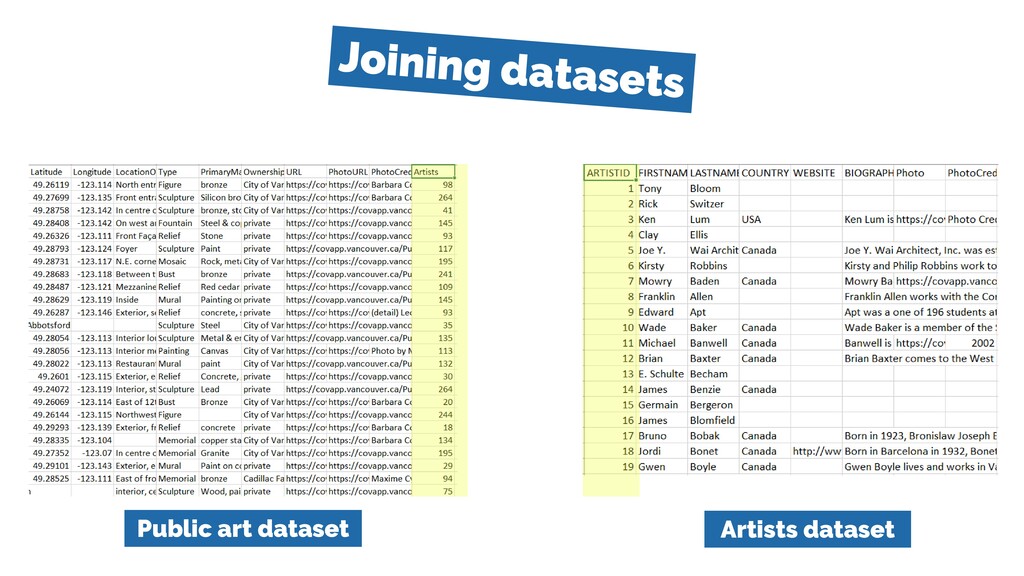
Artists dataset Public art dataset
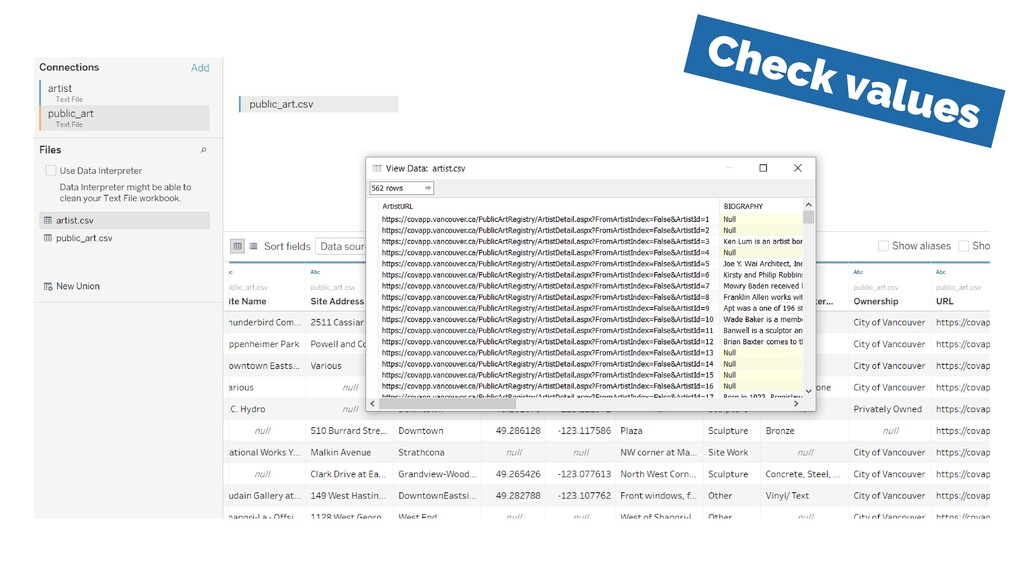
Artists dataset Public art dataset CONDITIONS Fields must have the
same format (INT<>INT ; STRING <> STRING ; etc.) Fields must contain the same values
None
None
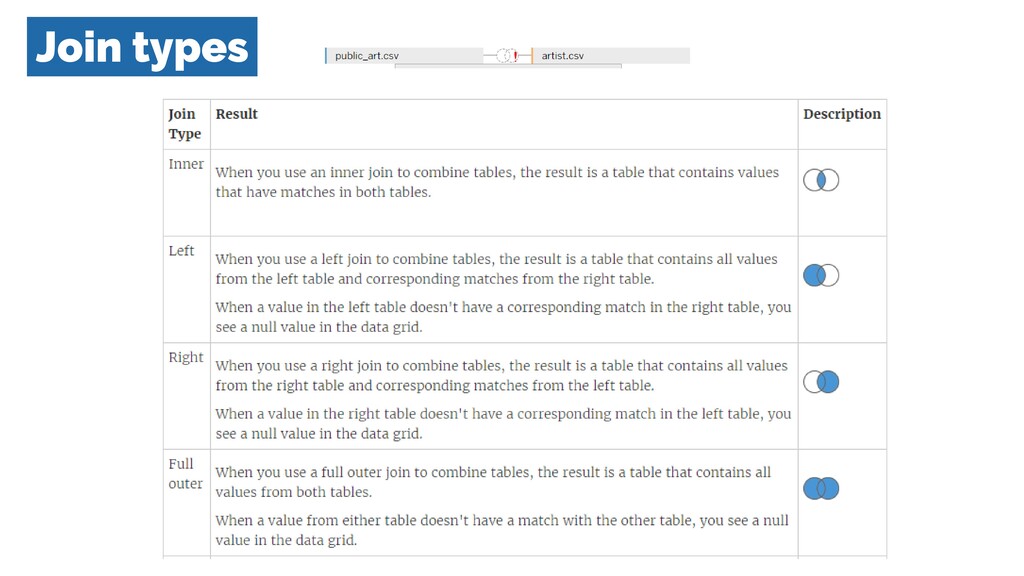
Join types
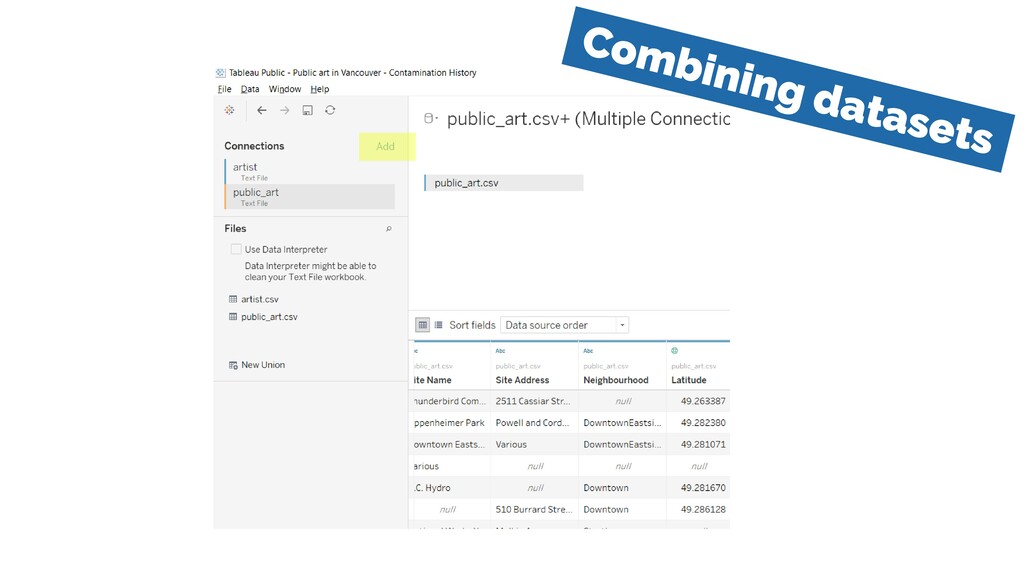
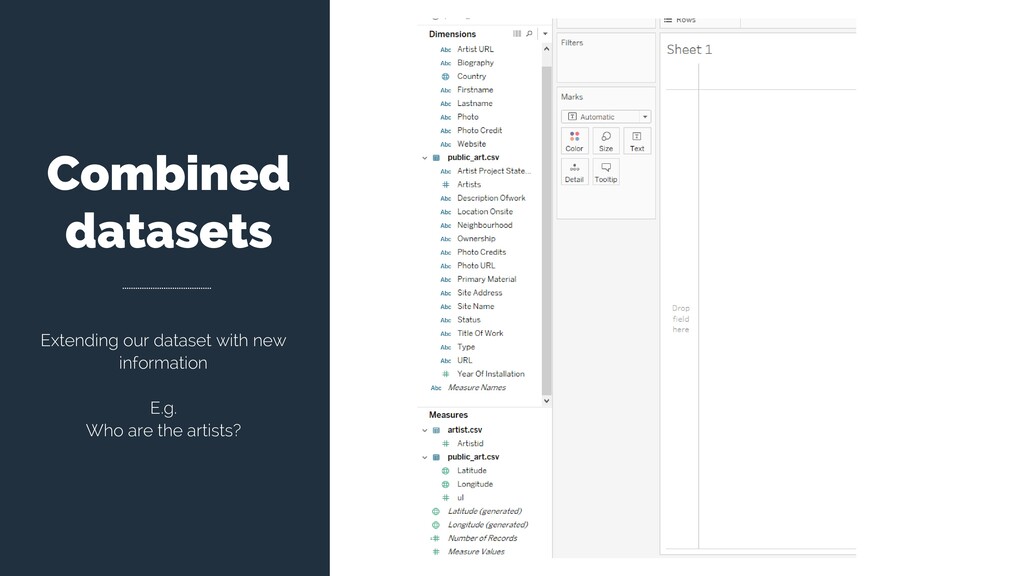
Combined datasets Extending our dataset with new information E.g. Who
are the artists?
Combined datasets Extending our dataset with new information E.g. Who
are the artists?
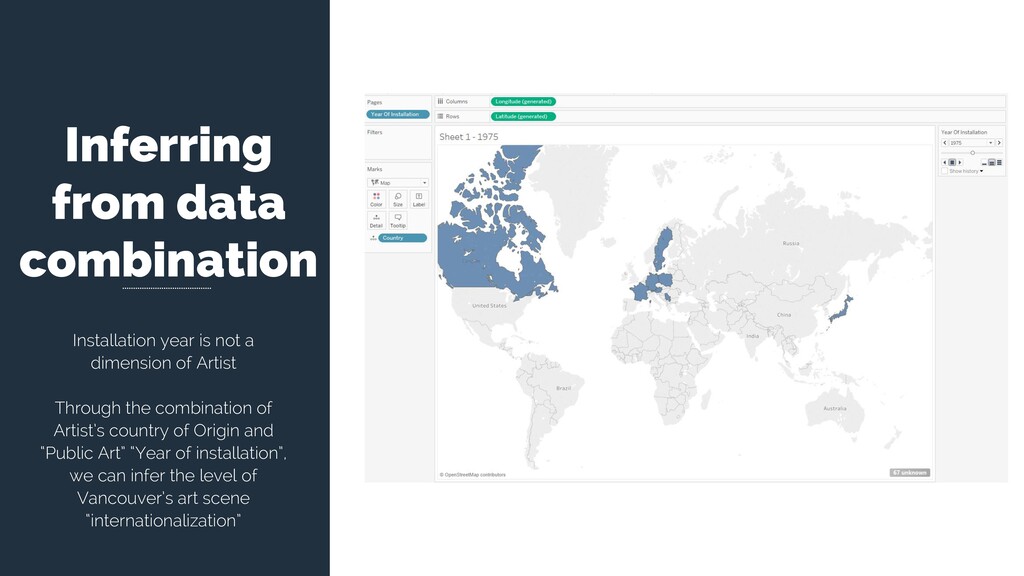
Inferring from data combination Installation year is not a dimension
of Artist Through the combination of Artist’s country of Origin and “Public Art” “Year of installation”, we can infer the level of Vancouver’s art scene “internationalization”
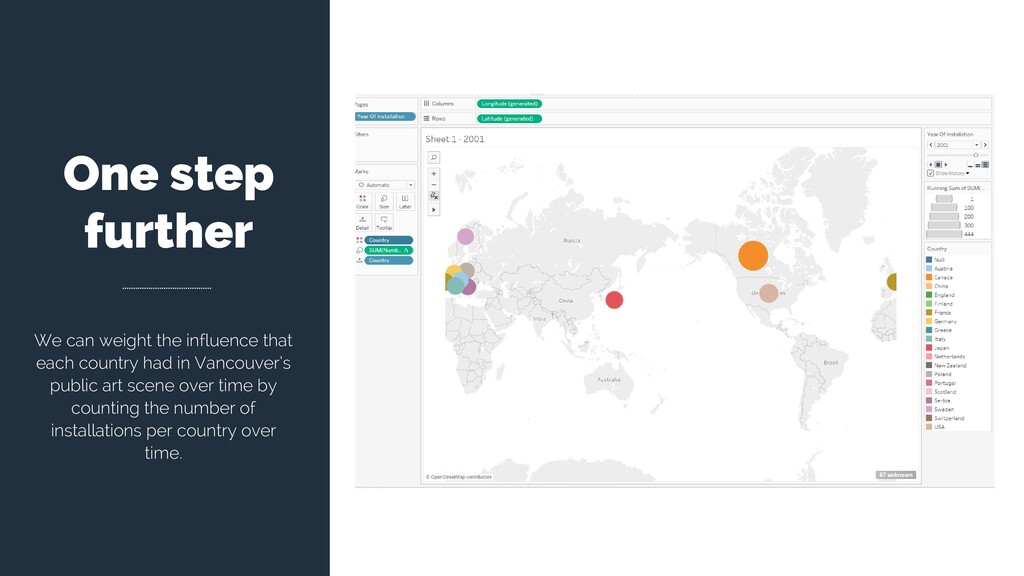
One step further We can weight the influence that each
country had in Vancouver’s public art scene over time by counting the number of installations per country over time.
None
http://bit.ly/tableau-sfu
For questions or help, write me at:
[email protected]
THANK YOU
![For questions or help, write me at: [email protected] THANK YOU](https://files.speakerdeck.com/presentations/69e6c5944137453dbe4f75bd73143610/slide_20.jpg)