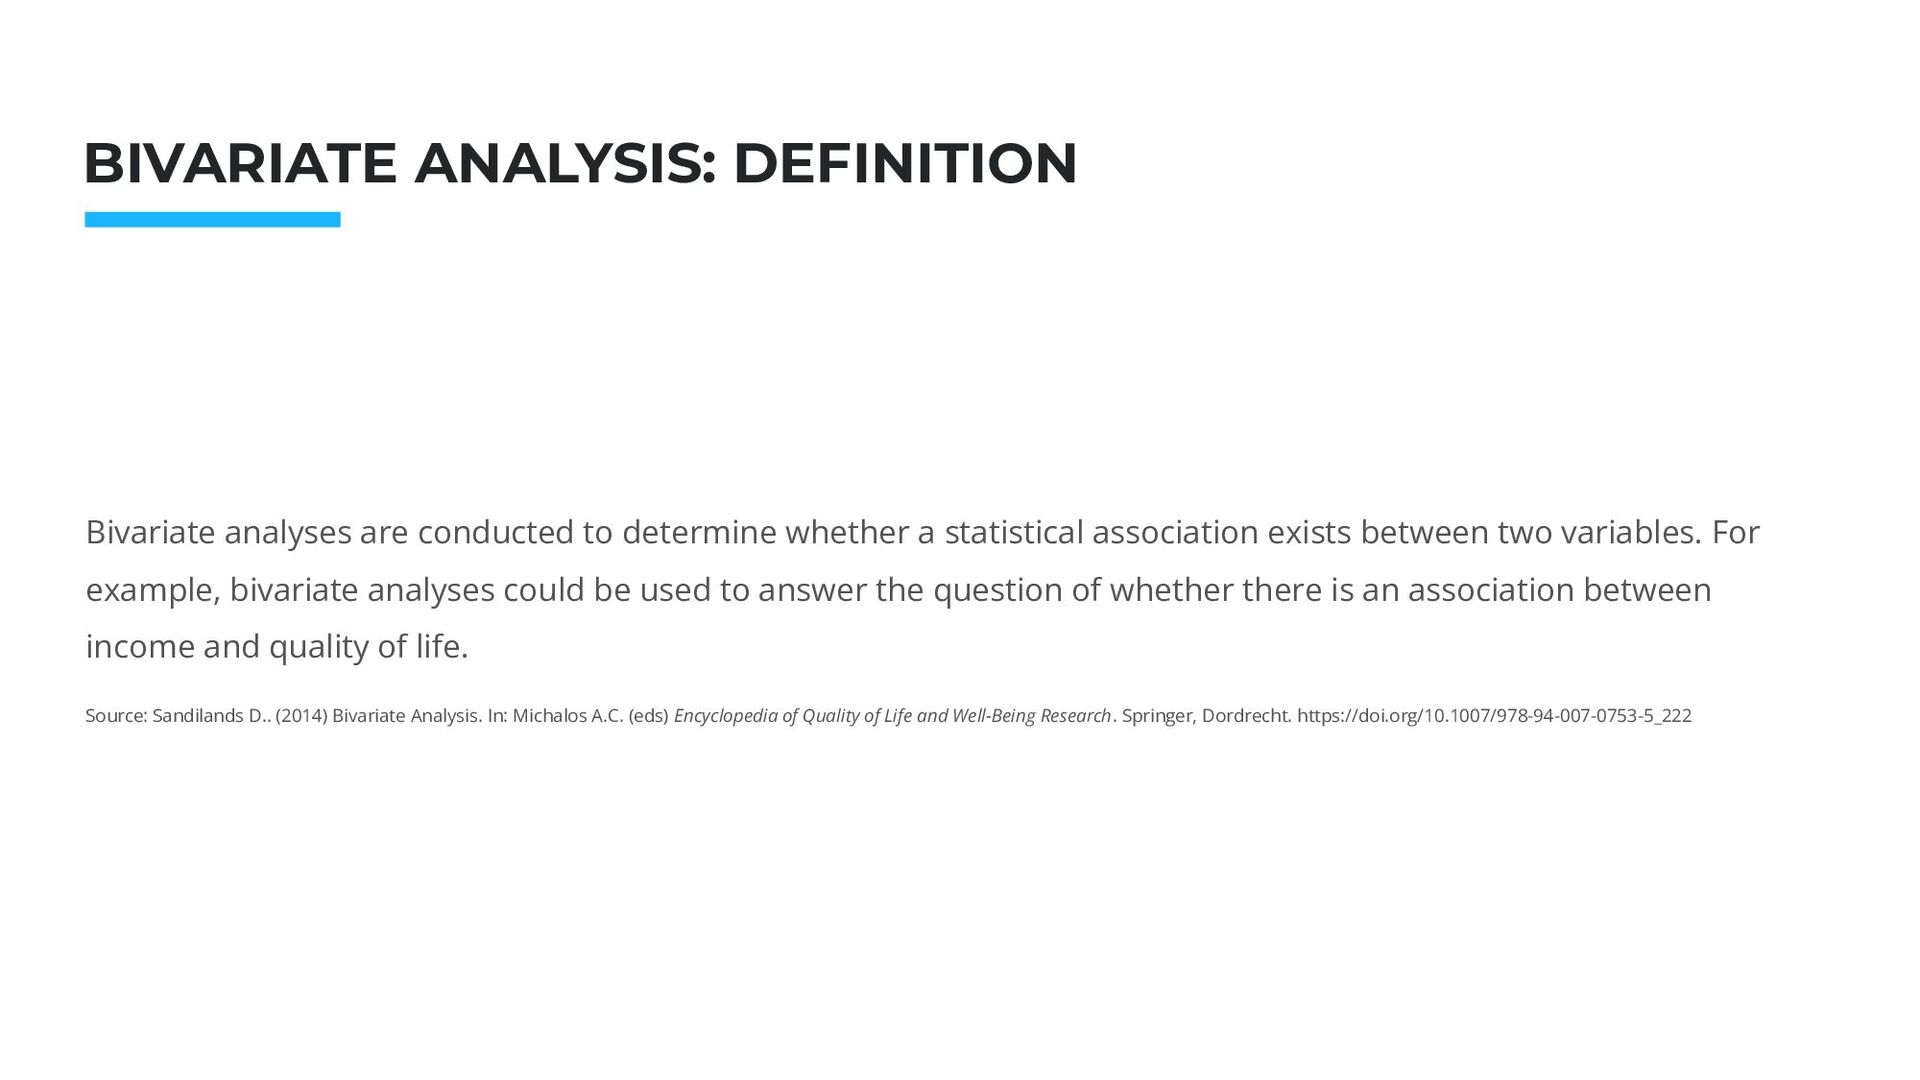
are conducted to determine whether a statistical association exists between two variables. For example, bivariate analyses could be used to answer the question of whether there is an association between income and quality of life. Source: Sandilands D.. (2014) Bivariate Analysis. In: Michalos A.C. (eds) Encyclopedia of Quality of Life and Well-Being Research. Springer, Dordrecht. https://doi.org/10.1007/978-94-007-0753-5_222
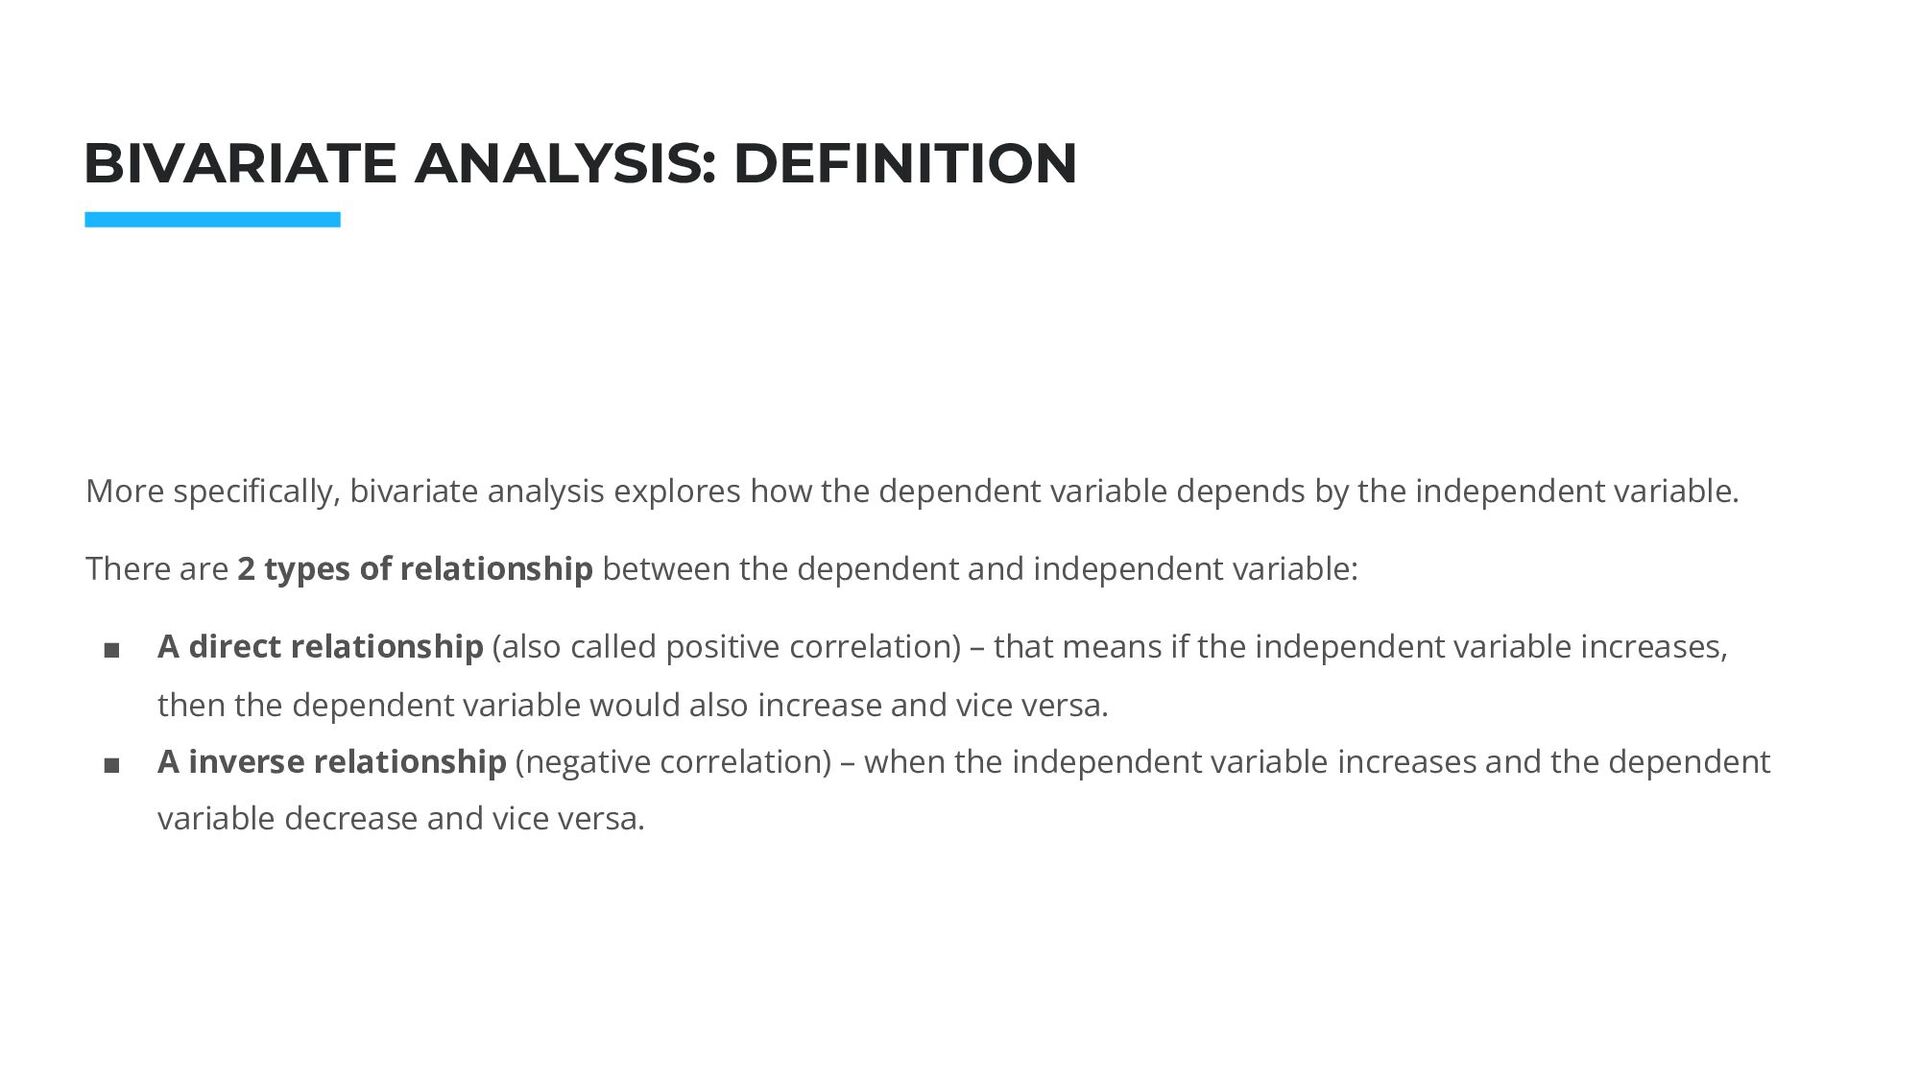
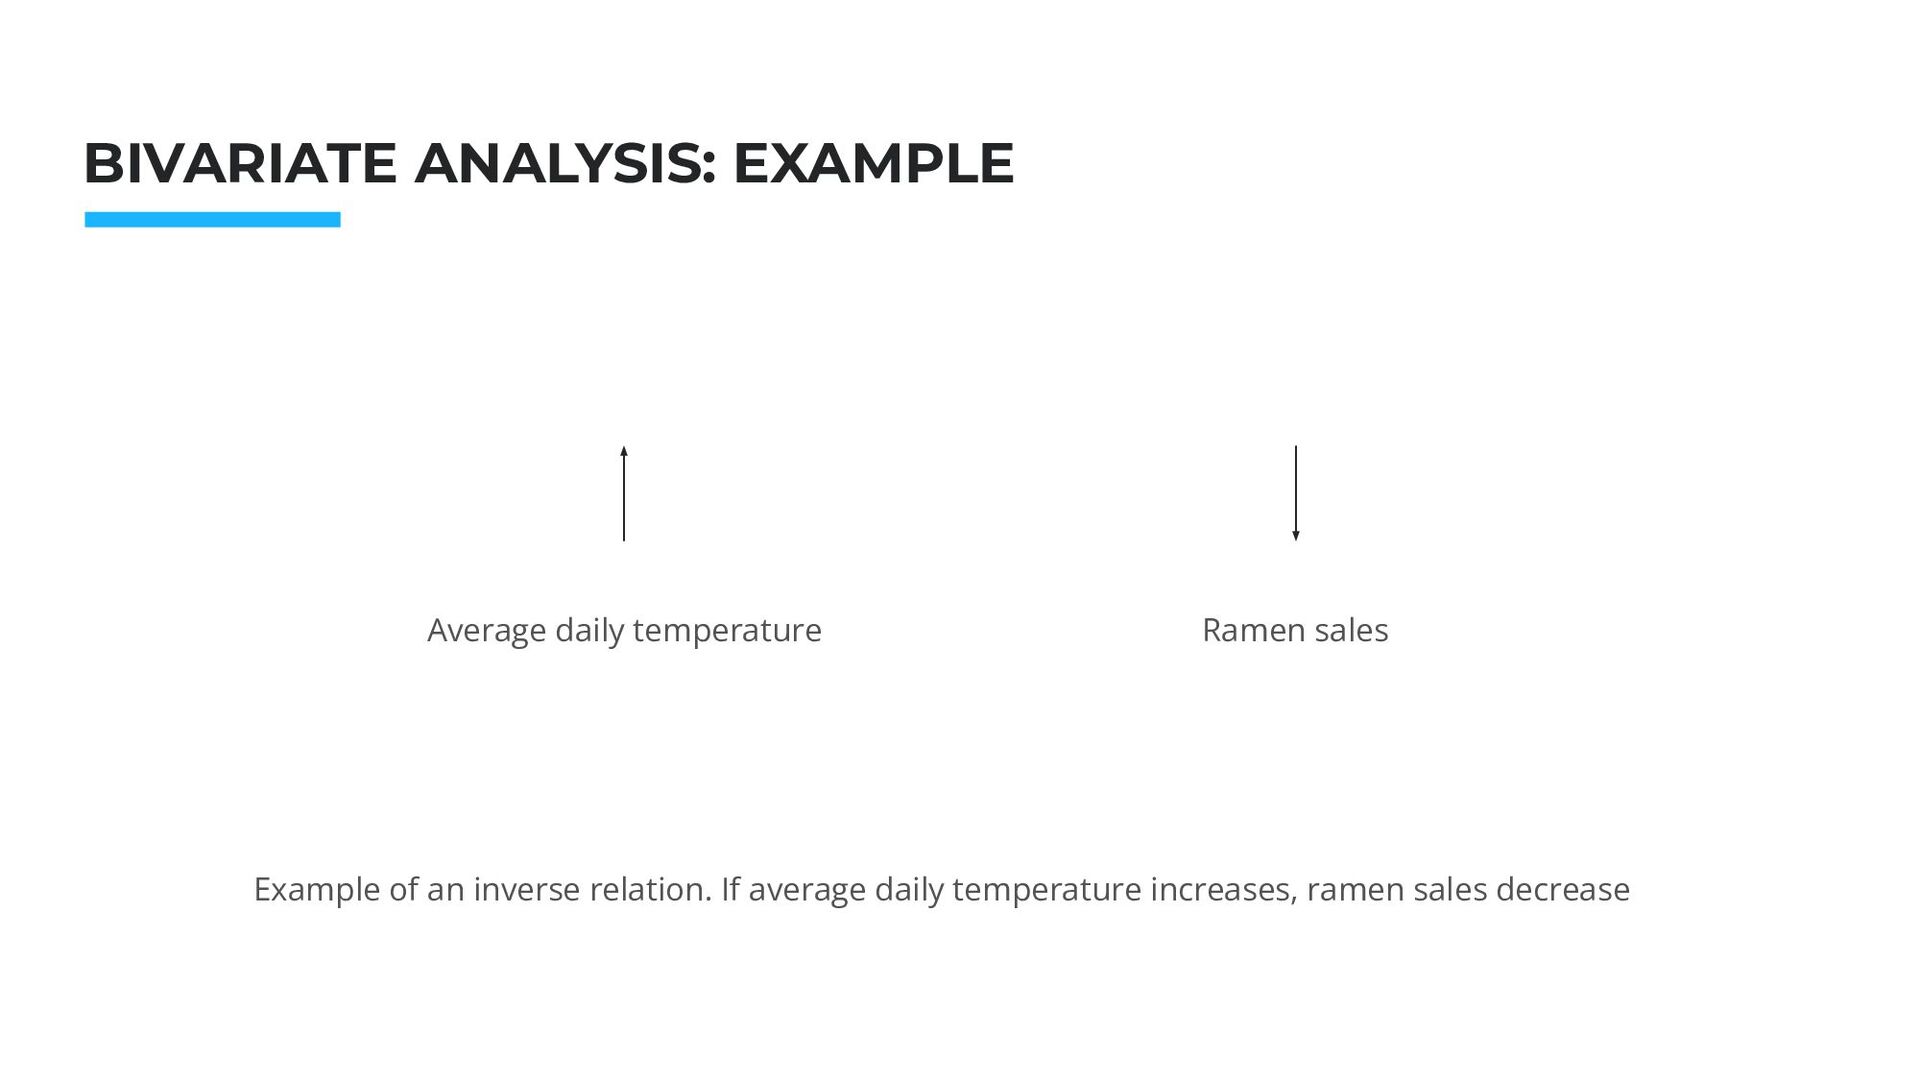
bivariate analysis explores how the dependent variable depends by the independent variable. There are 2 types of relationship between the dependent and independent variable: ▪ A direct relationship (also called positive correlation) – that means if the independent variable increases, then the dependent variable would also increase and vice versa. ▪ A inverse relationship (negative correlation) – when the independent variable increases and the dependent variable decrease and vice versa.
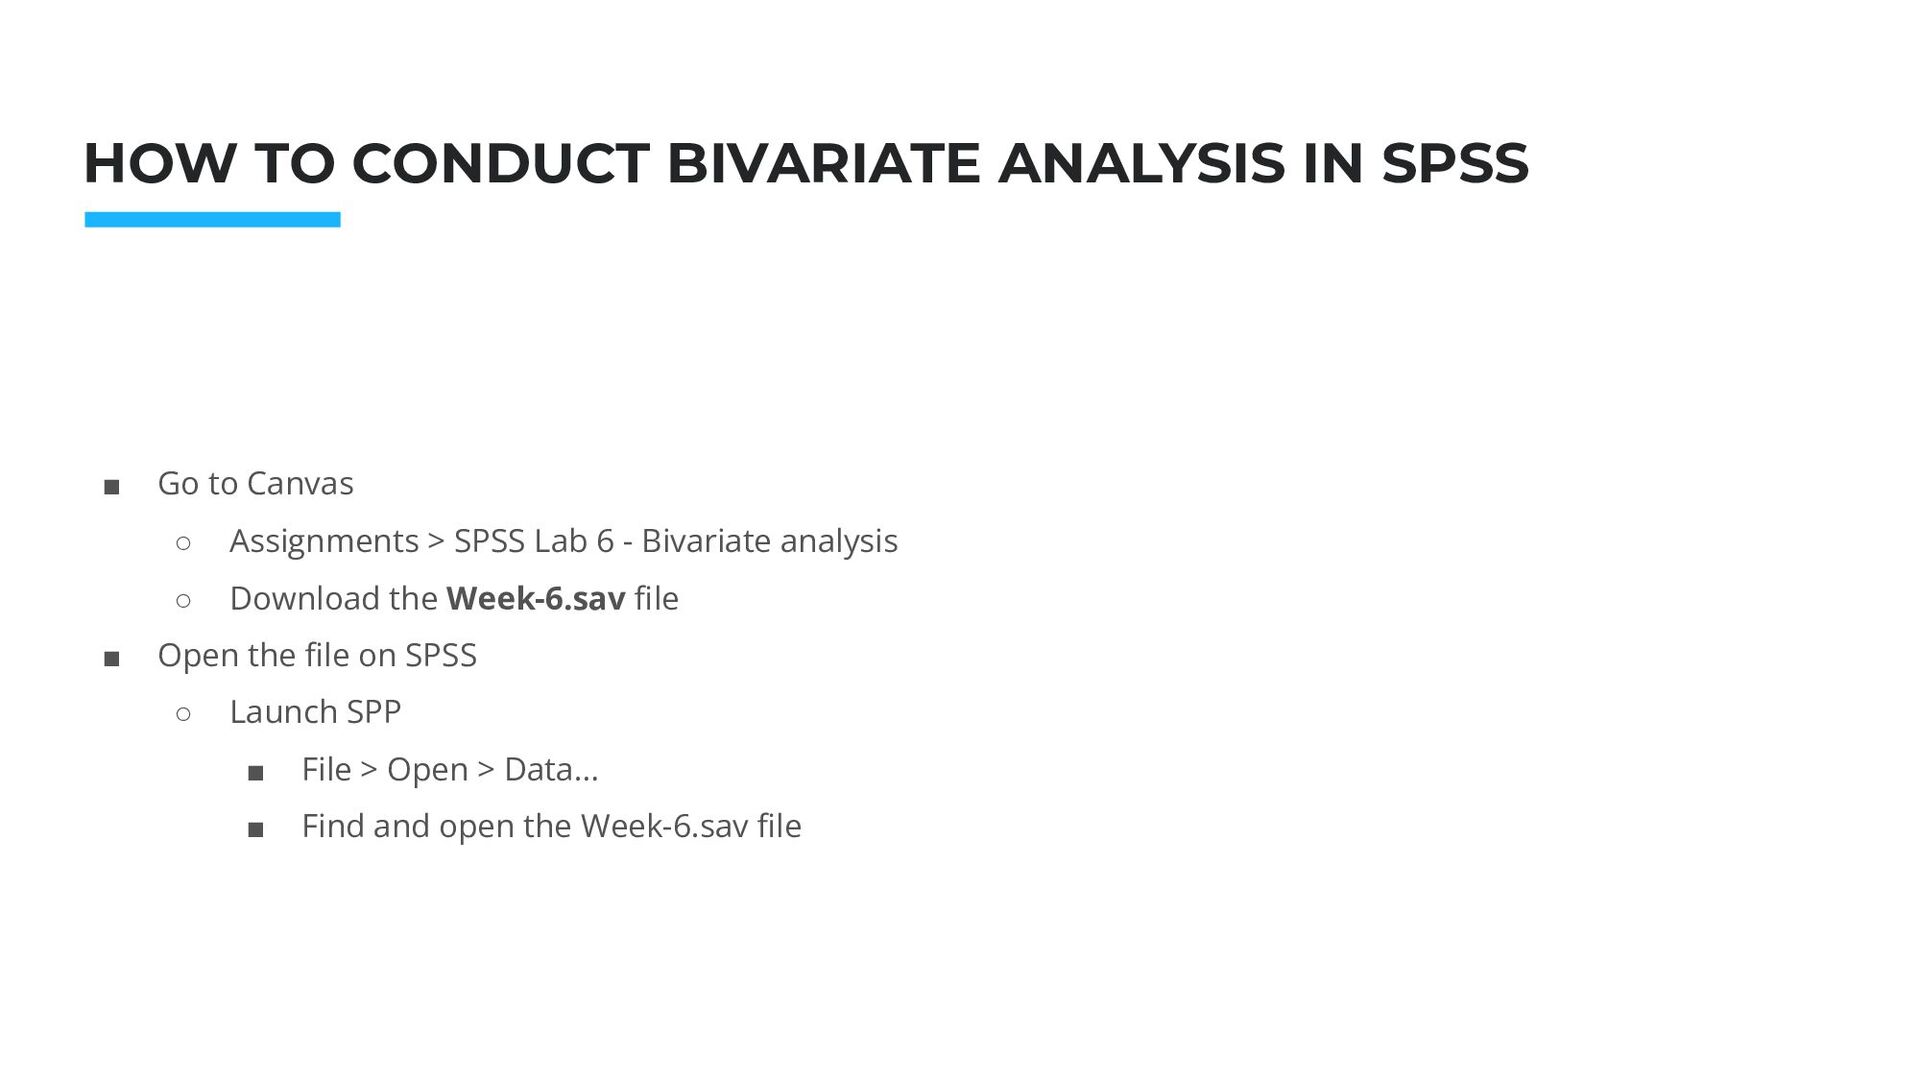
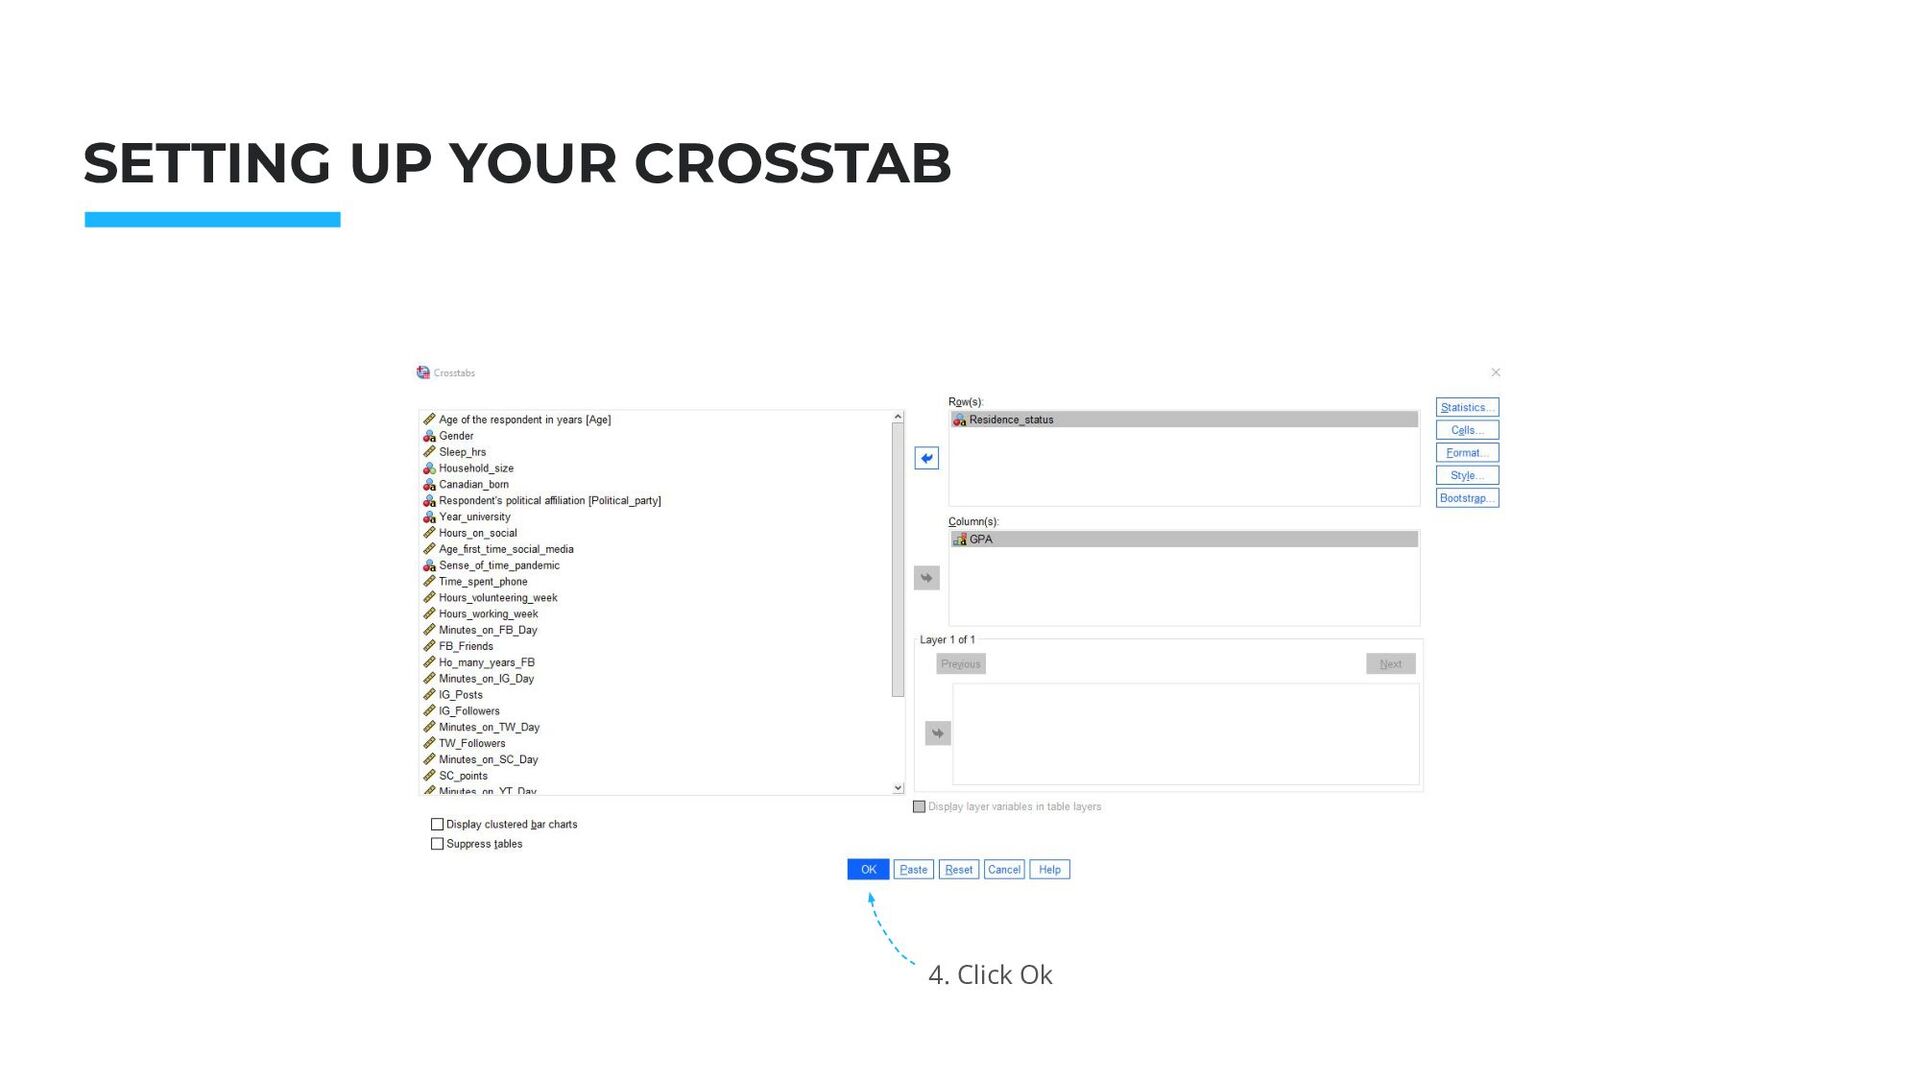
IN SPSS ▪ Go to Canvas ◦ Assignments > SPSS Lab 6 - Bivariate analysis ◦ Download the Week-6.sav file ▪ Open the file on SPSS ◦ Launch SPP ▪ File > Open > Data… ▪ Find and open the Week-6.sav file
HYPOTHESIS SFU Students with Canadian citizenship will tend to have higher GPA because they grew up within the Canadian educational system. On the contrary, SFU students on a study permit will have lower GPA because in addition to entering a new educational system, they also experience disconnection from their families and communities. Null hypothesis: there is no relation between Immigration Status and GPA
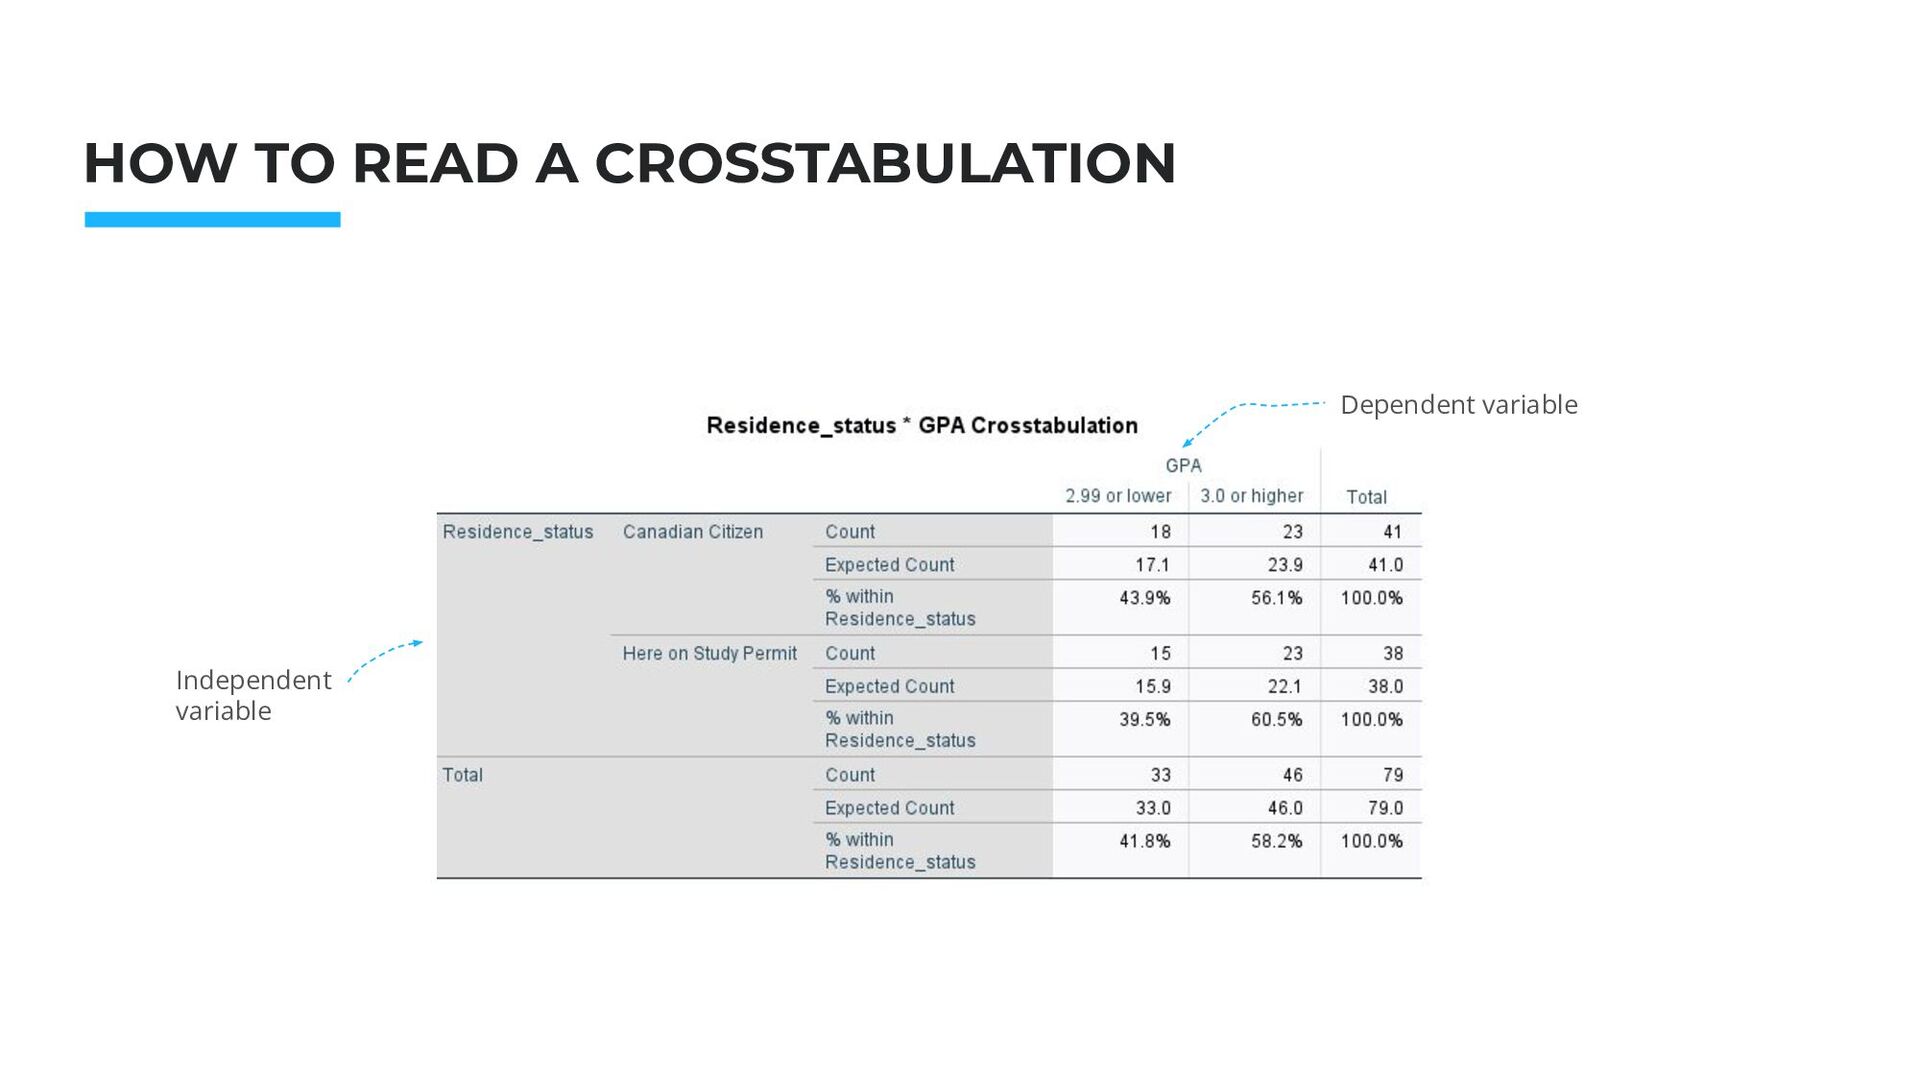
HYPOTHESIS SFU Students with Canadian citizenship will tend to have higher GPA because they grew up within the Canadian teaching system. On the contrary, SFU students on a study permit will have lower GPA because in addition to entering a new educational system, they also experience disconnection from their families and communities. Immigration status: Independent variable GPA: dependent variable Null hypothesis: there is no relation between Immigration Status and GPA
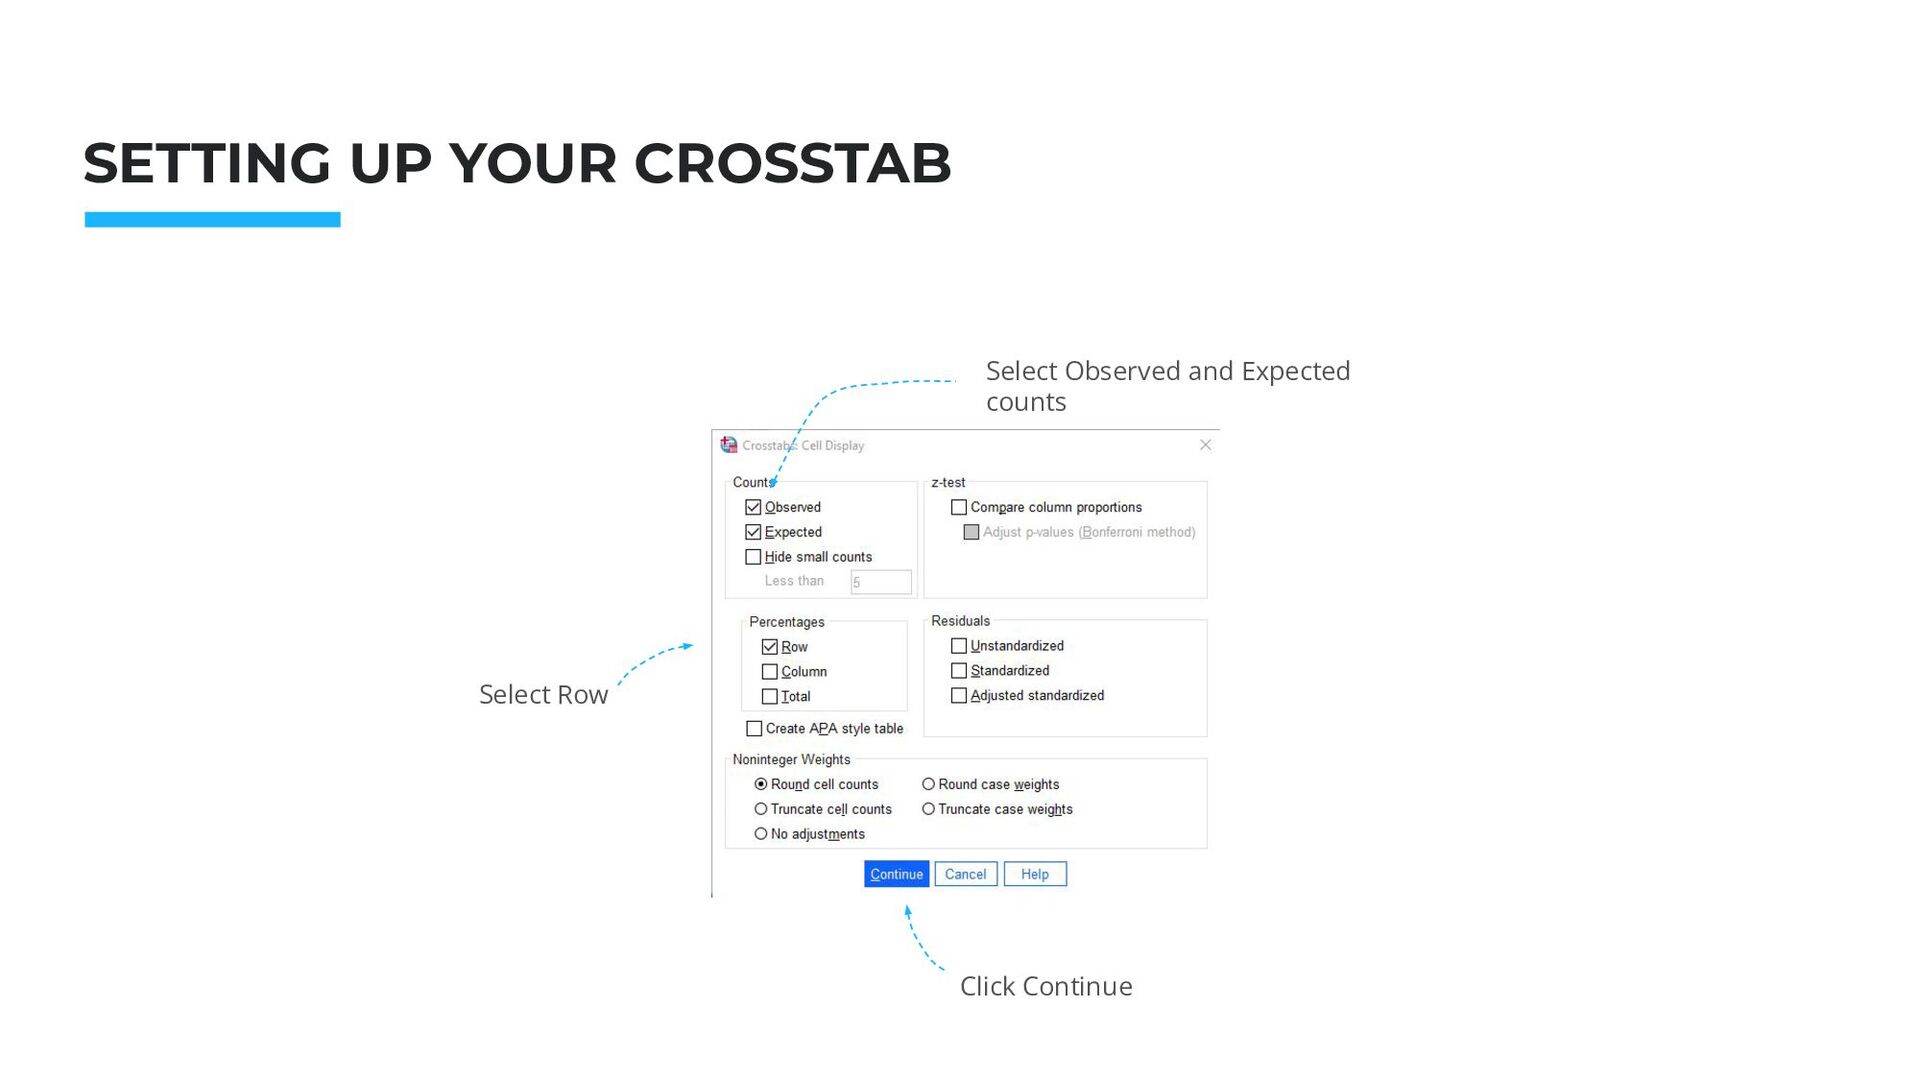
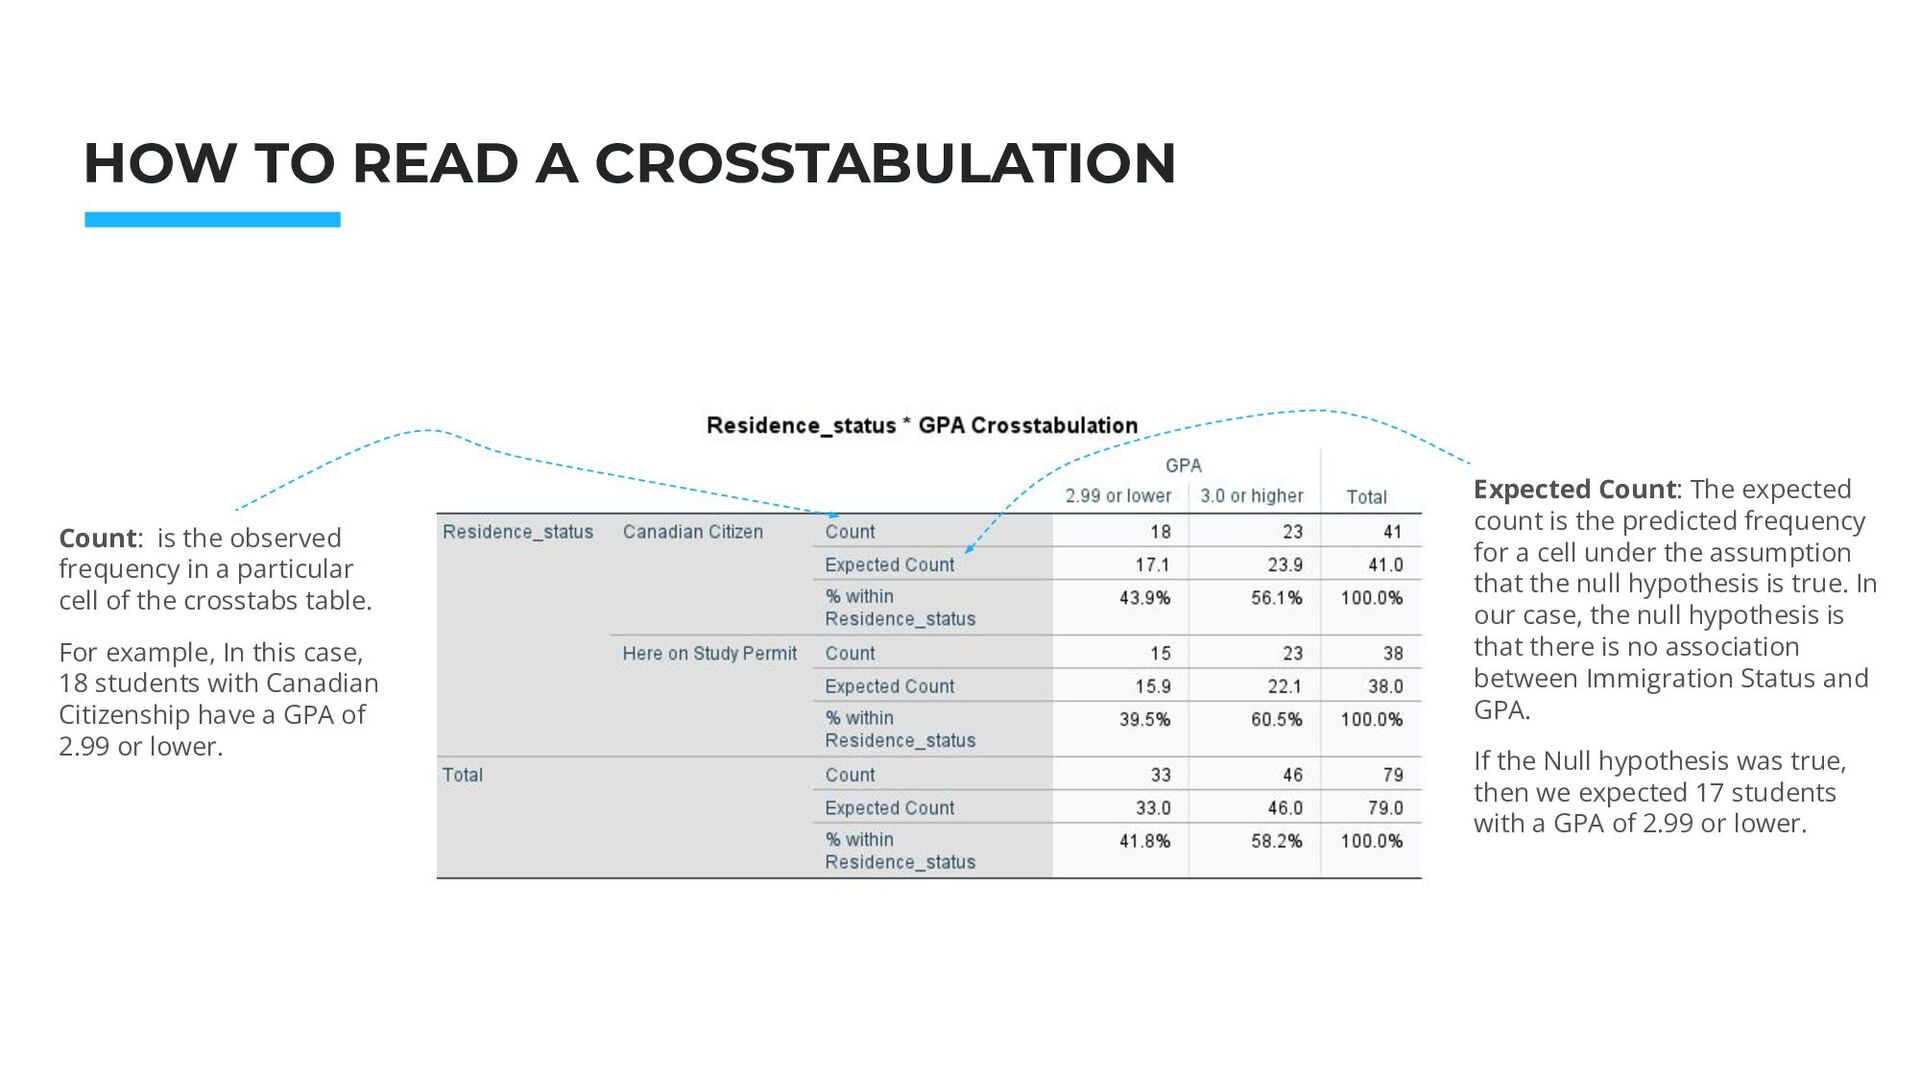
Count: is the observed frequency in a particular cell of the crosstabs table. For example, In this case, 18 students with Canadian Citizenship have a GPA of 2.99 or lower. Expected Count: The expected count is the predicted frequency for a cell under the assumption that the null hypothesis is true. In our case, the null hypothesis is that there is no association between Immigration Status and GPA. If the Null hypothesis was true, then we expected 17 students with a GPA of 2.99 or lower.
*: “significant” is a very broad qualifier. In general, if you see a difference equal or greater of 10%, you can assume there is a relation between the two variables (which can confirm or not your hypothesis). If the difference is small (around 5%), you can assume there is no relation between the two variables. To understand if our initial hypothesis is confirmed or not, we need to compare % by column. To confirm our hypothesis, the % of Canadian students with a GPA greater than 3 should have been significantly* above the % of study permit students with a GPA above 3. This results do not support the hypothesis. Actually show the opposite: there is a relation between Residence_Status and GPA but a relatively larger share of Study permit students (4.4%) compared to Canadian Citizen appear to have a GPA of 3 or higher.
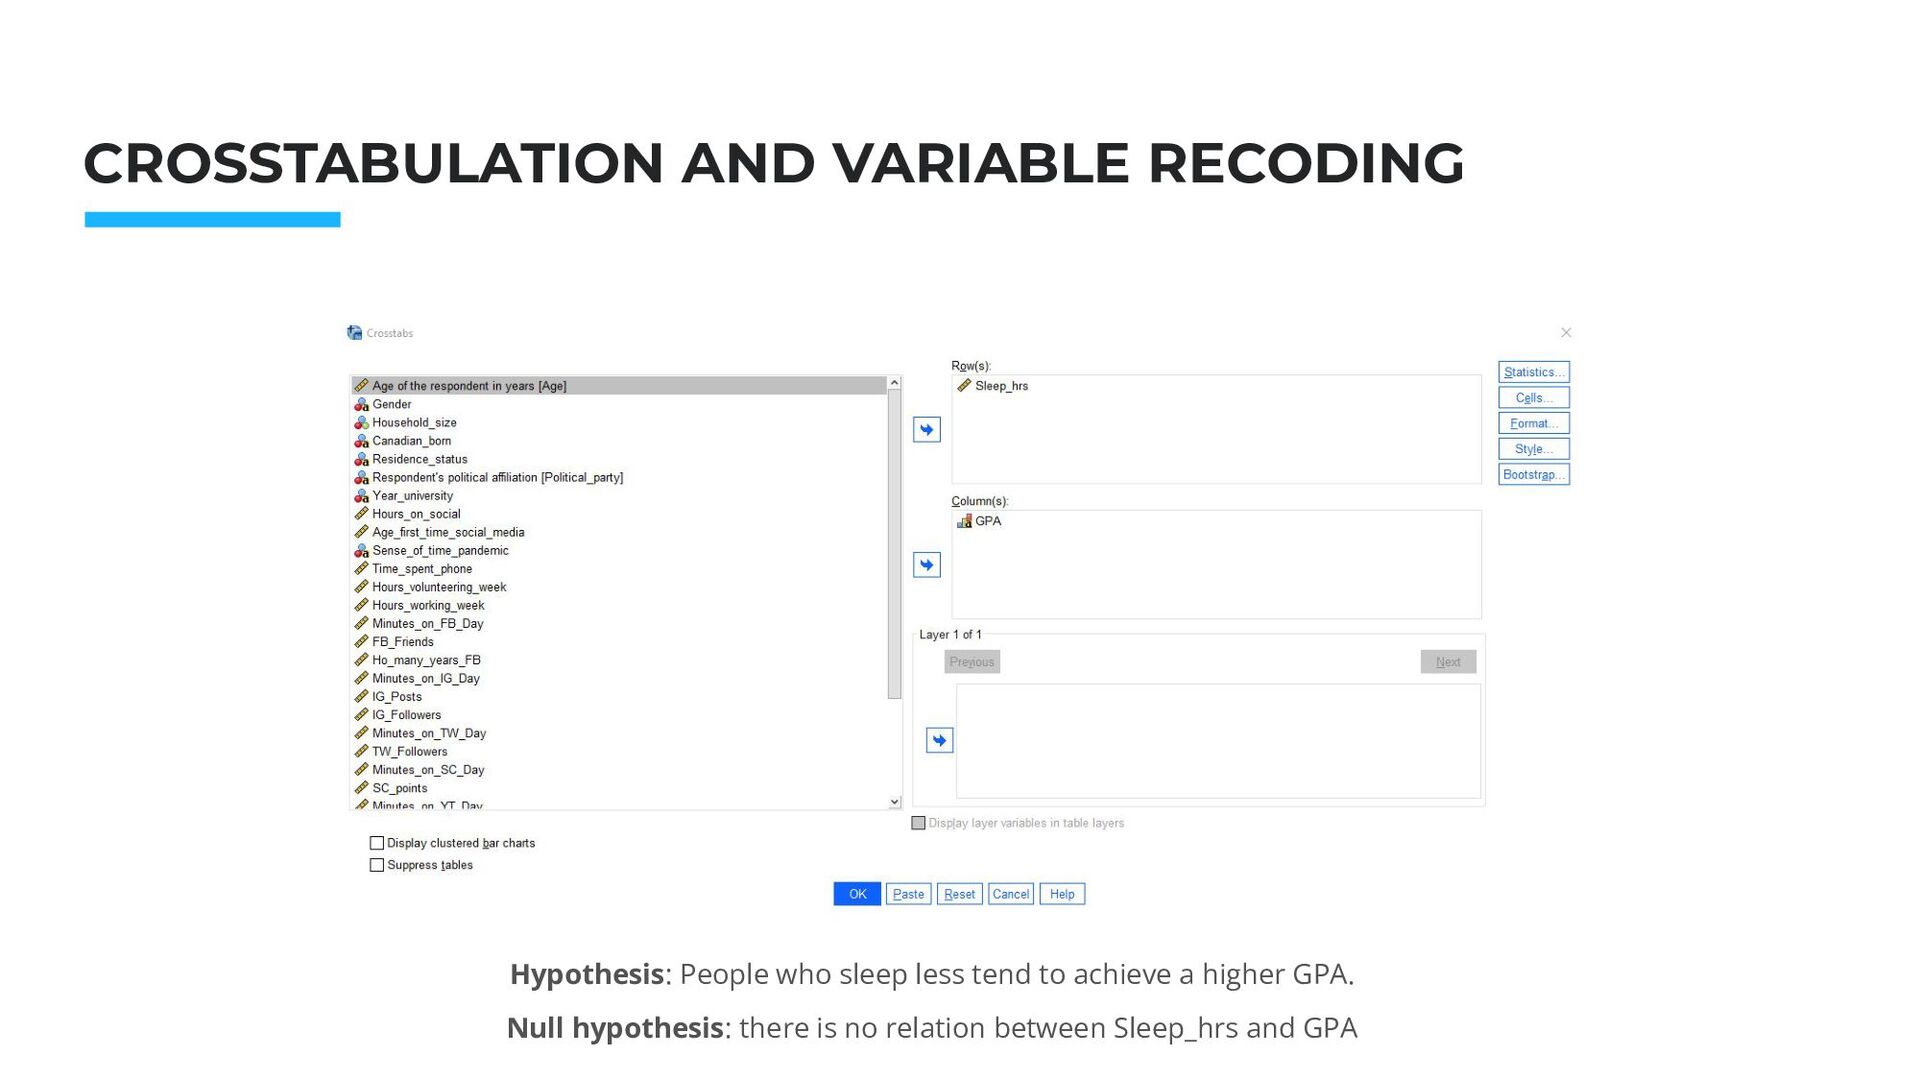
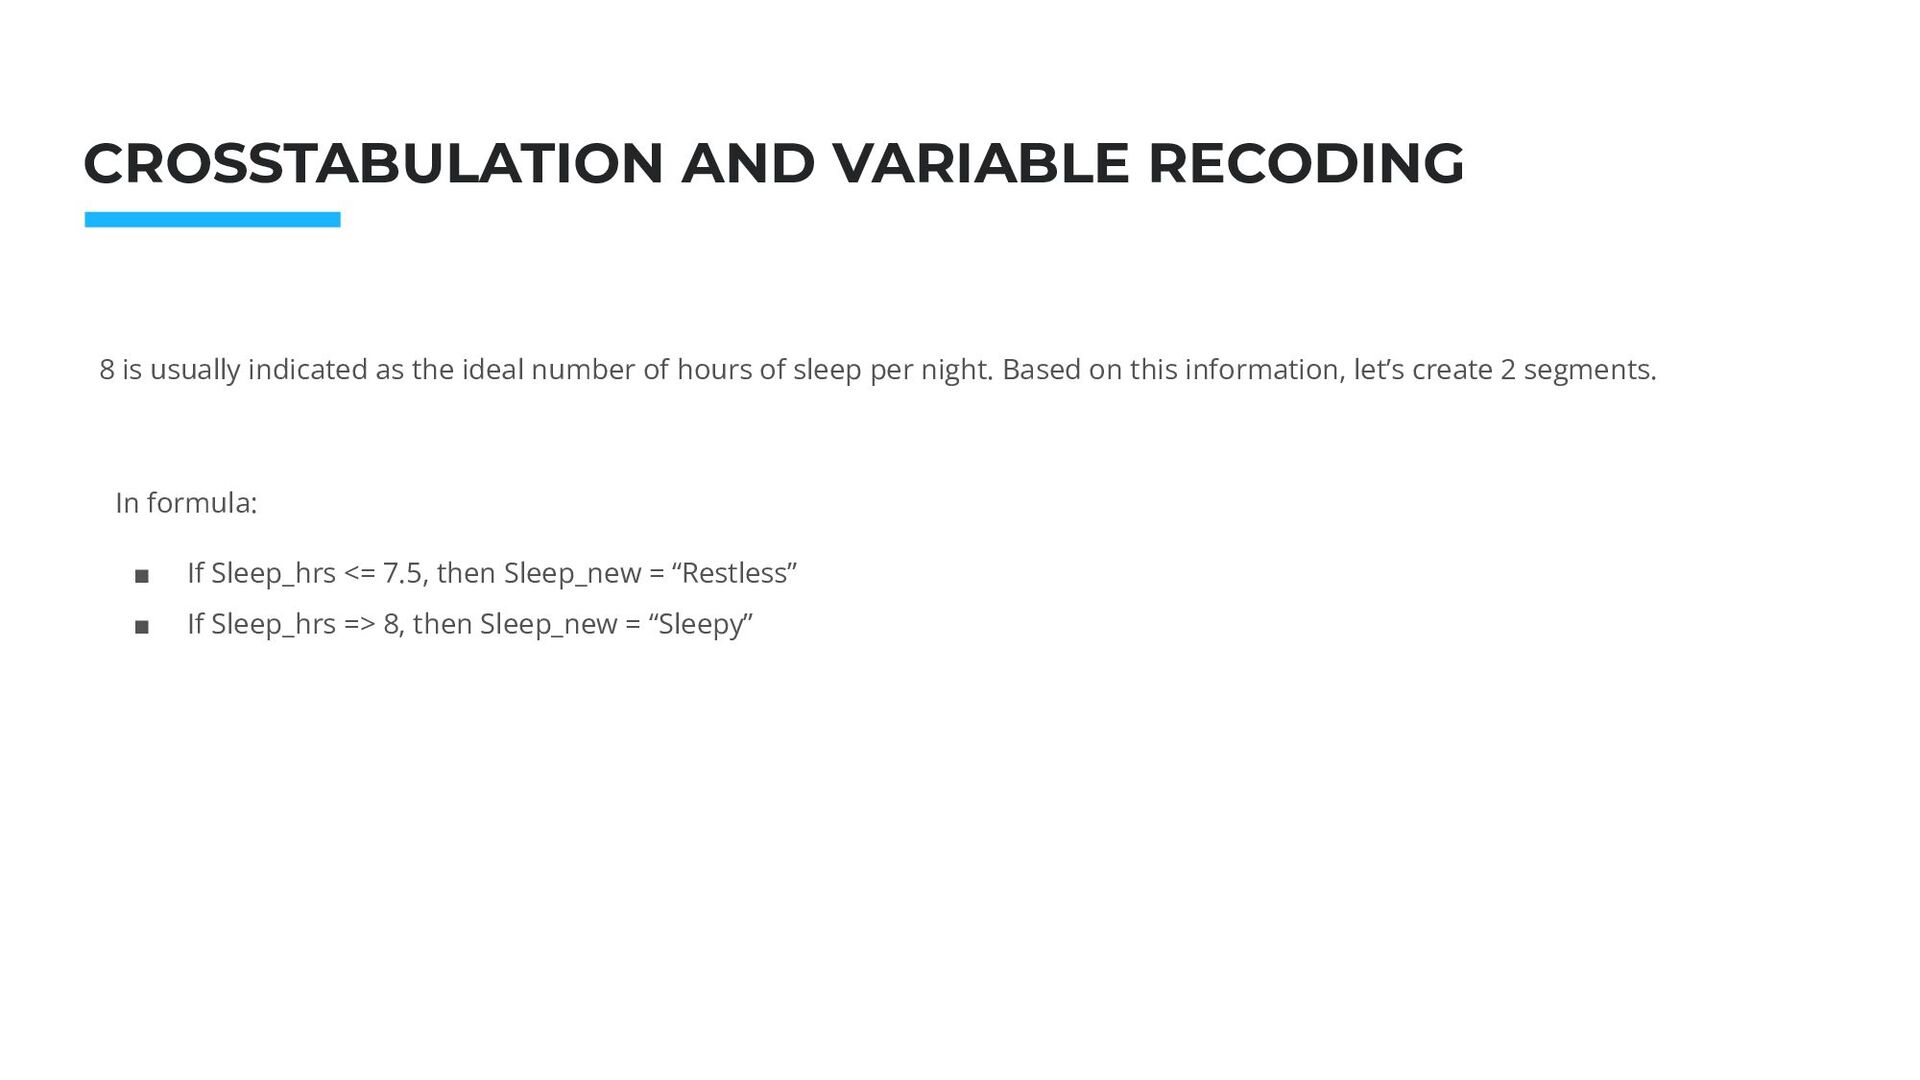
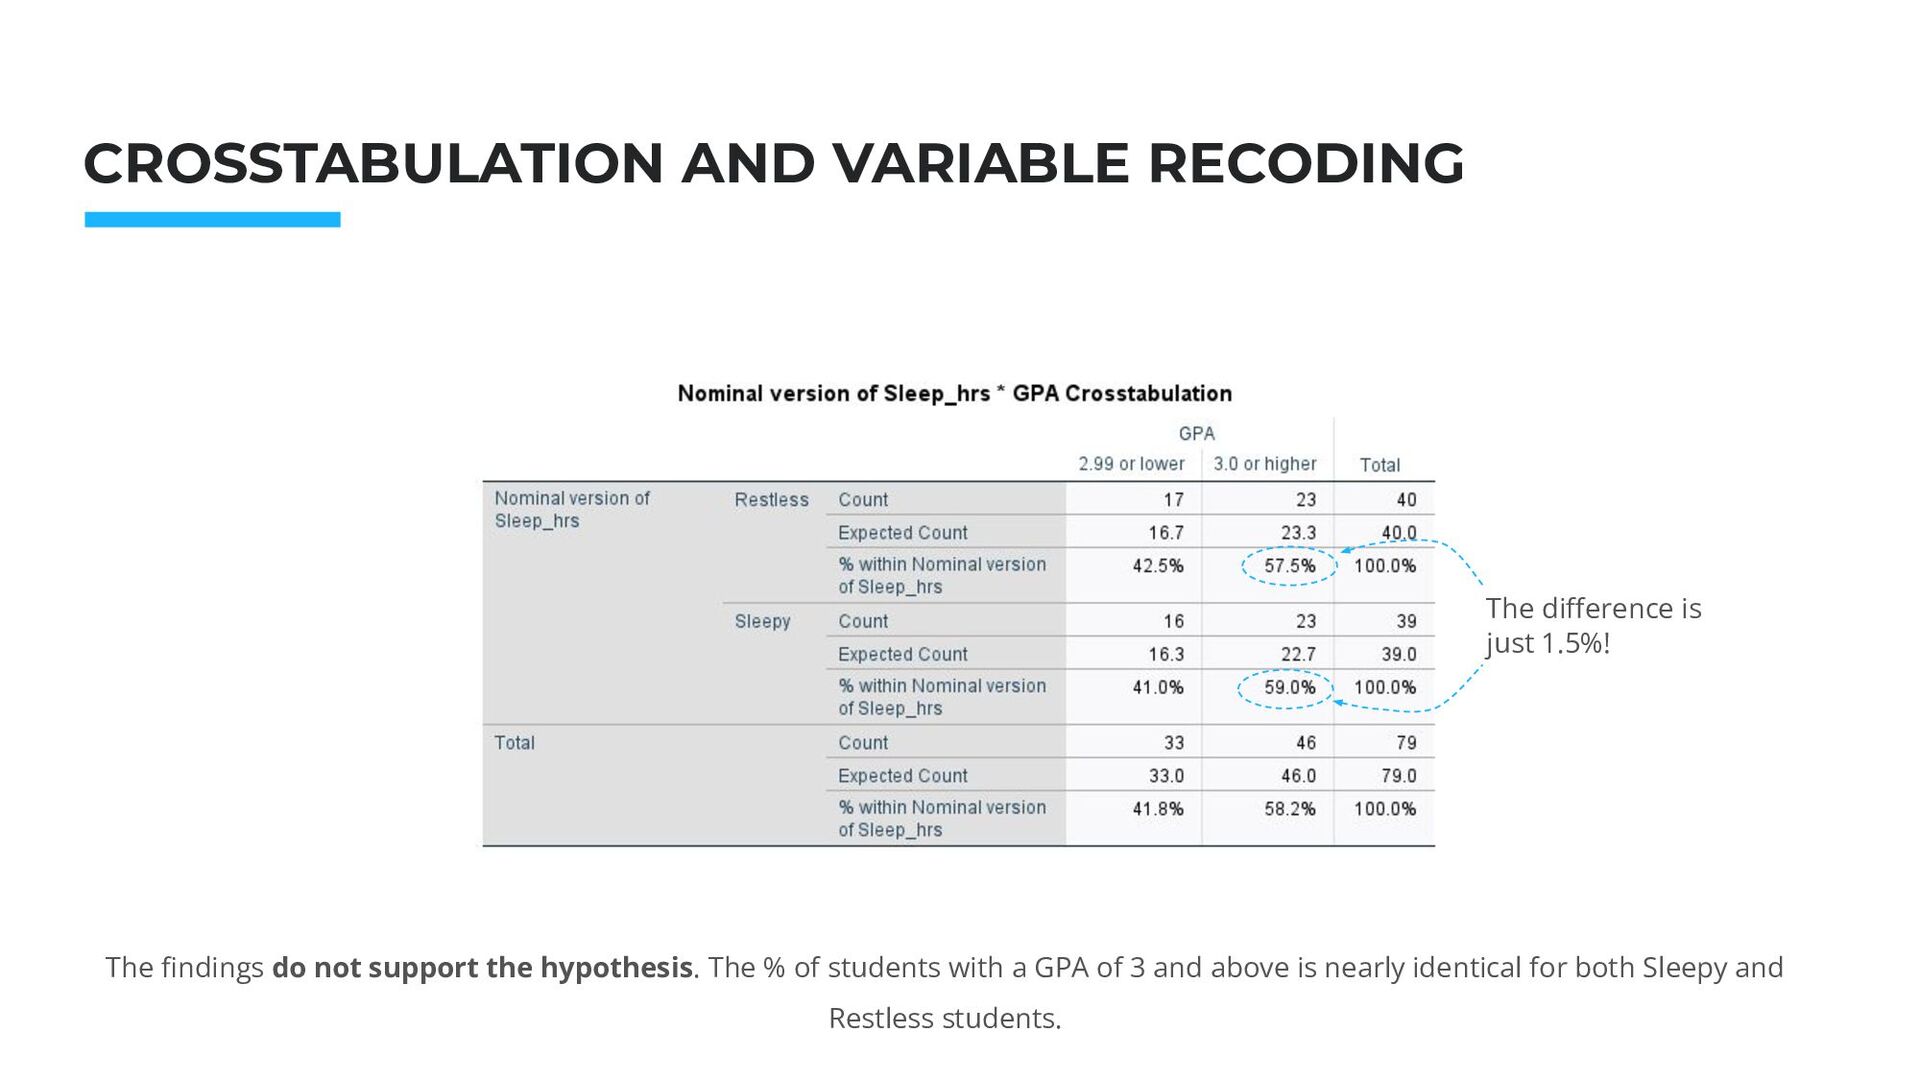
is usually indicated as the ideal number of hours of sleep per night. Based on this information, let’s create 2 segments. In formula: ▪ If Sleep_hrs <= 7.5, then Sleep_new = “Restless” ▪ If Sleep_hrs => 8, then Sleep_new = “Sleepy”
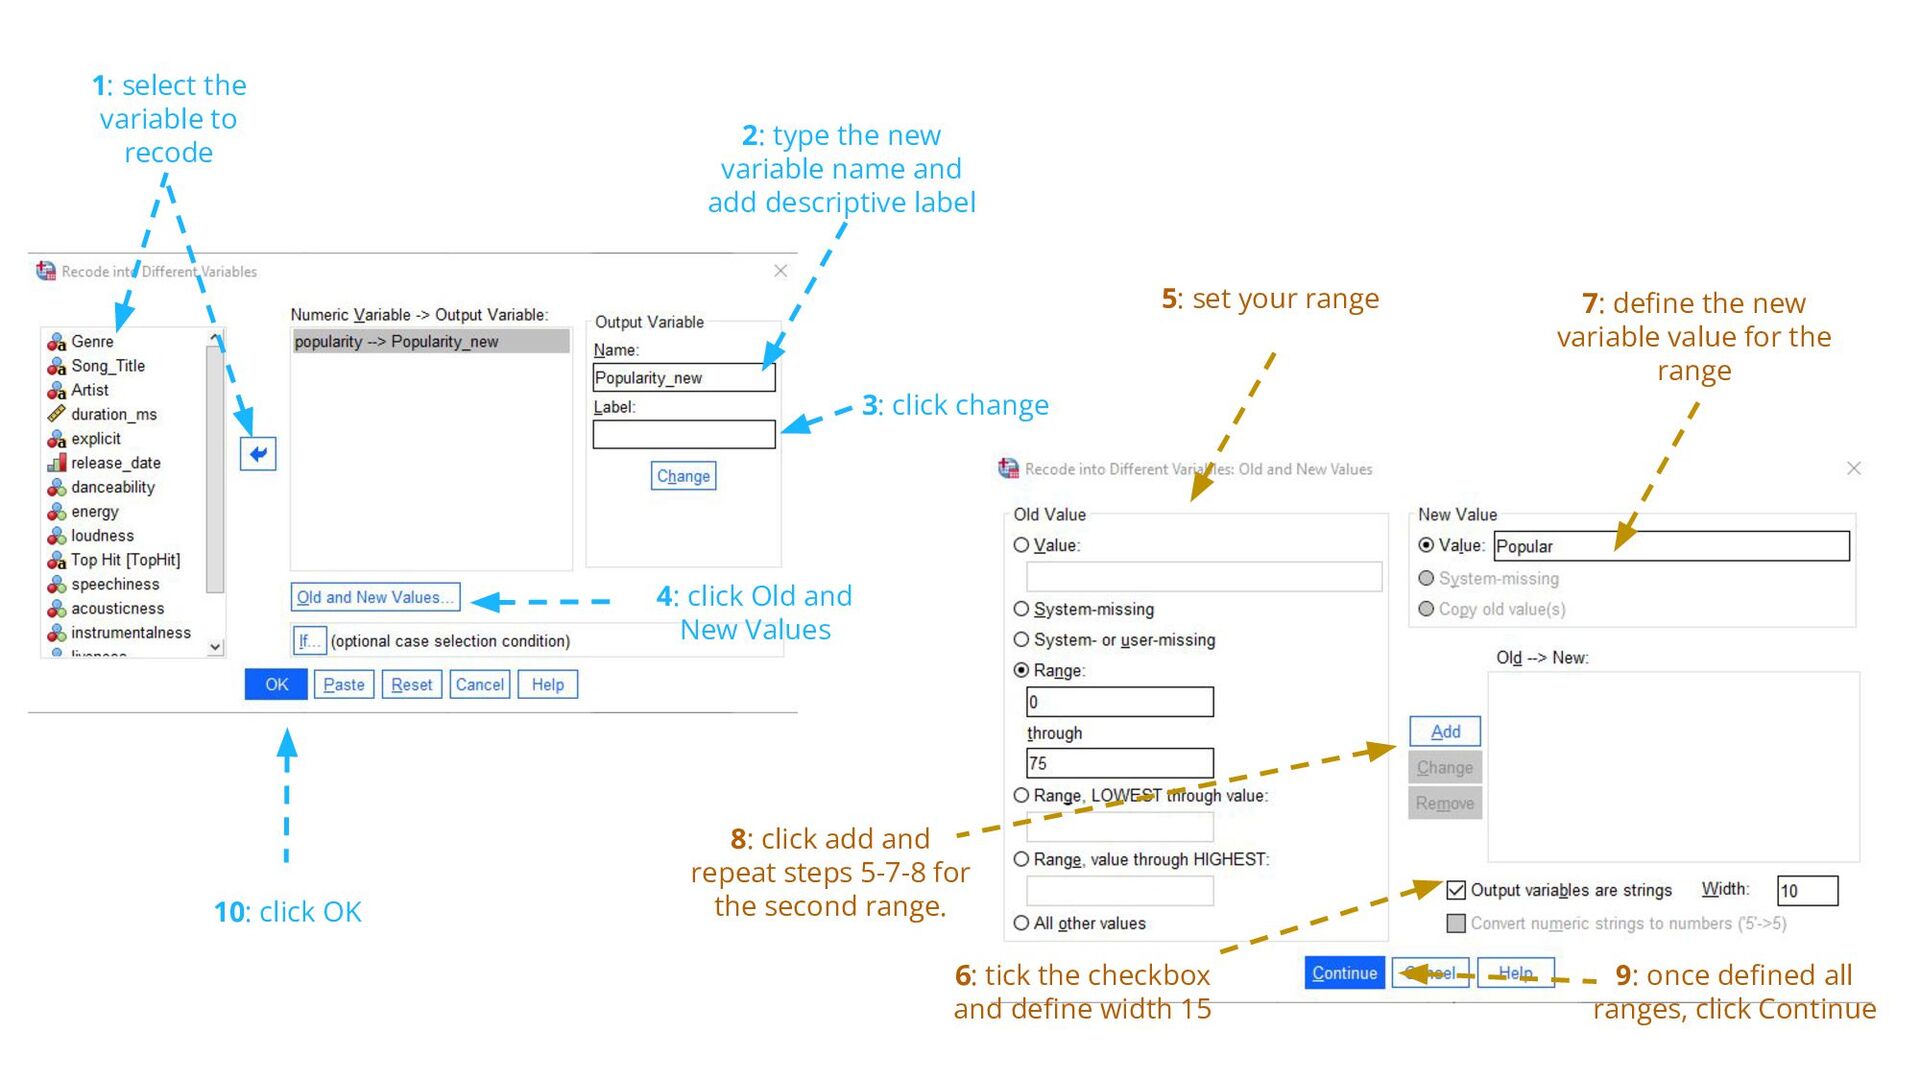
recode 2: type the new variable name and add descriptive label 3: click change 4: click Old and New Values 5: set your range 6: tick the checkbox and define width 15 7: define the new variable value for the range 8: click add and repeat steps 5-7-8 for the second range. 10: click OK 9: once defined all ranges, click Continue
findings do not support the hypothesis. The % of students with a GPA of 3 and above is nearly identical for both Sleepy and Restless students. The difference is just 1.5%!
the variables Gender (independent Variable) and GPA (dependent variable). Is there a relation between the two variables? Upload a screenshot of the crosstab on Canvas alongside a one sentence comment about the relation (or lack thereof) between the two variables.
![THANK YOU Alberto Lusoli [email protected] Office hour: Thursday, 12.30pm -](https://files.speakerdeck.com/presentations/d13ef635b0bb4f5e921a9ff353b0025b/slide_27.jpg)