Upgrade to Pro — share decks privately, control downloads, hide ads and more …

Making Decisions with Data: Planning for collaborative courses in data science

adam loy
April 28, 2017
43

Making Decisions with Data: Planning for collaborative courses in data science

adam loy

April 28, 2017
Tweet

Transcript

  1. Shonda Kuiper and Adam Loy Grinnell College Lawrence University Making

    Decisions with Data: Planning for collaborative courses in data science
  2. Challenges in adapting to a data rich society • Growing

    interest in data analysis • Technology has changed the discipline of statistics • Making decisions with data in an essential life skill
  3. Challenges in adapting to a data rich society • Growing

    interest in data analysis • Technology has changed the discipline of statistics • Making decisions with data in an essential life skill Graphic from an article appearing on March 2, 2013, on page A2 in the U.S. edition of The Wall Street Journal, with the headline: Data Crunchers Now the Cool Kids on Campus. http://online.wsj.com/article/SB10001424127887323478304578332850293360468.html?mod=WSJ_hps_RightRailColumns
  4. Students who take only an intro course are no longer

    equipped to apply the more relevant statistical methods in their own work1 “We may be living in the early twenty-first century, but our curriculum is still preparing students for applied work typical of the first half of the twentieth century2” Are our courses really teaching students how to extract meaning from data? “Curricula in statistics have been based on a now outdated notion …at every level of study, gaining statistical expertise has required extensive coursework, much of which appears to be extraneous to the compelling scientific problems students are interested in solving.3” 1Suzanne Switzer and Nick Horton. (2007) “What Your Doctor Should Know about Statistics (but Perhaps Doesn't).” Chance. 20(1): 17-21. Challenges in adapting to the age of big data 3Brown, E., and Kass. R., (2009), “What is Statistics”, The American Statistician. May 1, 2009, 63(2): 105-110. 2Cobb, G. (2007) “The Introductory Statistics Course: A Ptolemaic Curriculum?”,Technology Innovations in Statistics Education: Vol. 1: No. 1,
  5. Busses are very easy to use, you just need to

    know which bus to get on, where to get on, and where to get off. Cars on the other hand require much more work, you need to have some type of map or directions (even if the map is in your head), you need to put gas in every now and then, you need to know the rules of the road. The big advantage of the car is that it can take you a bunch of places that the bus does not go and it is quicker for some trips that would require transferring between busses. 5 Data Enthusiasts Versus Data Scientists Adapted from http://tolstoy.newcastle.edu.au/R/help/06/05/27021.html
  6. Using this analogy, some programs are busses, easy to use

    for the standard things, but very frustrating if you want to do something that is not already preprogrammed. R is a 4-wheel drive SUV (though environmentally friendly) with a bike on the back, a kayak on top, good walking and running shoes in the passenger seat, and mountain climbing and spelunking gear in the back. R can take you anywhere you want to go if you take time to learn how to use the equipment, but that is going to take longer than learning where the bus stops are. 6 Data Enthusiasts Versus Data Scientists Adapted from http://tolstoy.newcastle.edu.au/R/help/06/05/27021.html
  7. Teach how to “think with data” by having students work

    with real- world, unstructured datasets and train them to better communicate nuanced statistical ideas. Practice using all steps of the scientific method to tackle real research questions. All too often, undergraduate statistics majors are handed a “canned” data set and told to analyze it using the methods currently being studied. This approach may leave them unable to solve more complex problems out of context. Formulate good questions, consider whether available data are appropriate for addressing the problem, choose from a set of different tools, undertake the analyses in a reproducible manner, assess the analytic methods, draw appropriate conclusions, and communicate results. 7 2014 Curriculum Guidelines for Undergraduate Programs in Statistical Science http://www.amstat.org/education/curriculumguidelines.cfm
  8. Start with a modern and engaging question. Have students find

    and collect data that interests them. Teach core technical skills Workshop style inside the classroom for beginning courses Online versions for more advanced students to do outside the classroom Create tutorials that allow students to experiment with the data, find their own patterns, and ask their own questions. Students learn to handle larger/messier datasets. Students have input on what questions are asked. Technology allows for students of all abilities to get involved, but is easily adaptable for more advanced students. Simple reports can work very effectively using the code provided, but the activity also allows for more advanced statistical analysis and research questions. R Tutorial Goals .
  9. Sample Tutorial How can we use R to visualize data?

    Data Information on the sales of individual residential properties in Ames, Iowa from 2006 to 2010 2,930 houses Strategy Explore the recipes for common graphs 9
  10. Sample Tutorial 10 Example Recipe ggplot(data = AmesHousing) + geom_point(mapping

    = aes(x = Gr.Liv.Area, y = SalePrice)) ggplot(data = <data_set>) + graph_type(variables_selected(x = <x_var>, y = <y_var>))
  11. Sample Tutorial 11 Example Recipe ggplot(data = AmesHousing) + geom_density(mapping

    = aes(x = SalePrice, color = Fireplace2, fill = Fireplace2)) ggplot(data = <data_set>) + graph_type(variables_selected(x = <x_var>, color = <var>, fill = <var>))
  12. On Your Own 12 Example ggplot(data = AmesHousing) + geom_density(mapping

    = aes(x = Gr.Liv.Area, color = Fireplace2, fill = Fireplace2)) + scale_fill_viridis(discrete = TRUE) + scale_color_viridis(discrete = TRUE) Example: Making maps (http://bit.ly/R_maps_tutorial)
  13. Sample Case Study Is a MLB team’s payroll related to

    their success? Win-loss record? Reaching the playoff? Winning the World Series? What data are needed? Team payroll Indicator of a playoff berth Indicator of winning the World Series What data are available? 26 tables in Sean Lahman’s database1 Player-focused: biographical info, batting, pitching, fielding, salaries, etc. Team-focused: yearly stats, franchise info, post season series info, etc. 13 1Lahman, S. (2016) Lahman’s Baseball Database, 1871-2015, Main page, http://seanlahman.com/baseball-archive/statistics/
  14. Sample Case Study Technical challenges Accessing data in a SQL

    database Utilizing data sources at different resolutions (player vs. team) Communicating findings Guidance Tutorials on data visualization, data wrangling, merging Recipes for accessing SQL via R 14
  15. 15

  16. Student Research Questions Building upon current knowledge students can ask

    their own questions, such as • Can money buy a World Series Championship? • What impact did steroid use have on the slugging percentage? • How have the number of movies passing the Bechdel Test changed over time? 16
  17. Exploring Racial Disparities in New York City's Stop-and-Frisk Policies 17

    • New York City’s Stop-and-Frisk policies gave police officers the right to stop, search, or arrest any suspicious person with reasonable grounds for action. People stop more than 1 million people on the street. http://www.nbcnews.com/id/33230464/#.VyttSIQrLIU NEW YORK CITY BAR ASSOCIATION REPORT ON THE NYPD‘S STOP-AND-FRISK POLICY (page 10) http://www2.nycbar.org/pdf/report/uploads/20072495-S
  18. NYPD Stops and Arrests Are their different arrest patterns for

    people of a different race, sex, or type of suspected crime? Force as a percentage of arrests
  19. NYPD Stops and Arrests Are their different arrest patterns for

    people of a different race, sex, or type of suspected crime?
  20. Exploring Racial Disparities in New York City's Stop-and-Frisk Policies 20

    • New York City’s Stop-and-Frisk policies gave police officers the right to stop, search, or arrest any suspicious person with reasonable grounds for action. People stop more than 1 million people on the street. http://www.nbcnews.com/id/33230464/#.VyttSIQrLIU NEW YORK CITY BAR ASSOCIATION REPORT ON THE NYPD‘S STOP-AND-FRISK POLICY (page 10) http://www2.nycbar.org/pdf/report/uploads/20072495-S • “Civil liberties groups say the practice is racist and fails to deter crime.” • “The NYPD has defended the…policy on the ground that most stops are conducted in high-crime neighborhoods with high concentrations of people of color.”
  21. NYPD Stops and Arrests Develop your own question with this

    dataset (you may restrict your question to just one precinct). In small groups, create a one page report with an appropriate graphic that you can share with the rest of the class. http://shiny.grinnell.edu/NYPD_Basic/
  22. Designed for Flexibility Introductory-level courses (in class) Used in first-year

    tutorial classes for students with no background at Grinnell Used as labs for intro stats at Lawrence Advanced courses Online resources at Grinnell for statistical modeling course (out of class) Homework assignments at Lawrence for data science course (out of class) In-class examples in data science course at Carleton 23
  23. Assessment and Evaluation Compared to your other courses at this

    institution, to what extent have the R tutorials… 24
  24. Student Comments R was difficult to work with at first,

    but once we mastered the basics it was a huge help. Great way to get a more hands-on approach to statistics and visualize results. R makes the tiny little steps of statistics that are hard to remember easy. When I realized that this course [required] coding, I was daunted as I had no prior computer science experience. However, the R tutorials made this much easier for me and I am now comfortable using R for the types of problems that we have worked through in class. In fact, I have been able to use R for other classes now largely because of the help provided with the R tutorials and R manual descriptions. 25
  25. Incorporating Research Activities into the Undergraduate Curriculum 26 Individualized questions

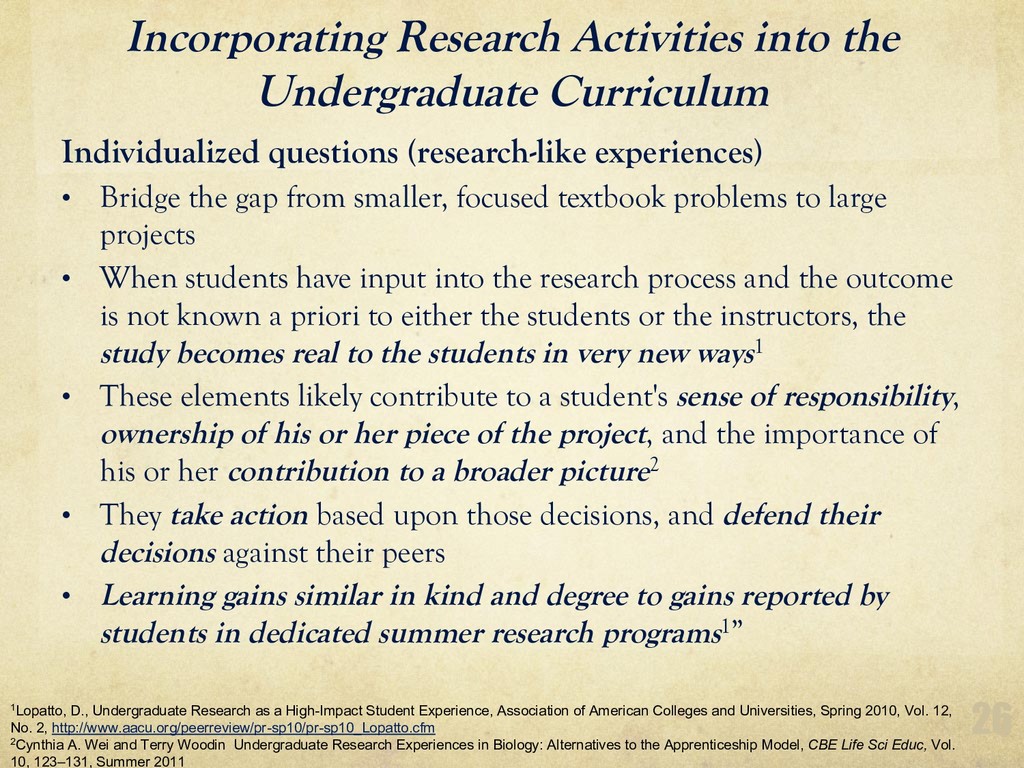
    (research-like experiences) • Bridge the gap from smaller, focused textbook problems to large projects • When students have input into the research process and the outcome is not known a priori to either the students or the instructors, the study becomes real to the students in very new ways1 • These elements likely contribute to a student's sense of responsibility, ownership of his or her piece of the project, and the importance of his or her contribution to a broader picture2 • They take action based upon those decisions, and defend their decisions against their peers • Learning gains similar in kind and degree to gains reported by students in dedicated summer research programs1” 1Lopatto, D., Undergraduate Research as a High-Impact Student Experience, Association of American Colleges and Universities, Spring 2010, Vol. 12, No. 2, http://www.aacu.org/peerreview/pr-sp10/pr-sp10_Lopatto.cfm 2Cynthia A. Wei and Terry Woodin Undergraduate Research Experiences in Biology: Alternatives to the Apprenticeship Model, CBE Life Sci Educ, Vol. 10, 123–131, Summer 2011
  26. Next Steps Ongoing maintenance Polish and publish the case studies

    on the website Pull in other online resources (e.g. DataCamp) Add new tutorials Create instructor resources Use to create new courses in data science Share our experiences with the statistics education community 27
  27. Shonda Kuiper and Adam Loy Grinnell College Lawrence University Making

    Decisions with Data: Planning for collaborative courses in data science http://bit.ly/ds4stats_Rtutorials