Upgrade to Pro — share decks privately, control downloads, hide ads and more …

Introduction to Power BI

Avatar for Anas Farah Anas Farah
April 10, 2019
54

Introduction to Power BI

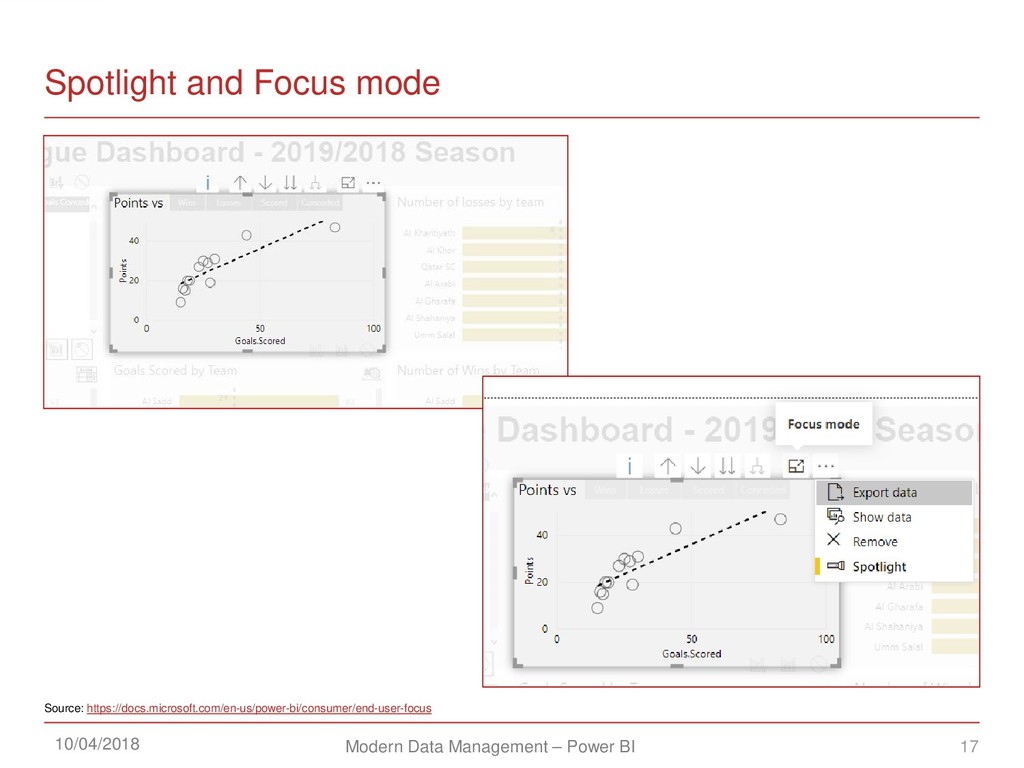
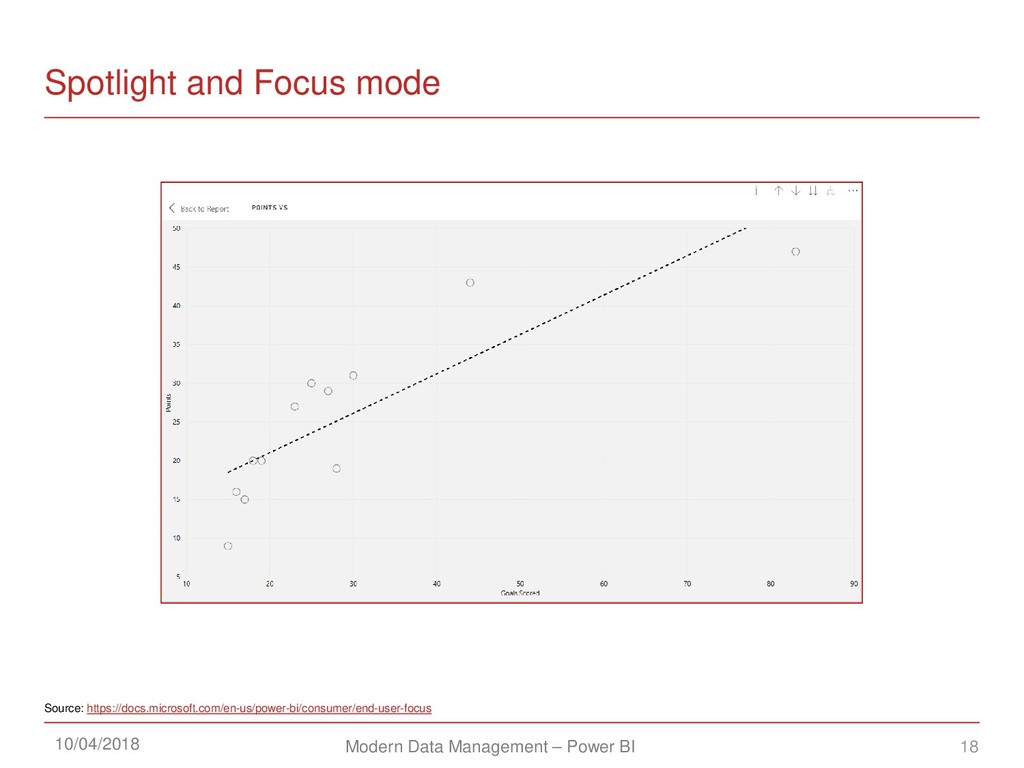
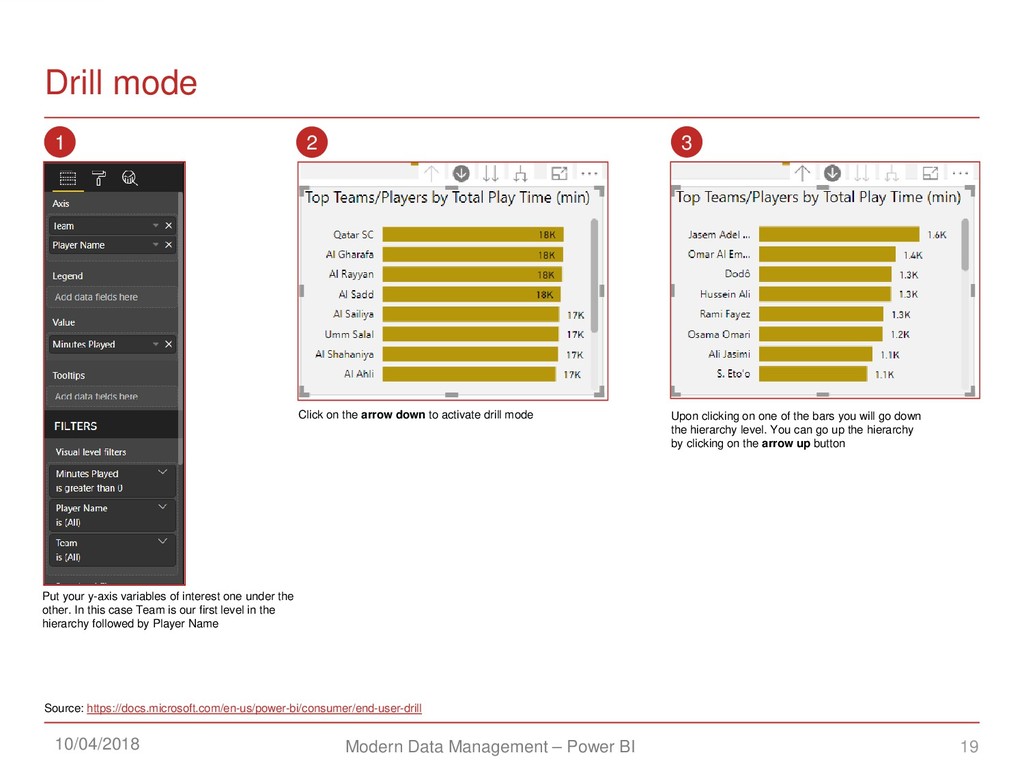
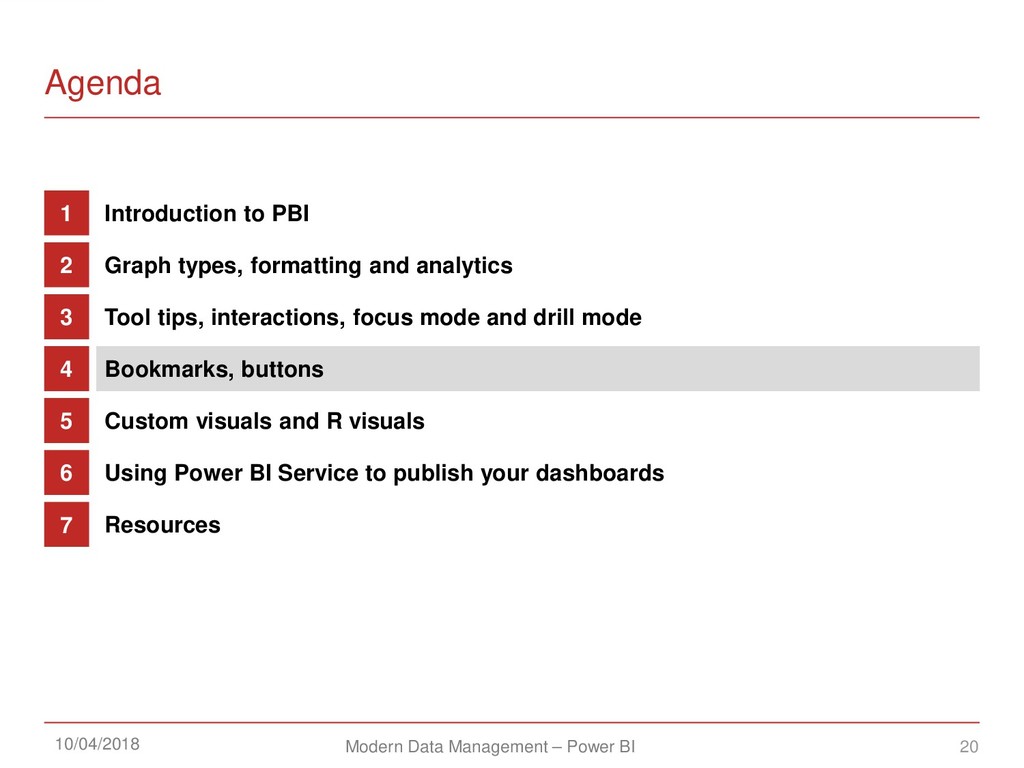
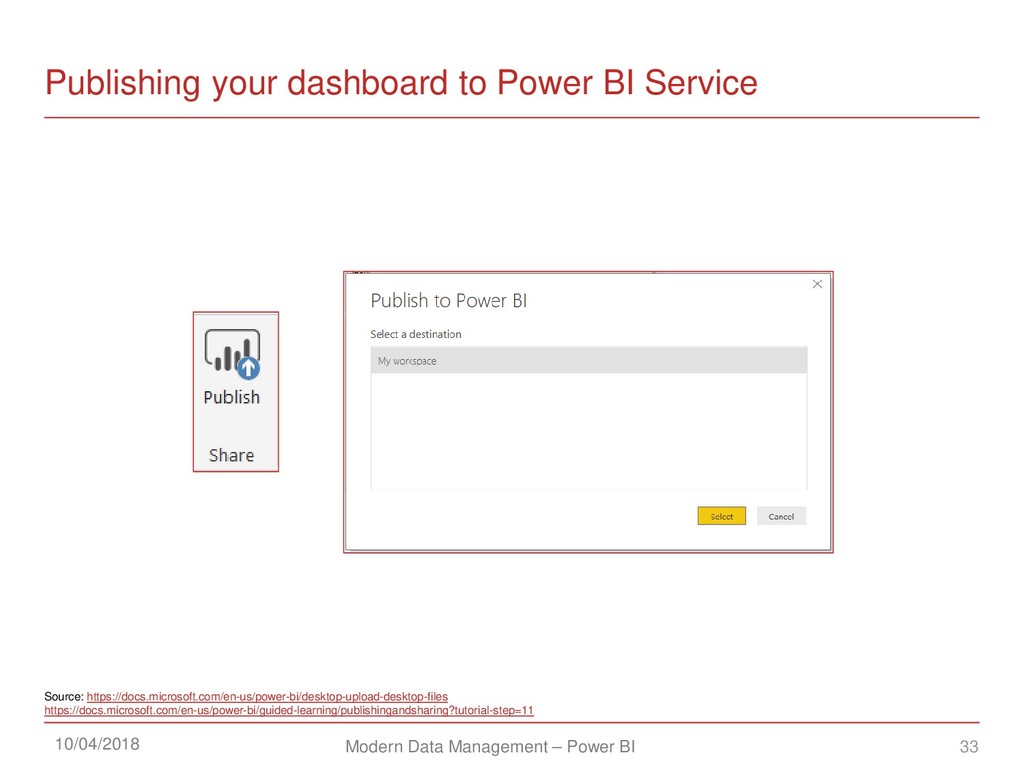
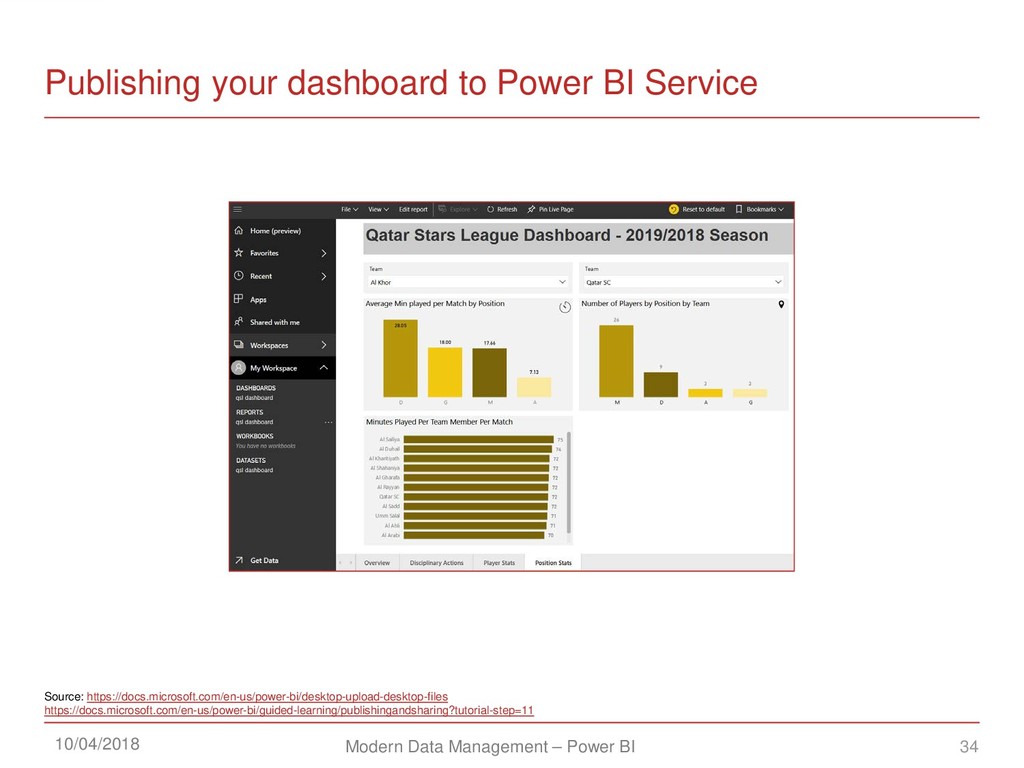
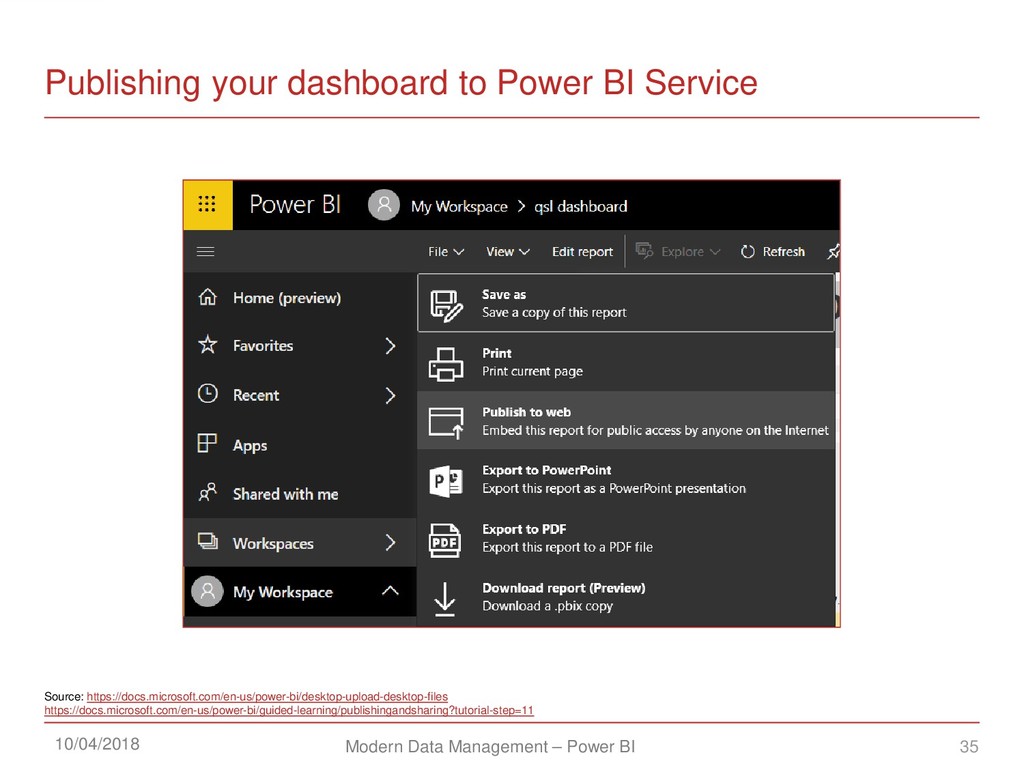
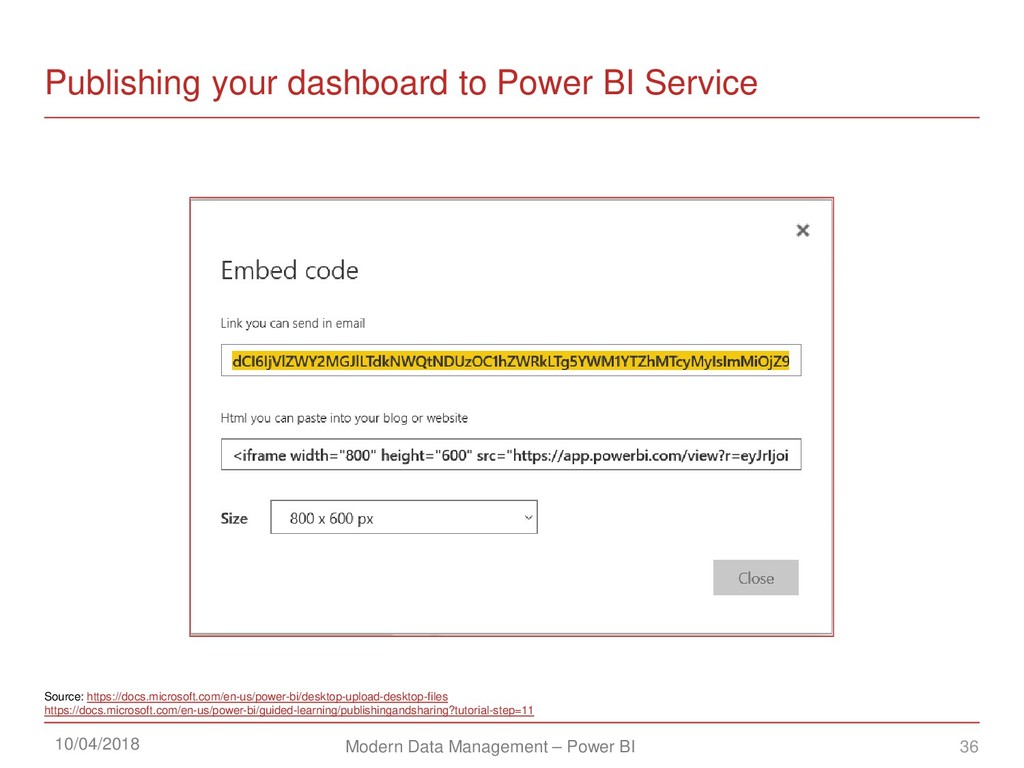
These slide were produced and presented during a workshop for the Modern Data Management class held at Carnegie Mellon University in Qatar in Spring of 2019. The goal was to take students from zero to creating a full fledged interactive dashboard using Power BI.

Avatar for Anas Farah

Anas Farah

April 10, 2019
Tweet

Transcript

  1. 2 Modern Data Management – Power BI 10/04/2018 Resources 7

    Using Power BI Service to publish your dashboards 6 Custom visuals and R visuals 5 Bookmarks, buttons 4 Tool tips, interactions, focus mode and drill mode 3 Graph types, formatting and analytics 2 Introduction to PBI 1 Agenda
  2. 3 Modern Data Management – Power BI 10/04/2018 Resources 7

    Using Power BI Service to publish your dashboards 6 Custom visuals and R visuals 5 Bookmarks, buttons 4 Tool tips, interactions, focus mode and drill mode 3 Graph types, formatting and analytics 2 Introduction to PBI 1 Agenda
  3. 4 Modern Data Management – Power BI 10/04/2018 Pre-requisites You

    will need the following installed on your computer  Power BI Desktop https://www.microsoft.com/en-us/download/details.aspx?id=45331  Power BI Service Account to publish your dashboards online (use your CMU Qatar email) https://powerbi.microsoft.com/en-us/landing/signin/  R and R Studio  https://www.rstudio.com/products/rstudio/download/#download (Makes using R easier)  https://www.r-project.org/  The following R Packages: tidyverse, corrgram  The slide footnotes contain links to pages for further information on the slide content  Link to QSL sample data file: https://tinyurl.com/y4b9tk62  Link to Power BI file: https://tinyurl.com/y6m566kg Source: https://www.datacamp.com/community/tutorials/r-packages-guide
  4. 5 Modern Data Management – Power BI 10/04/2018 Some points

    on Power BI vs Excel There are certain trade-offs that come with using Power BI  Less flexibility, especially with data wrangling as Power BI requires the use of DAX  Power BI is not an Excel replacement:  Focus is on integration of multiple data sources: CRM, ERP, Relational DB etc  Focus is on streamed data vs static data  Focus is on visually rich dashboards instead of data wrangling  Not as mature or widely adopted as Excel or certain competitors like Tableau, Spotfire or Qlikeview. A number of features are still experimental (preview mode) i.e: R/Python support or are only supported on the premium version. For more information on features: https://powerbi.microsoft.com/en-us/blog/category/announcements/
  5. 6 Modern Data Management – Power BI 10/04/2018 Loading data

    into Power BI 1 2 3 4 Source: https://docs.microsoft.com/en-us/power-bi/desktop-getting-started
  6. 7 Modern Data Management – Power BI 10/04/2018 Resources 7

    Using Power BI Service to publish your dashboards 6 Custom visuals and R visuals 5 Bookmarks, buttons 4 Tool tips, interactions, focus mode and drill mode 3 Graph types, formatting and analytics 2 Introduction to PBI 1 Agenda
  7. 8 Modern Data Management – Power BI 10/04/2018 Graph types

    Visualizations pane includes a number of commonly used graphs  Stacked Bar Chart, Column Bar Chart, Scatterplots, Line Charts etc  R/Python Visuals  Tables and Matrices  Custom Visuals  Marimekko, Funnel Charts, Waterfall Charts  Slicers  Maps etc.  Clicking on the three dots will take you to the Power BI marketplace where you can find more custom visuals Visualization types Source: https://docs.microsoft.com/en-us/power-bi/visuals/power-bi-report-add-visualizations-i https://docs.microsoft.com/en-us/power-bi/visuals/power-bi-report-add-visualizations-ii https://docs.microsoft.com/en-us/power-bi/visuals/power-bi-visualization-customize-title-background-and-legend
  8. 9 Modern Data Management – Power BI 10/04/2018 Using Graph

    Analytics Features 1 2 Average Line  The graph analytics contains the following summary statistics lines. Certain time series graph support forecasting:  Average  Min & Max  Std. Deviation  Constant line  Median  Percentile based lines Graph Analytics Lines Source: https://docs.microsoft.com/en-us/power-bi/desktop-analytics-pane
  9. 10 Modern Data Management – Power BI 10/04/2018 Using Graph

    Analytics Features - Forecasting using Exponential Smoothing 1 2 The forecasting features use exponential smoothing to forecast next period(s). This function requires at least 6 data points and can only forecast a single time series at a time. Set the number of periods you want to forecast in the forecast length. Chose the seasonality figure based on your assessment of the seasonality of the data Source: https://docs.microsoft.com/en-us/power-bi/desktop-analytics-pane https://www.youtube.com/watch?v=XIlPkyyztho
  10. 11 Modern Data Management – Power BI 10/04/2018 Special Case:

    Tornado Chart  Certain types of graphs such as the Tornado Chart (accessible from the marketplace) require some data transformation to work, usually that involves un-pivoting the data columns Source: https://www.youtube.com/watch?v=e3tcV7SrRok
  11. 12 Modern Data Management – Power BI 10/04/2018 Resources 7

    Using Power BI Service to publish your dashboards 6 Custom visuals and R visuals 5 Bookmarks, buttons 4 Tool tips, interactions, focus mode and drill mode 3 Graph types, formatting and analytics 2 Introduction to PBI 1 Agenda
  12. 13 Modern Data Management – Power BI 10/04/2018 Tool Tips

    1 2 Source: https://docs.microsoft.com/en-us/power-bi/desktop-tooltips Default Power BI Tools Tips Power BI page based tool tip. Useful for visually richer content
  13. 14 Modern Data Management – Power BI 10/04/2018 Creating custom

    tooltips 1 2 3 4 Create a new page to store your tool tip In the formatting tab, set the page as a tooltip page by turning on the tool tip option Set the page size as a tool tip Fit the page to the actual size in order to have a better idea of the final overall look as you design your tool tip Source: https://docs.microsoft.com/en-us/power-bi/desktop-tooltips
  14. 15 Modern Data Management – Power BI 10/04/2018 Creating custom

    tooltips Source: https://docs.microsoft.com/en-us/power-bi/desktop-tooltips 5 Design your tooltip like any other page 6 Select the graph that you want to link to the new tool tip, click on the formatting tab, turn on tooltip and chose Report page as type 7 Chose the tooltip you want to link to your graph from the list of tooltips you designed
  15. 16 Modern Data Management – Power BI 10/04/2018 Interactions 1

    2 3 Select the object who’s interactions you want to edit From the Format tab, click on Edit Interactions button With your original object still selected, a new set of buttons will appear on the other objects when you hover over them. Each icon sets a different interaction type No Interaction between the two objects Filter second object based on the first object Highlight Second object based on first 1 2 3 3 1 2 Source: https://docs.microsoft.com/en-us/power-bi/service-reports-visual-interactions
  16. 17 Modern Data Management – Power BI 10/04/2018 Spotlight and

    Focus mode Source: https://docs.microsoft.com/en-us/power-bi/consumer/end-user-focus
  17. 18 Modern Data Management – Power BI 10/04/2018 Spotlight and

    Focus mode Source: https://docs.microsoft.com/en-us/power-bi/consumer/end-user-focus
  18. 19 Modern Data Management – Power BI 10/04/2018 Drill mode

    1 2 3 Put your y-axis variables of interest one under the other. In this case Team is our first level in the hierarchy followed by Player Name Click on the arrow down to activate drill mode Upon clicking on one of the bars you will go down the hierarchy level. You can go up the hierarchy by clicking on the arrow up button Source: https://docs.microsoft.com/en-us/power-bi/consumer/end-user-drill
  19. 20 Modern Data Management – Power BI 10/04/2018 Resources 7

    Using Power BI Service to publish your dashboards 6 Custom visuals and R visuals 5 Bookmarks, buttons 4 Tool tips, interactions, focus mode and drill mode 3 Graph types, formatting and analytics 2 Introduction to PBI 1 Agenda
  20. 21 Modern Data Management – Power BI 10/04/2018 Resources 7

    Using Power BI Service to publish your dashboards 6 Custom visuals and R visuals 5 Bookmarks, buttons 4 Tool tips, interactions, focus mode and drill mode 3 Graph types, formatting and analytics 2 Introduction to PBI 1 Agenda
  21. 22 Modern Data Management – Power BI 10/04/2018 Custom R

    Visuals List of supported R Packages: https://docs.microsoft.com/en-us/power-bi/service-r-packages-support
  22. 23 Modern Data Management – Power BI 10/04/2018 Custom R

    Visuals R visuals require that your variables are not summarized. If your visuals don’t render it’s very likely you forget to select Don’t summarize
  23. 24 Modern Data Management – Power BI 10/04/2018 Custom R

    Visuals Power BI will automatically create a data frame from the loaded variables. Those green lines are not R comments but code that Power BI runs before your script so don’t delete them. You can now run your run code and see its output
  24. 25 Modern Data Management – Power BI 10/04/2018 Creating a

    heatmap with R Script visuals library(dplyr) #we use dplyr to filter our dataset columns dataset <- data.frame(dataset, row.names = dataset$Team) #set the row names for our data frame dataset <- dataset %>% select(1:4) #filter our dataframe data <- as.matrix(dataset) #transform our dataframe into a numeric matrix heatmap(data, Colv=NA, Rowv=NA, scale="row") #Render our heatmap
  25. 26 Modern Data Management – Power BI 10/04/2018 Creating a

    correlogram with R Script Visual library(corrgram) #load our corrgram library corrgram(dataset, order=TRUE, upper.panel=panel.pie) #Render the correlogram
  26. 27 Modern Data Management – Power BI 10/04/2018 Loading R

    Datasets Directly into Power BI 1 2 A number of R examples you will see online will make use of standard R datasets, you can replicate these tutorials by loading these datasets directly into Power BI using the R Script data import option. A list of the standard R datasets is available on this page: https://stat.ethz.ch/R-manual/R-patched/library/datasets/html/00Index.html
  27. 28 Modern Data Management – Power BI 10/04/2018 Loading R

    Datasets Directly into Power BI 3 Source: https://docs.microsoft.com/en-us/power-bi/desktop-r-in-query-editor
  28. 29 Modern Data Management – Power BI 10/04/2018 Loading R

    Datasets Directly into Power BI 4 Source: https://docs.microsoft.com/en-us/power-bi/desktop-r-in-query-editor
  29. 30 Modern Data Management – Power BI 10/04/2018 A note

    regarding radar charts in R  You might come across a package called ggradar that uses ggplot2 to make radar plots. That package is compatible with ggplot2 version 2.0.0 (2015), ggplot2 is currently on version 3.1.1 and therefore it’s unlikely that ggradar will work unless you’re running a really old version of R with old packages that are not updated.  In case you want to tinker with ggradar (good luck) this a link to the package documentation https://github.com/ricardo-bion/ggradar (note: you will have to download a lot of old, deprecated packages. Time saver tip: it’s still unlikely that you will manage to make it work)
  30. 31 Modern Data Management – Power BI 10/04/2018 A note

    on R Script Visuals/ R Custom Visuals  Currently online publication of R visuals is only supported on Power BI Service Pro: https://docs.microsoft.com/en-us/power-bi/visuals/service-r-visuals  R visuals in Power BI come in 2 shapes: R script visuals are those we can run directly from inside Power BI, while they are easier to implement you face limitations with their use relatively fast. The other class of R visuals is known as custom R visuals (i.e.: the ones available on the marketplace) and those require more thorough design and development and knowledge of R but provide greater flexibility. More information regarding the design and development of custom R visuals can be found in the following link: https://github.com/Microsoft/PowerBI-visuals  A number of packages that you see in the supported packages page can only work with R custom visuals and not with R script visuals!  For tinkering purposes here is a list of custom R visual tutorials:  https://stackoverflow.com/questions/39368729/is-it-possible-to-use-r-plotly-library-in-r- script-visual-of-power-bi/55022829#55022829  https://www.blue-granite.com/tutorials/power-bi-interactive-r-visual  http://radacad.com/interactive-map-using-r-and-power-bi-create-custom-visual-part-1  http://radacad.com/interactive-charts-using-r-and-power-bi-create-custom-visual-part-2
  31. 32 Modern Data Management – Power BI 10/04/2018 Resources 7

    Using Power BI Service to publish your dashboards 6 Custom visuals and R visuals 5 Bookmarks, buttons 4 Tool tips, interactions, focus mode and drill mode 3 Graph types, formatting and analytics 2 Introduction to PBI 1 Agenda
  32. 33 Modern Data Management – Power BI 10/04/2018 Publishing your

    dashboard to Power BI Service Source: https://docs.microsoft.com/en-us/power-bi/desktop-upload-desktop-files https://docs.microsoft.com/en-us/power-bi/guided-learning/publishingandsharing?tutorial-step=11
  33. 34 Modern Data Management – Power BI 10/04/2018 Publishing your

    dashboard to Power BI Service Source: https://docs.microsoft.com/en-us/power-bi/desktop-upload-desktop-files https://docs.microsoft.com/en-us/power-bi/guided-learning/publishingandsharing?tutorial-step=11
  34. 35 Modern Data Management – Power BI 10/04/2018 Publishing your

    dashboard to Power BI Service Source: https://docs.microsoft.com/en-us/power-bi/desktop-upload-desktop-files https://docs.microsoft.com/en-us/power-bi/guided-learning/publishingandsharing?tutorial-step=11
  35. 36 Modern Data Management – Power BI 10/04/2018 Publishing your

    dashboard to Power BI Service Source: https://docs.microsoft.com/en-us/power-bi/desktop-upload-desktop-files https://docs.microsoft.com/en-us/power-bi/guided-learning/publishingandsharing?tutorial-step=11
  36. 37 Modern Data Management – Power BI 10/04/2018 Resources 7

    Using Power BI Service to publish your dashboards 6 Custom visuals and R visuals 5 Bookmarks, buttons 4 Tool tips, interactions, focus mode and drill mode 3 Graph types, formatting and analytics 2 Introduction to PBI 1 Agenda
  37. 38 Modern Data Management – Power BI 10/04/2018 Resources For

    those of your interested in learning more about Power BI  Power BI official Microsoft course: https://tinyurl.com/jtdzn96  Product/Feature announcement and tutorials (Power BI official blog) to know the latest updates: https://powerbi.microsoft.com/en-us/blog/  Power BI Official documentation: https://docs.microsoft.com/en-us/power-bi/  Where to find help/answers for your questions:  Community forum: https://community.powerbi.com/  StackOverflow search for powerbi tag