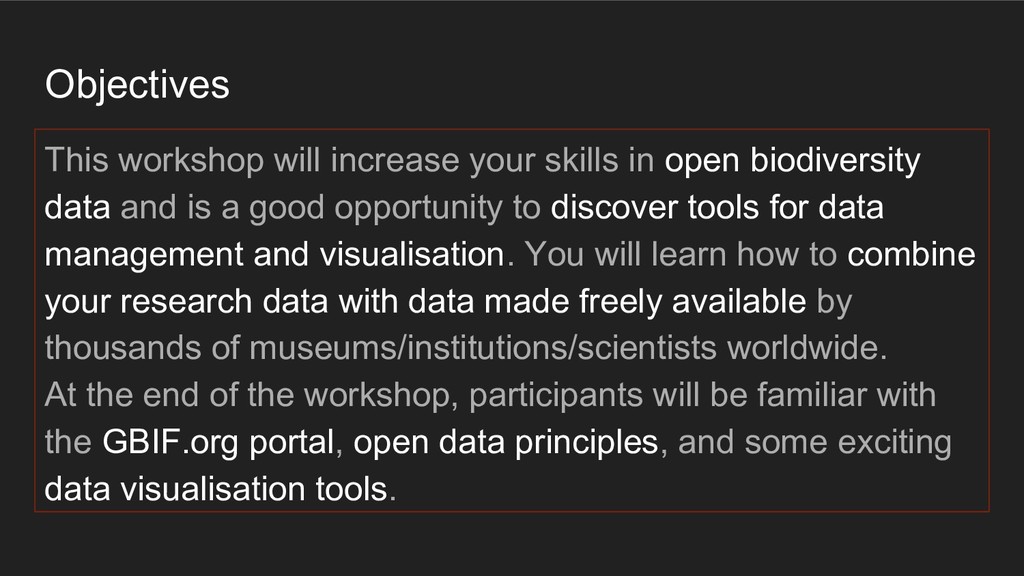
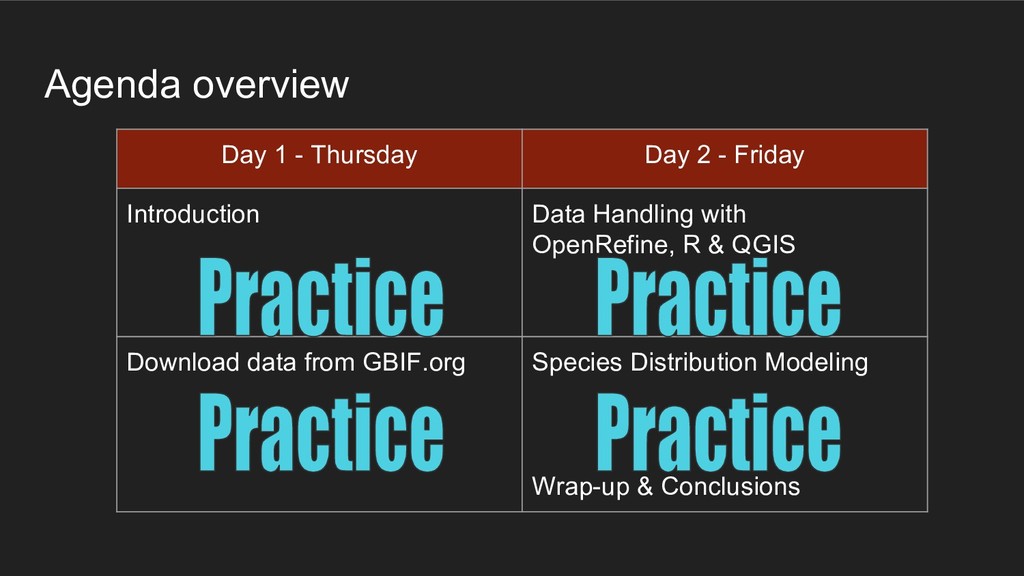
data and is a good opportunity to discover tools for data management and visualisation. You will learn how to combine your research data with data made freely available by thousands of museums/institutions/scientists worldwide. At the end of the workshop, participants will be familiar with the GBIF.org portal, open data principles, and some exciting data visualisation tools.
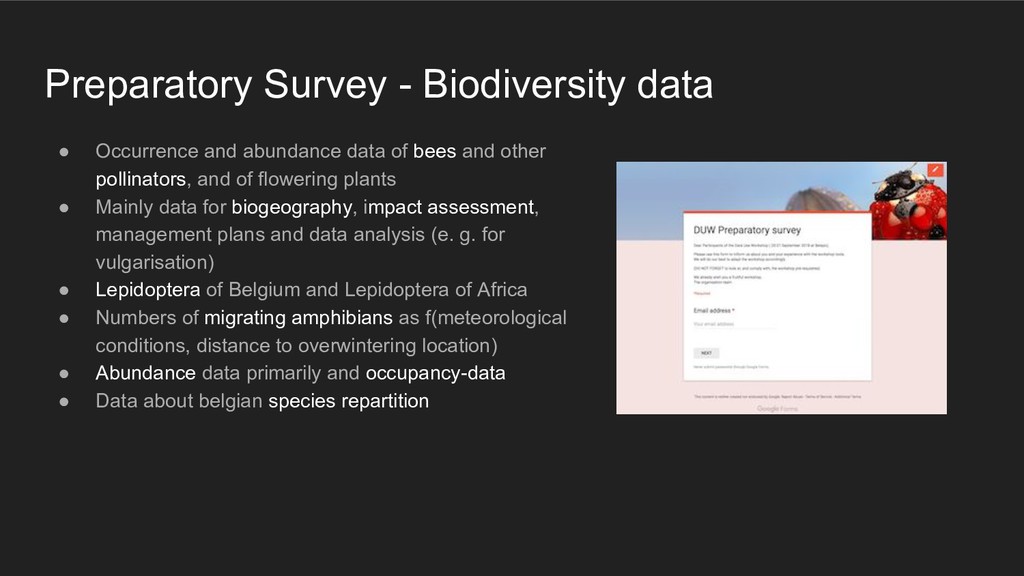
of bees and other pollinators, and of flowering plants • Mainly data for biogeography, impact assessment, management plans and data analysis (e. g. for vulgarisation) • Lepidoptera of Belgium and Lepidoptera of Africa • Numbers of migrating amphibians as f(meteorological conditions, distance to overwintering location) • Abundance data primarily and occupancy-data • Data about belgian species repartition
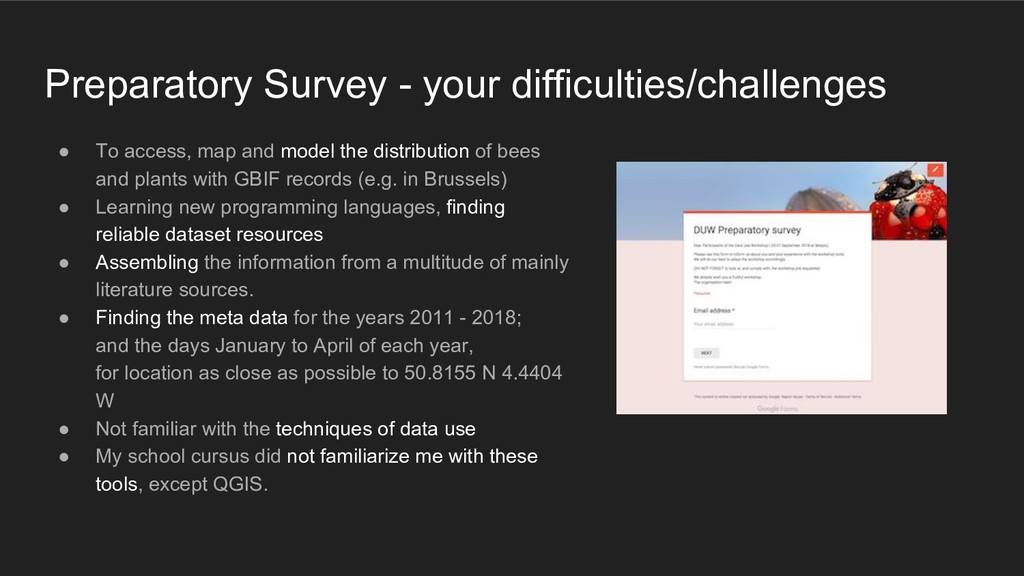
model the distribution of bees and plants with GBIF records (e.g. in Brussels) • Learning new programming languages, finding reliable dataset resources • Assembling the information from a multitude of mainly literature sources. • Finding the meta data for the years 2011 - 2018; and the days January to April of each year, for location as close as possible to 50.8155 N 4.4404 W • Not familiar with the techniques of data use • My school cursus did not familiarize me with these tools, except QGIS.
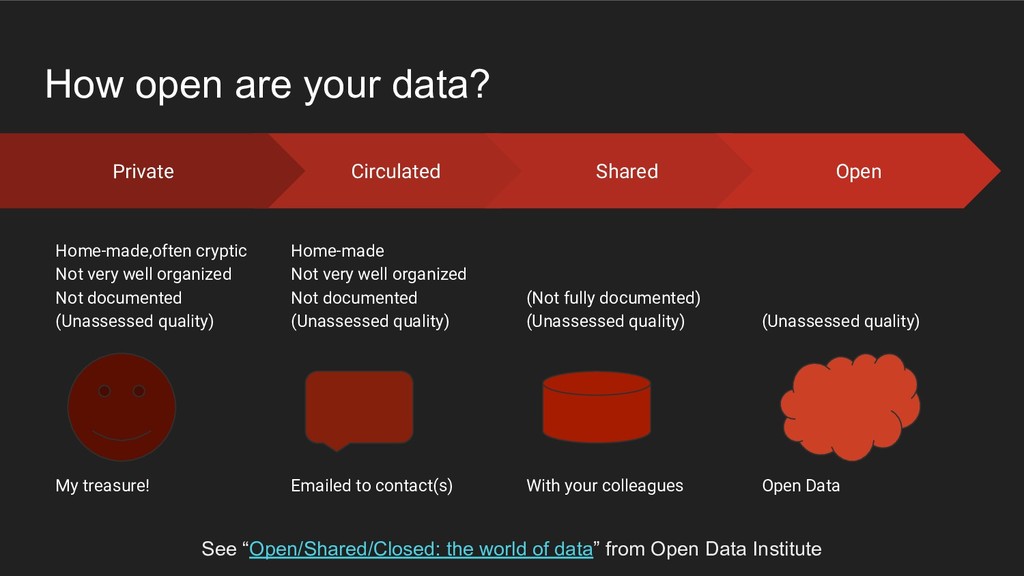
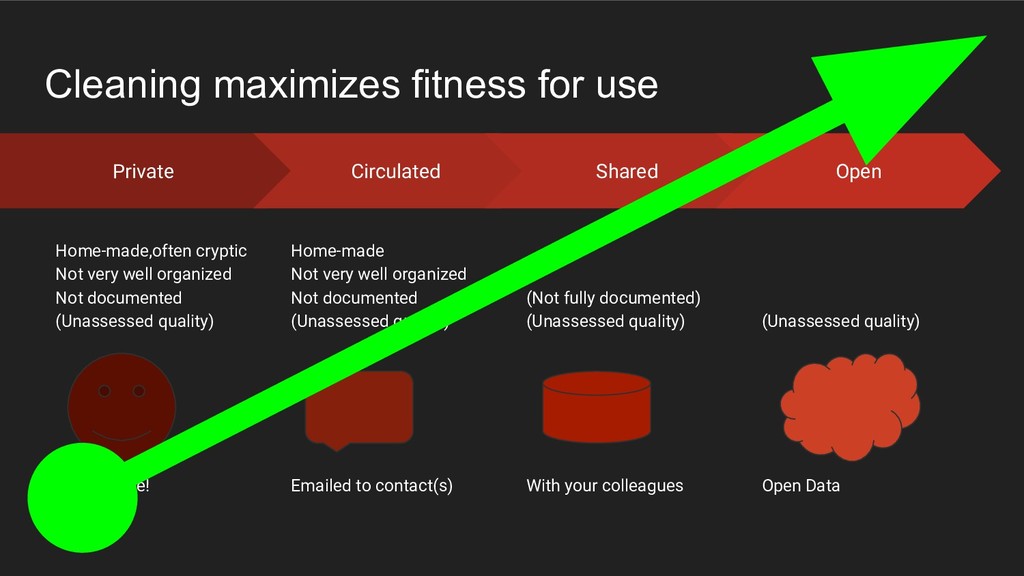
organized Not documented (Unassessed quality) Emailed to contact(s) Shared (Not fully documented) (Unassessed quality) With your colleagues Open (Unassessed quality) Open Data Private Home-made,often cryptic Not very well organized Not documented (Unassessed quality) My treasure! See “Open/Shared/Closed: the world of data” from Open Data Institute
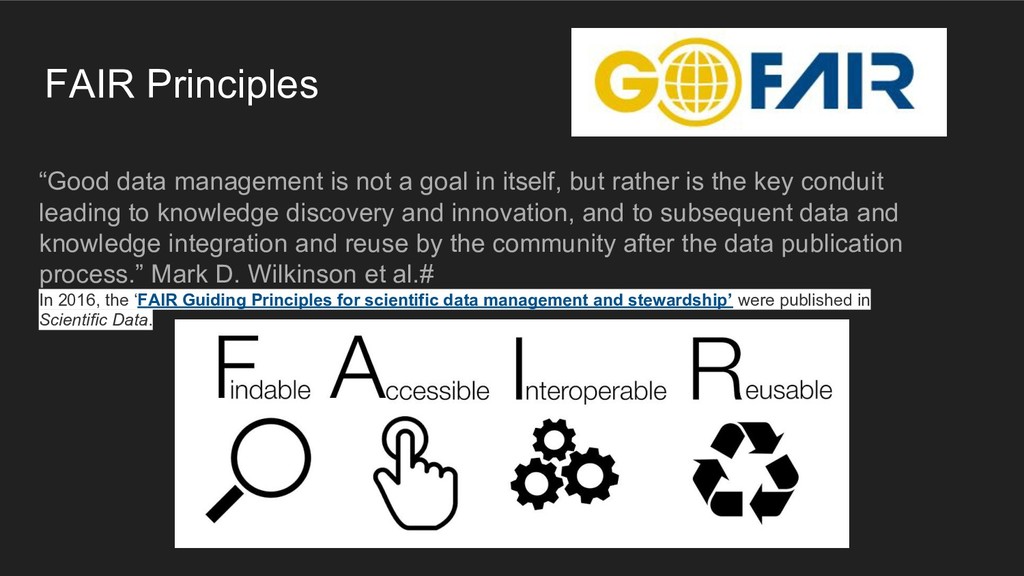
itself, but rather is the key conduit leading to knowledge discovery and innovation, and to subsequent data and knowledge integration and reuse by the community after the data publication process.” Mark D. Wilkinson et al.# In 2016, the ‘FAIR Guiding Principles for scientific data management and stewardship’ were published in Scientific Data.
color and weave of cloth, eat standard sandwiches, or live in standard rooms with standard furnishing. Homes of infinite variety of design are built with a few types of bricks, and with lumber of standard sizes, and with water and heating pipes and fitting of standard dimensions.” W. Edwards Deming “Let’s Agree to Disagree.” Standards
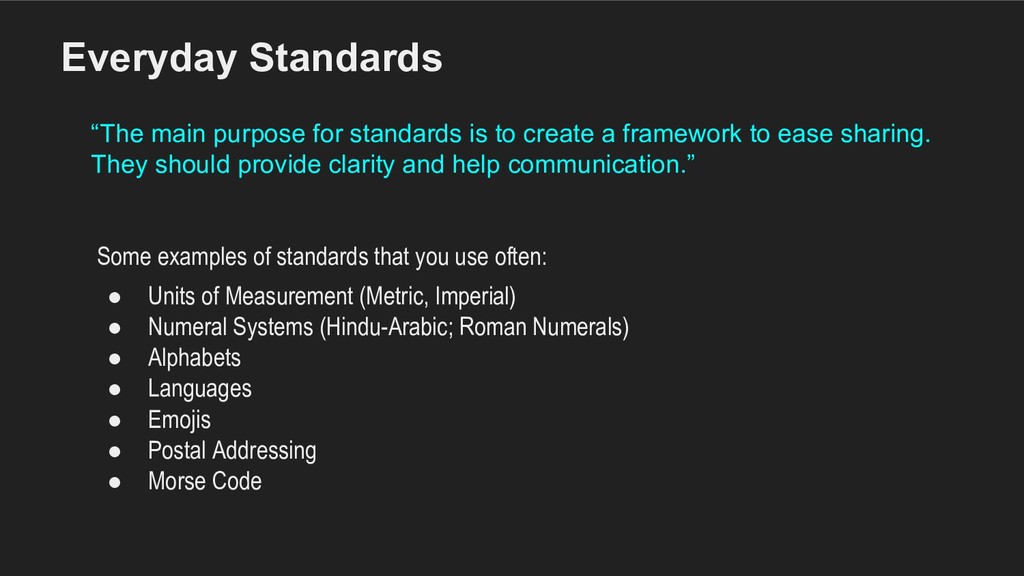
• Units of Measurement (Metric, Imperial) • Numeral Systems (Hindu-Arabic; Roman Numerals) • Alphabets • Languages • Emojis • Postal Addressing • Morse Code “The main purpose for standards is to create a framework to ease sharing. They should provide clarity and help communication.”
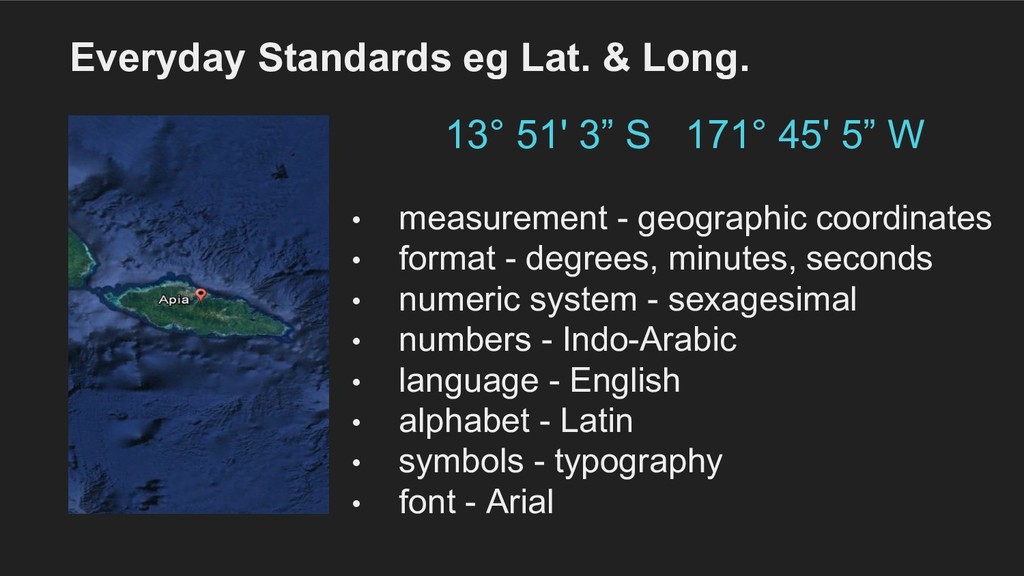
coordinates • format - degrees, minutes, seconds • numeric system - sexagesimal • numbers - Indo-Arabic • language - English • alphabet - Latin • symbols - typography • font - Arial 13° 51' 3” S 171° 45' 5” W
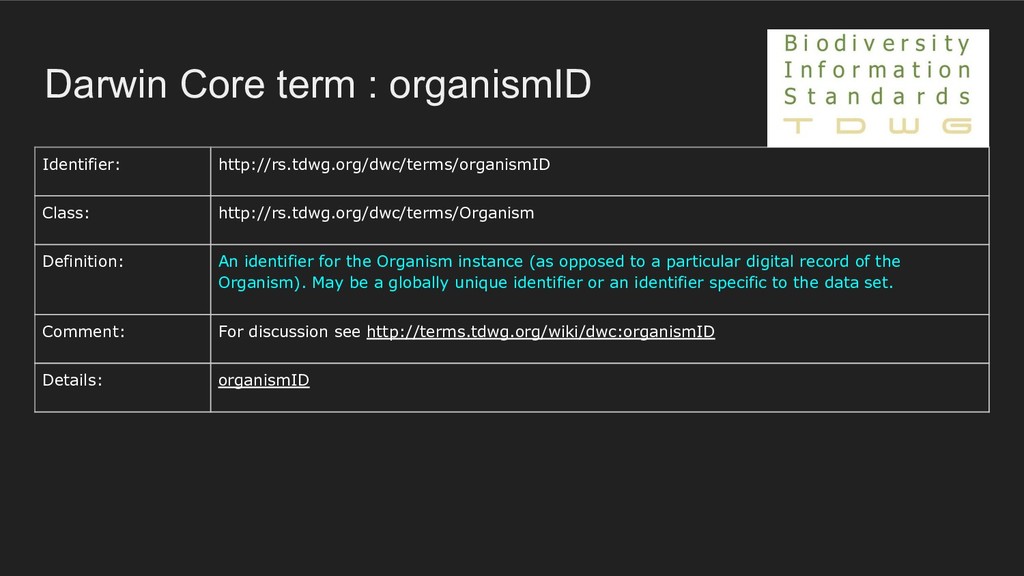
An identifier for the Organism instance (as opposed to a particular digital record of the Organism). May be a globally unique identifier or an identifier specific to the data set. Comment: For discussion see http://terms.tdwg.org/wiki/dwc:organismID Details: organismID
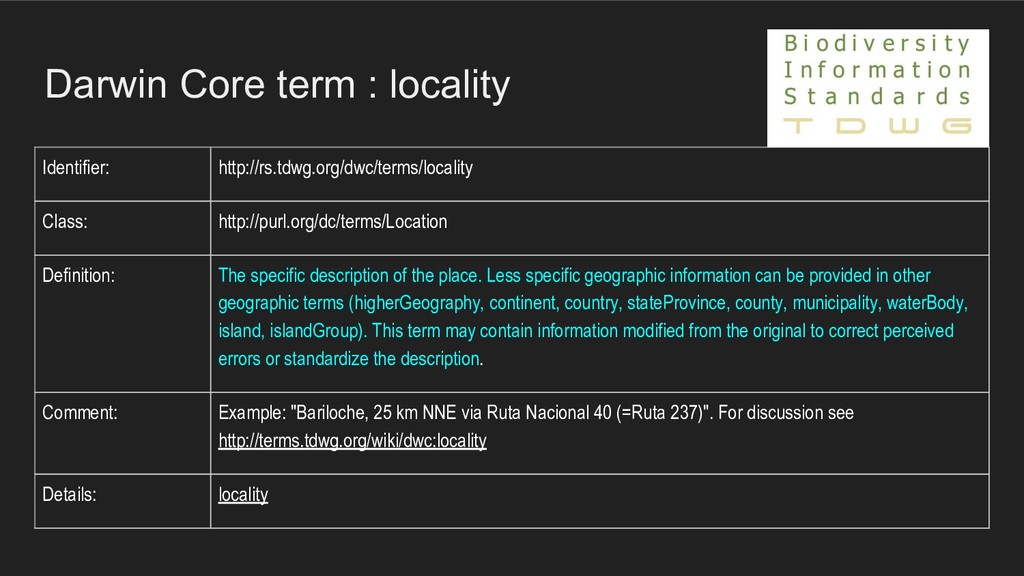
The specific description of the place. Less specific geographic information can be provided in other geographic terms (higherGeography, continent, country, stateProvince, county, municipality, waterBody, island, islandGroup). This term may contain information modified from the original to correct perceived errors or standardize the description. Comment: Example: "Bariloche, 25 km NNE via Ruta Nacional 40 (=Ruta 237)". For discussion see http://terms.tdwg.org/wiki/dwc:locality Details: locality
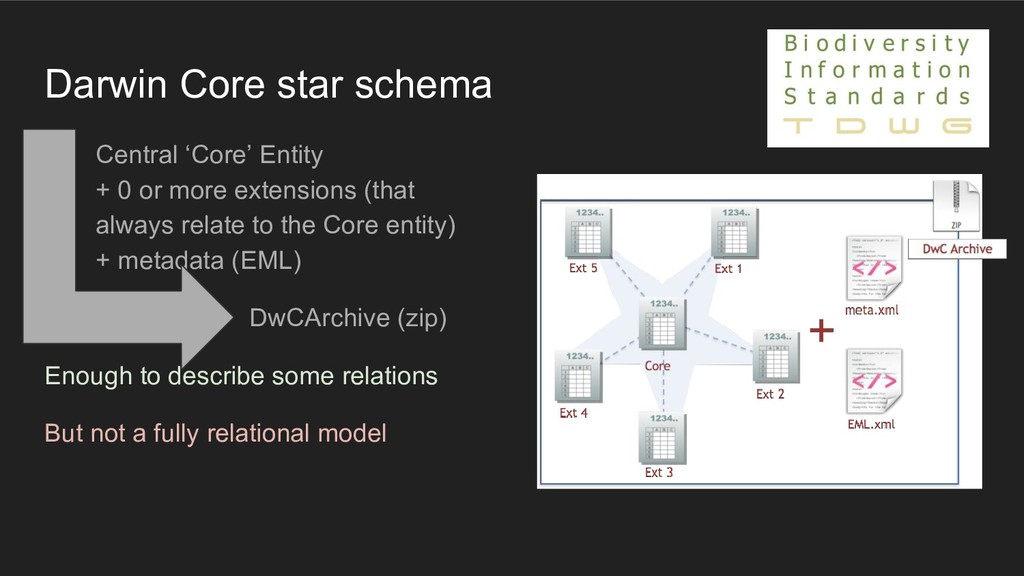
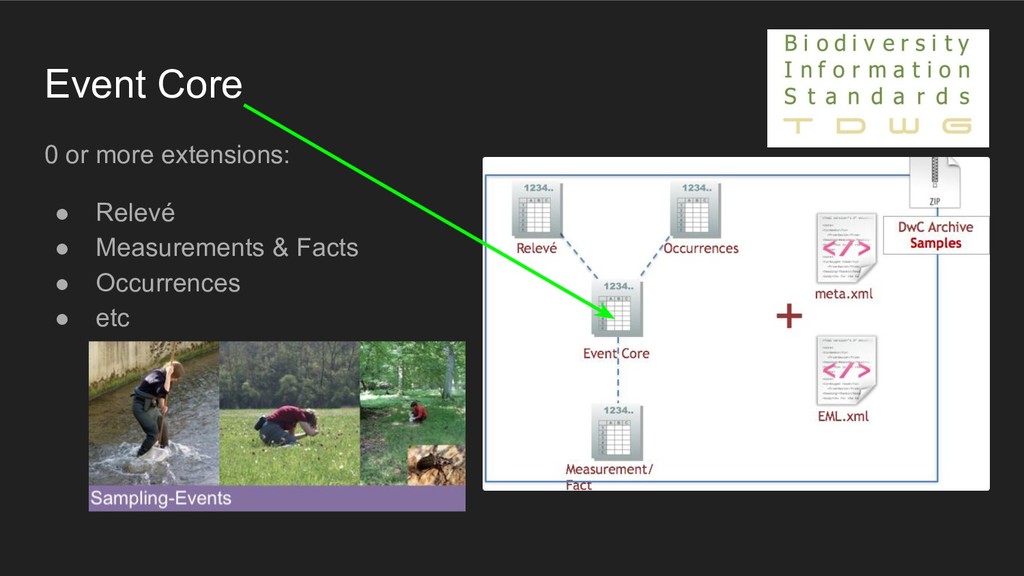
0 or more extensions (that always relate to the Core entity) • + metadata (EML) DwCArchive (zip) Enough to describe some relations But not a fully relational model
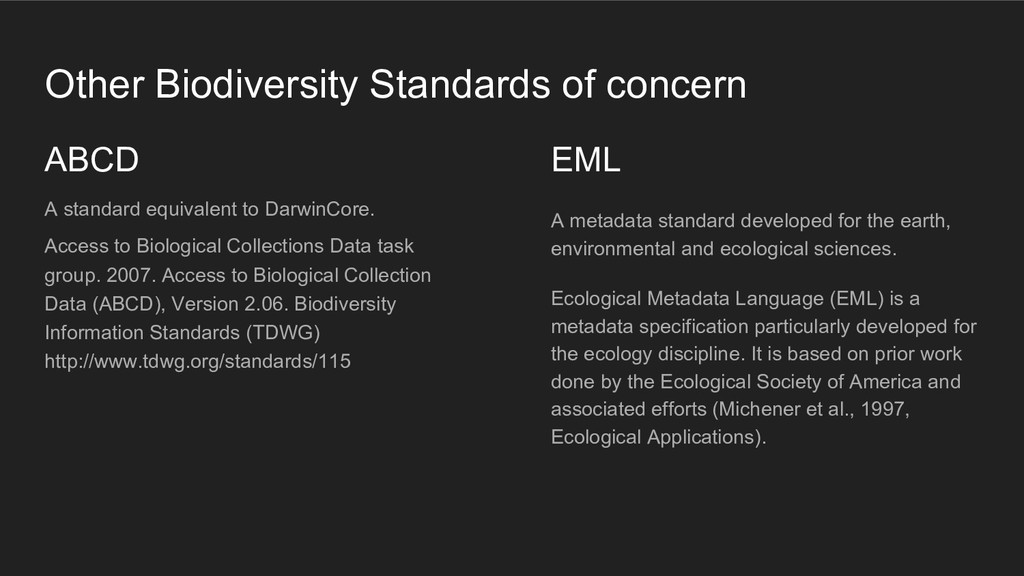
DarwinCore. Access to Biological Collections Data task group. 2007. Access to Biological Collection Data (ABCD), Version 2.06. Biodiversity Information Standards (TDWG) http://www.tdwg.org/standards/115 EML A metadata standard developed for the earth, environmental and ecological sciences. Ecological Metadata Language (EML) is a metadata specification particularly developed for the ecology discipline. It is based on prior work done by the Ecological Society of America and associated efforts (Michener et al., 1997, Ecological Applications).
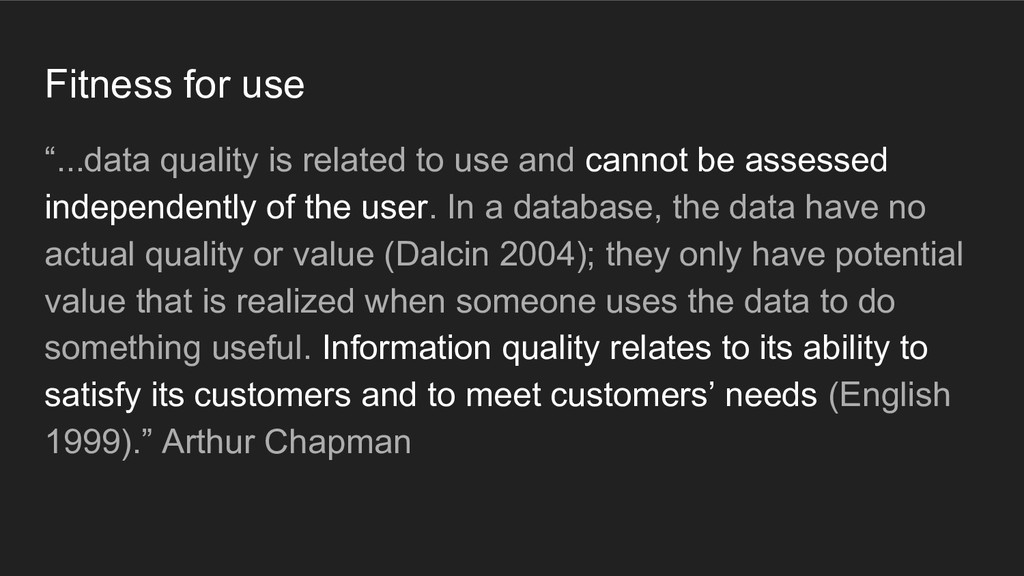
cannot be assessed independently of the user. In a database, the data have no actual quality or value (Dalcin 2004); they only have potential value that is realized when someone uses the data to do something useful. Information quality relates to its ability to satisfy its customers and to meet customers’ needs (English 1999).” Arthur Chapman
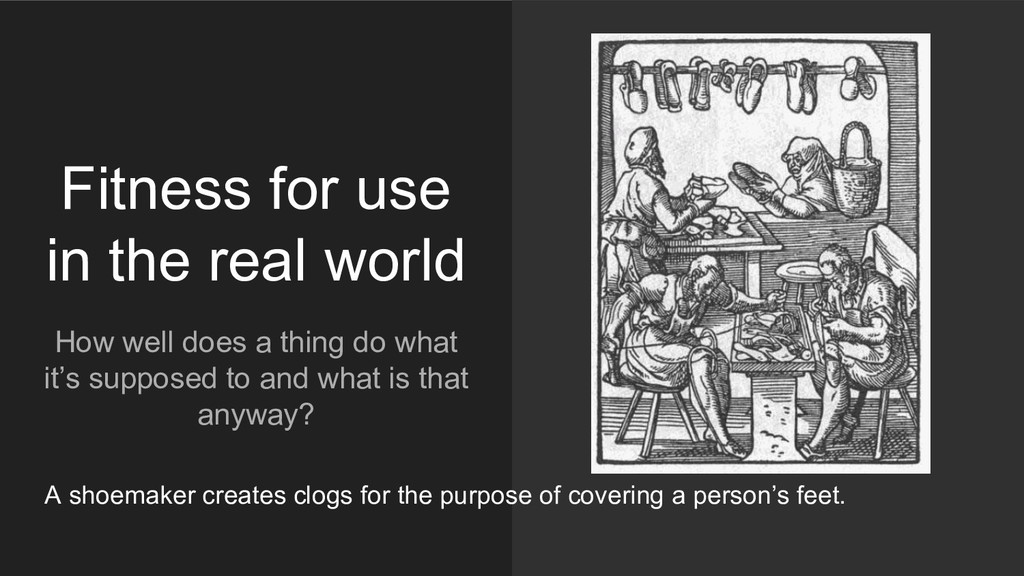
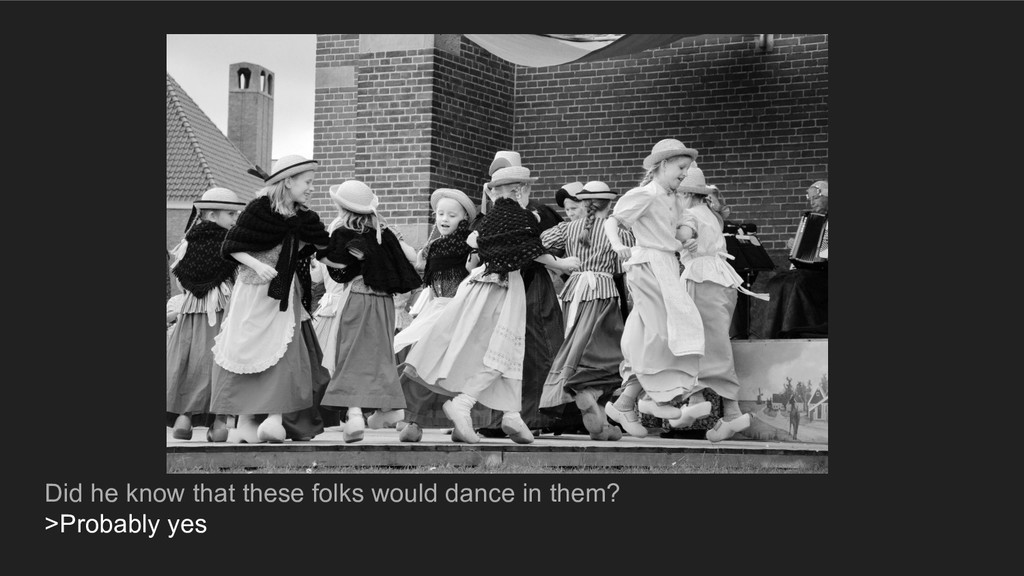
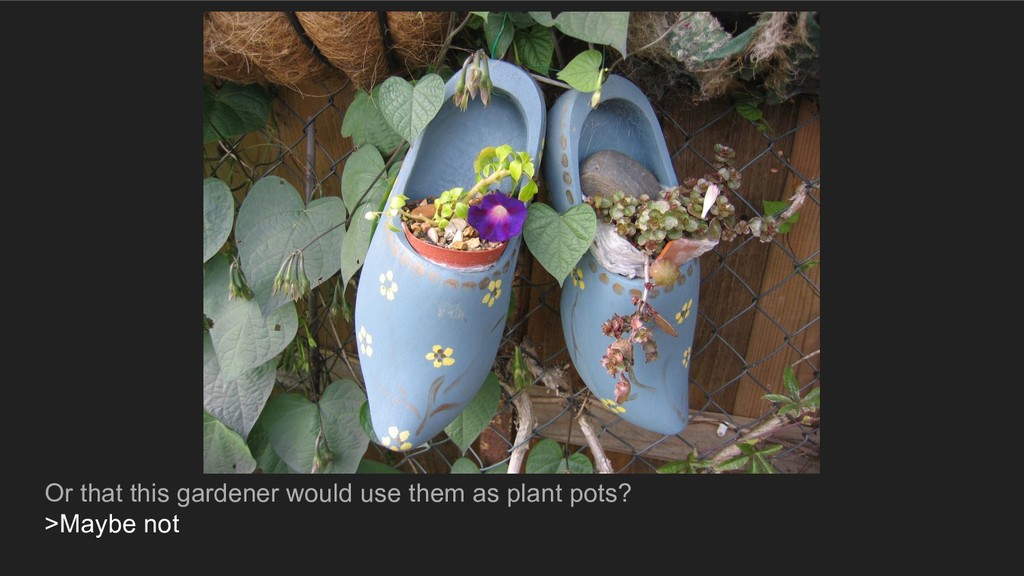
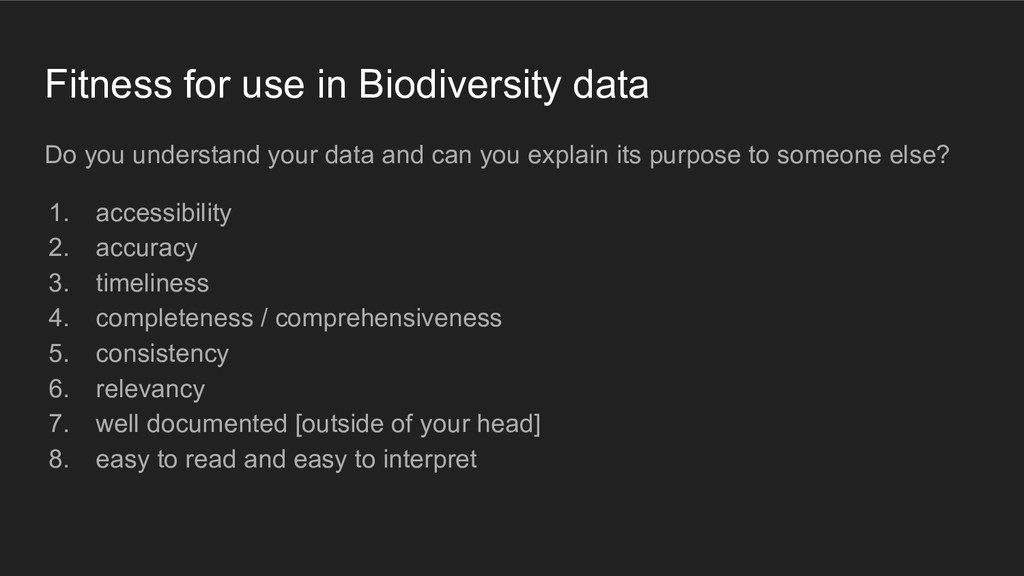
use of these data. "The general intent of describing the quality of a particular dataset or record is to describe the fitness of that dataset or record for a particular use that one may have in mind for the data." Chrisman, 1991 The genus level will be sufficient to run predictive models of ecological niches, whereas someone studying a particular taxon will need really detailed occurrences with subspecies information. Fitness for use in Biodiversity data
data and can you explain its purpose to someone else? 1. accessibility 2. accuracy 3. timeliness 4. completeness / comprehensiveness 5. consistency 6. relevancy 7. well documented [outside of your head] 8. easy to read and easy to interpret
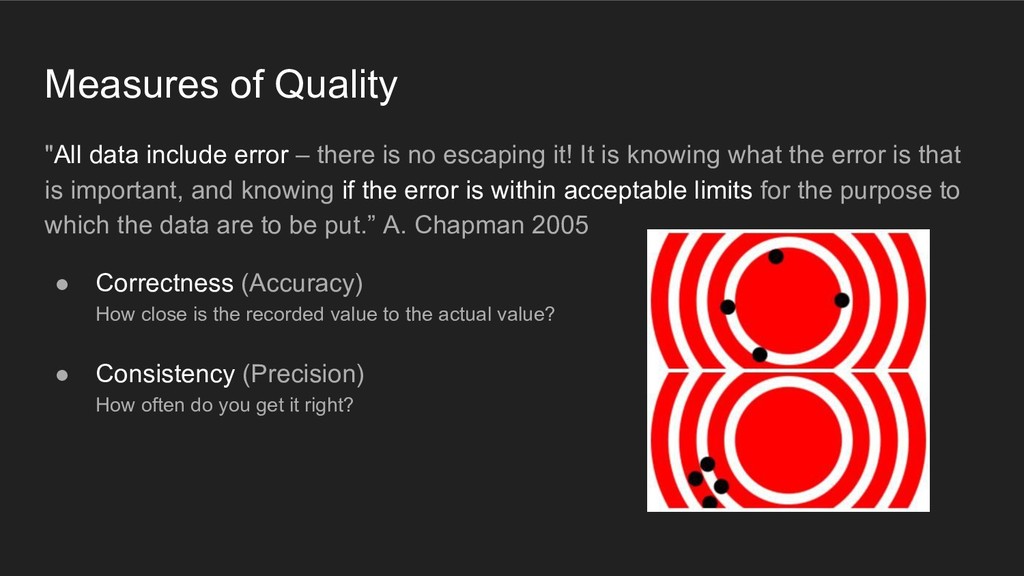
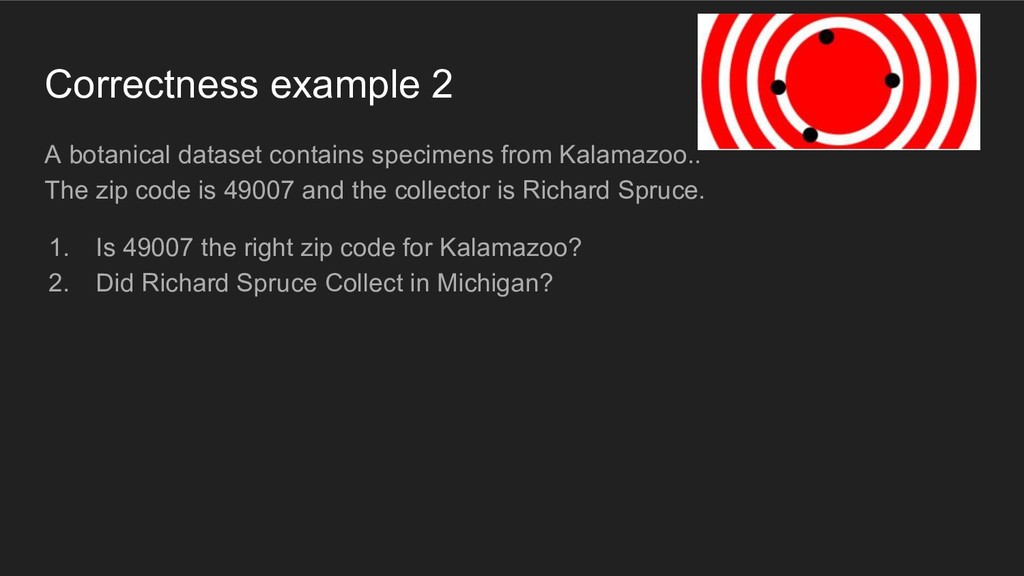
no escaping it! It is knowing what the error is that is important, and knowing if the error is within acceptable limits for the purpose to which the data are to be put.” A. Chapman 2005 • Correctness (Accuracy) How close is the recorded value to the actual value? • Consistency (Precision) How often do you get it right?
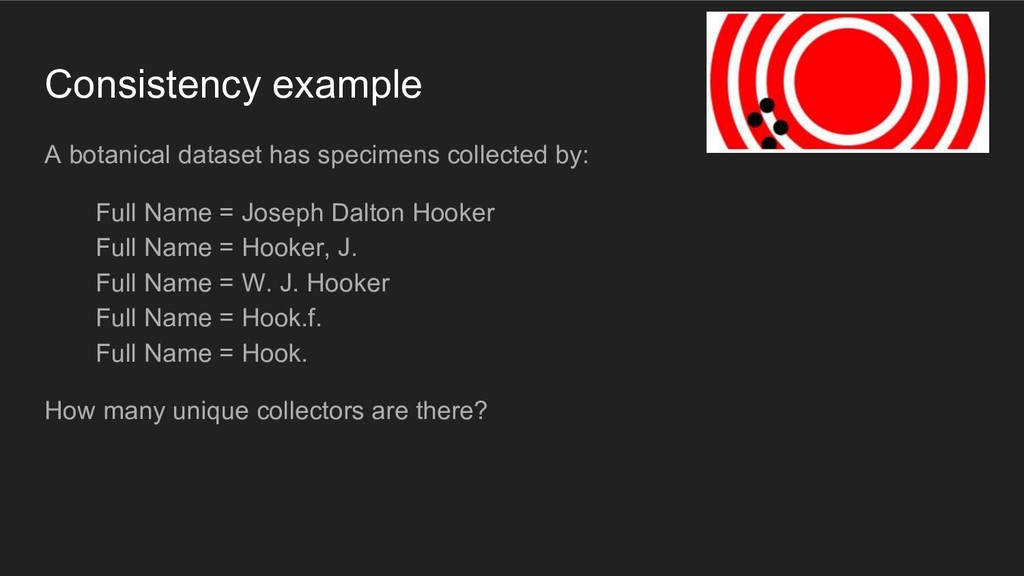
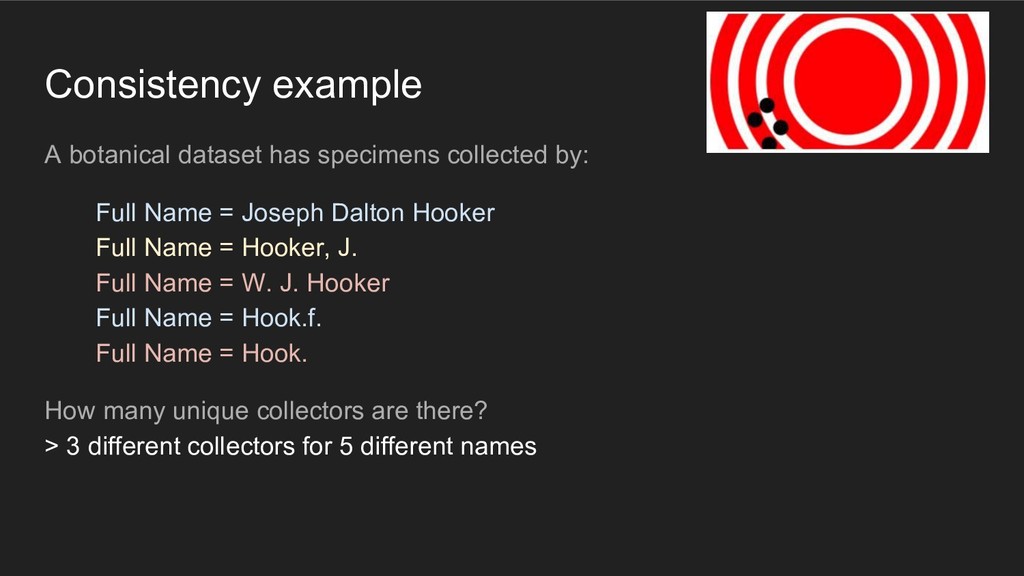
Name = Joseph Dalton Hooker Full Name = Hooker, J. Full Name = W. J. Hooker Full Name = Hook.f. Full Name = Hook. How many unique collectors are there?
Name = Joseph Dalton Hooker Full Name = Hooker, J. Full Name = W. J. Hooker Full Name = Hook.f. Full Name = Hook. How many unique collectors are there? > 3 different collectors for 5 different names
escaping it! It is knowing what the error is that is important, and knowing if the error is within acceptable limits for the purpose to which the data are to be put.” A. Chapman 2005 Data cleaning is the process of correcting (or removing) dirty data caused by contradictions, disparities, keying mistakes, missing bits, etc. It also includes validation of the changes made, and may require normalization.
well organized Not documented (Unassessed quality) My treasure! Circulated Home-made Not very well organized Not documented (Unassessed quality) Emailed to contact(s) Shared (Not fully documented) (Unassessed quality) With your colleagues Open (Unassessed quality) Open Data
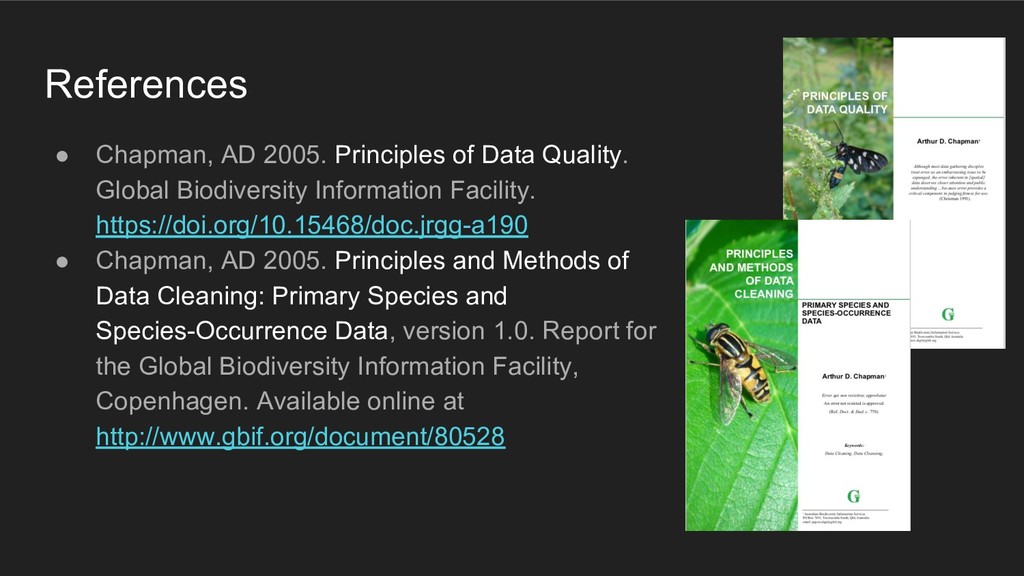
Biodiversity Information Facility. https://doi.org/10.15468/doc.jrgg-a190 • Chapman, AD 2005. Principles and Methods of Data Cleaning: Primary Species and Species-Occurrence Data, version 1.0. Report for the Global Biodiversity Information Facility, Copenhagen. Available online at http://www.gbif.org/document/80528
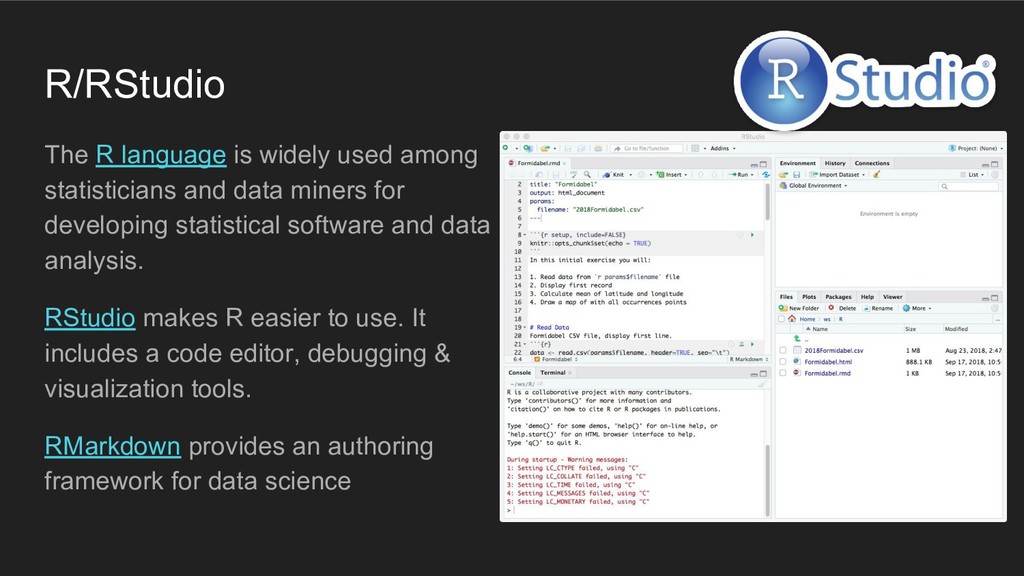
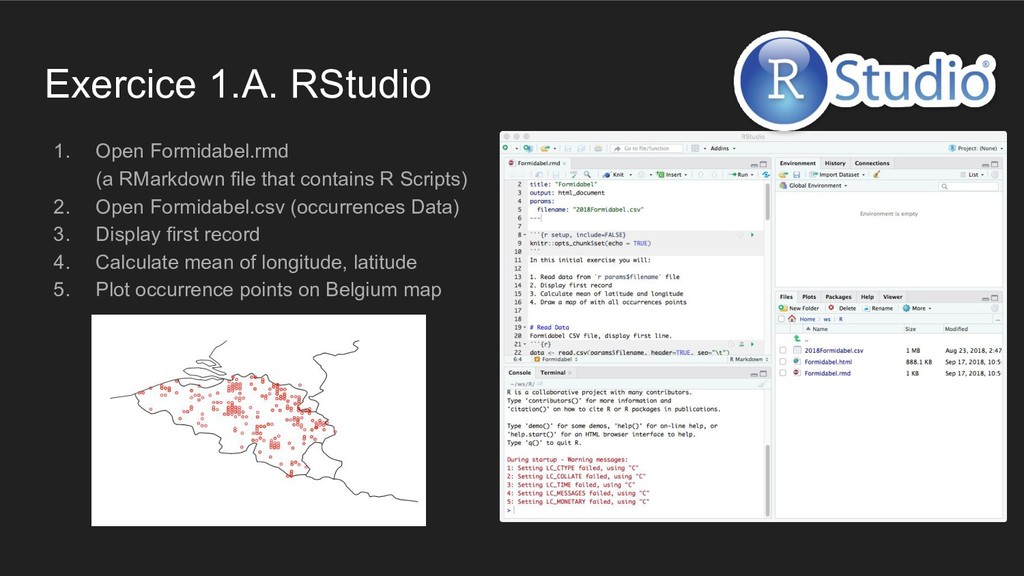
data miners for developing statistical software and data analysis. RStudio makes R easier to use. It includes a code editor, debugging & visualization tools. RMarkdown provides an authoring framework for data science
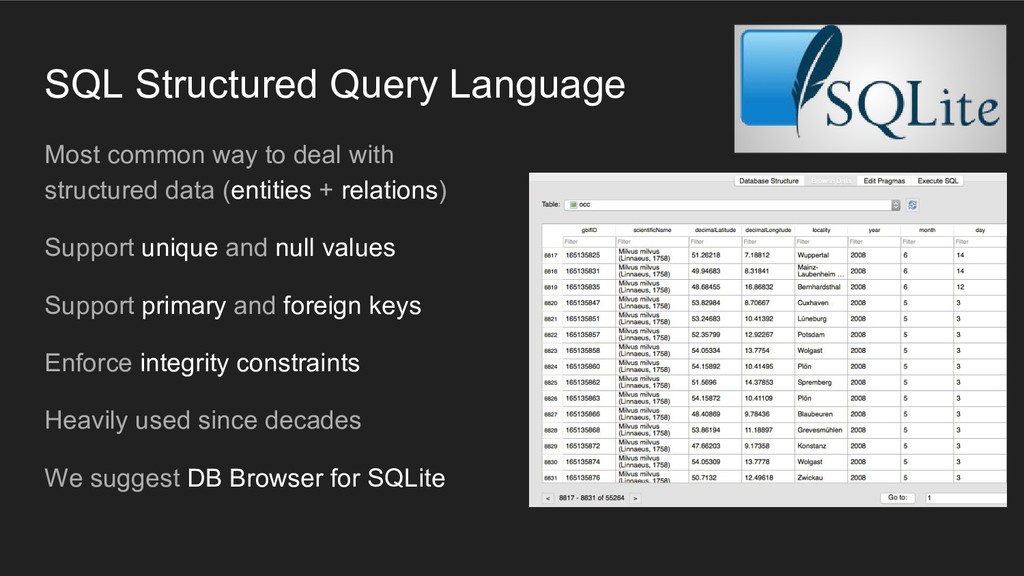
structured data (entities + relations) Support unique and null values Support primary and foreign keys Enforce integrity constraints Heavily used since decades We suggest DB Browser for SQLite
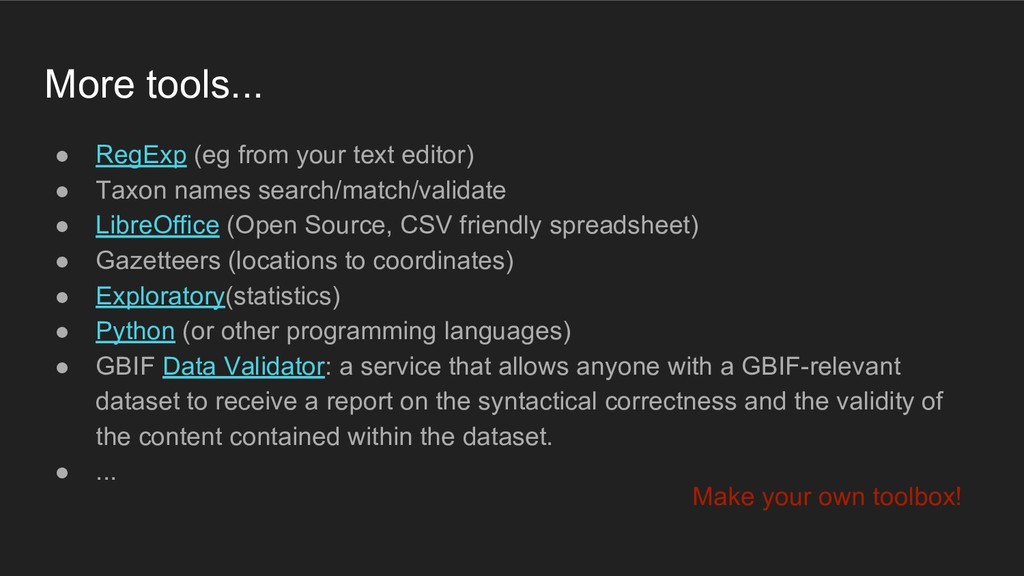
Taxon names search/match/validate • LibreOffice (Open Source, CSV friendly spreadsheet) • Gazetteers (locations to coordinates) • Exploratory(statistics) • Python (or other programming languages) • GBIF Data Validator: a service that allows anyone with a GBIF-relevant dataset to receive a report on the syntactical correctness and the validity of the content contained within the dataset. • ... Make your own toolbox!
contains R Scripts) 2. Open Formidabel.csv (occurrences Data) 3. Display first record 4. Calculate mean of longitude, latitude 5. Plot occurrence points on Belgium map
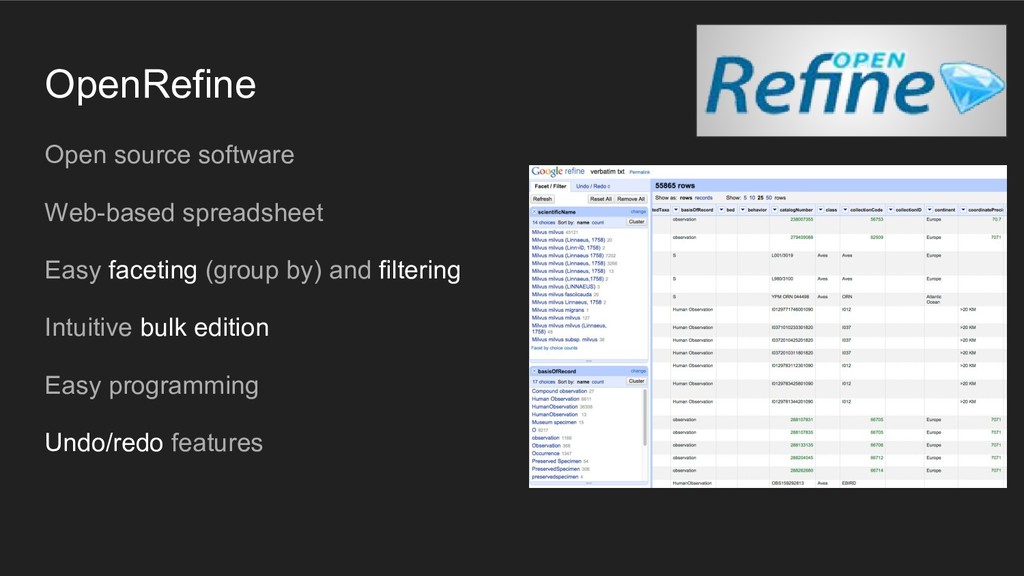
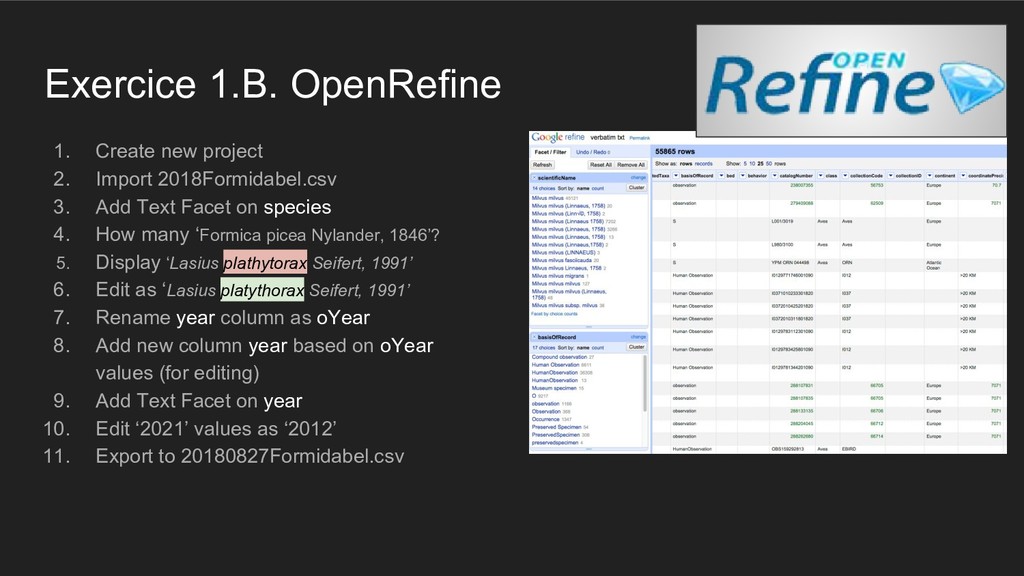
3. Add Text Facet on species 4. How many ‘Formica picea Nylander, 1846’? 5. Display ‘Lasius plathytorax Seifert, 1991’ 6. Edit as ‘Lasius platythorax Seifert, 1991’ 7. Rename year column as oYear 8. Add new column year based on oYear values (for editing) 9. Add Text Facet on year 10. Edit ‘2021’ values as ‘2012’ 11. Export to 20180827Formidabel.csv
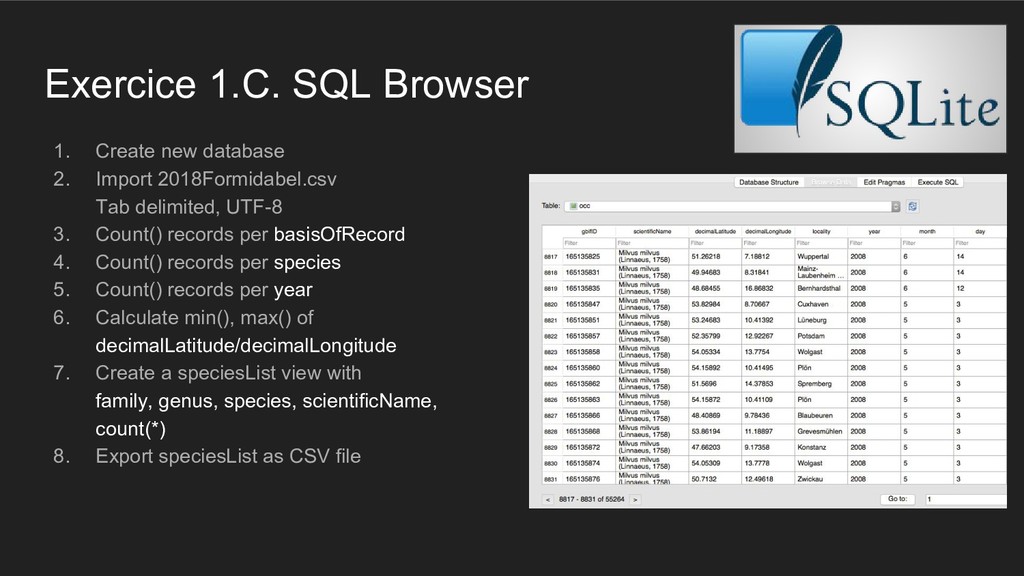
2018Formidabel.csv Tab delimited, UTF-8 3. Count() records per basisOfRecord 4. Count() records per species 5. Count() records per year 6. Calculate min(), max() of decimalLatitude/decimalLongitude 7. Create a speciesList view with family, genus, species, scientificName, count(*) 8. Export speciesList as CSV file
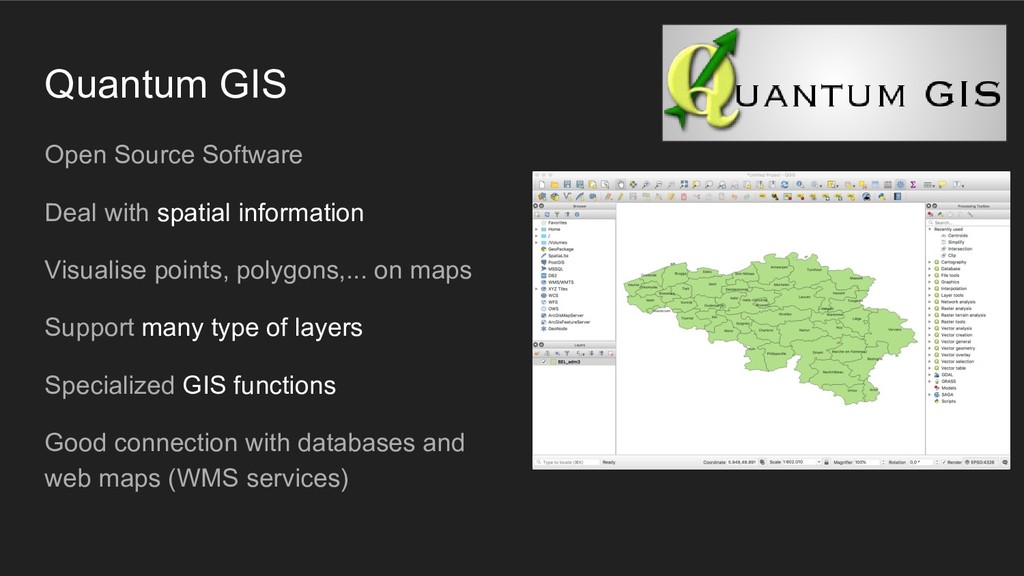
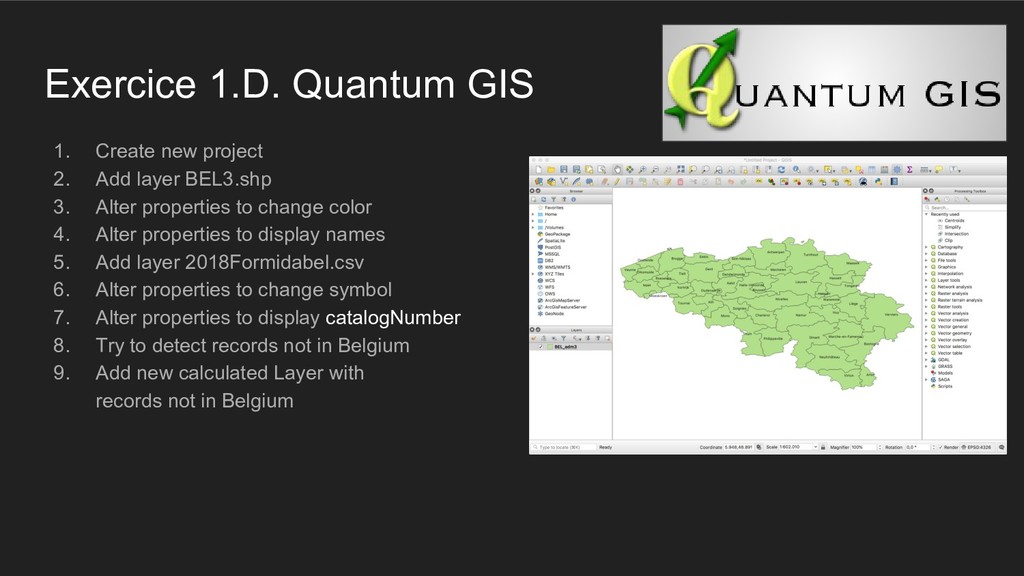
layer BEL3.shp 3. Alter properties to change color 4. Alter properties to display names 5. Add layer 2018Formidabel.csv 6. Alter properties to change symbol 7. Alter properties to display catalogNumber 8. Try to detect records not in Belgium 9. Add new calculated Layer with records not in Belgium
![Any questions? [email protected] Icons by vectorpocket / Freepik](https://files.speakerdeck.com/presentations/b0ca2663b528453eb6bb1d8d299b5998/slide_66.jpg)