Upgrade to Pro — share decks privately, control downloads, hide ads and more …

Data Cleaning Workshop, Introduction

Data Cleaning Workshop, Introduction

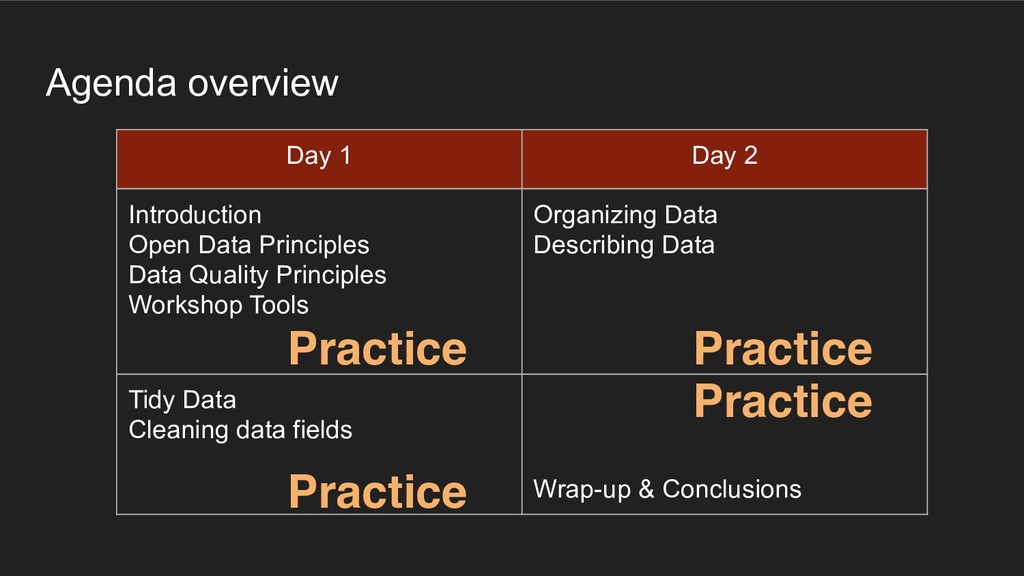
Introduction for the (Biodiversity) Data Cleaning Workshop, held in Brussels 27-28 August 2018.
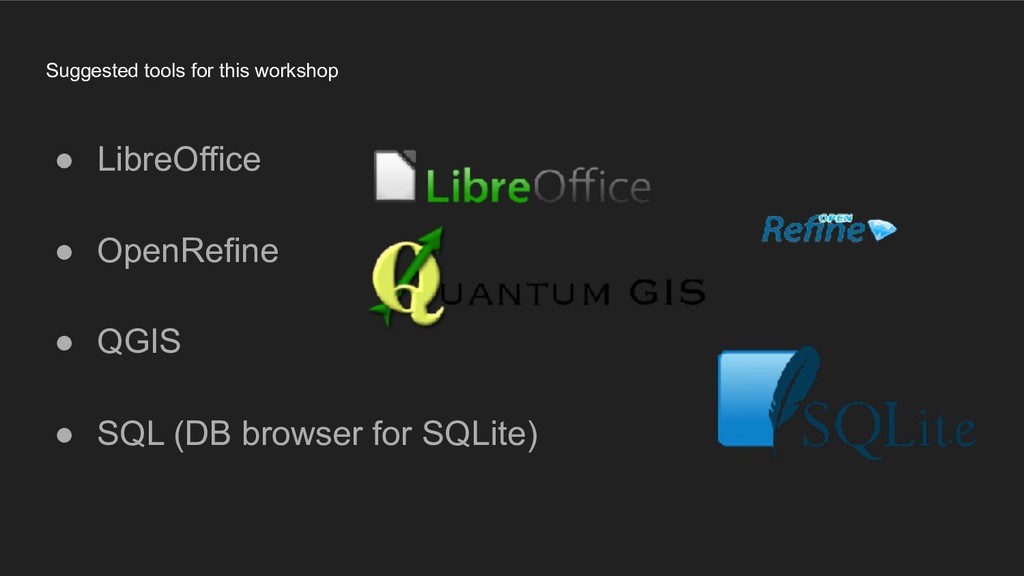
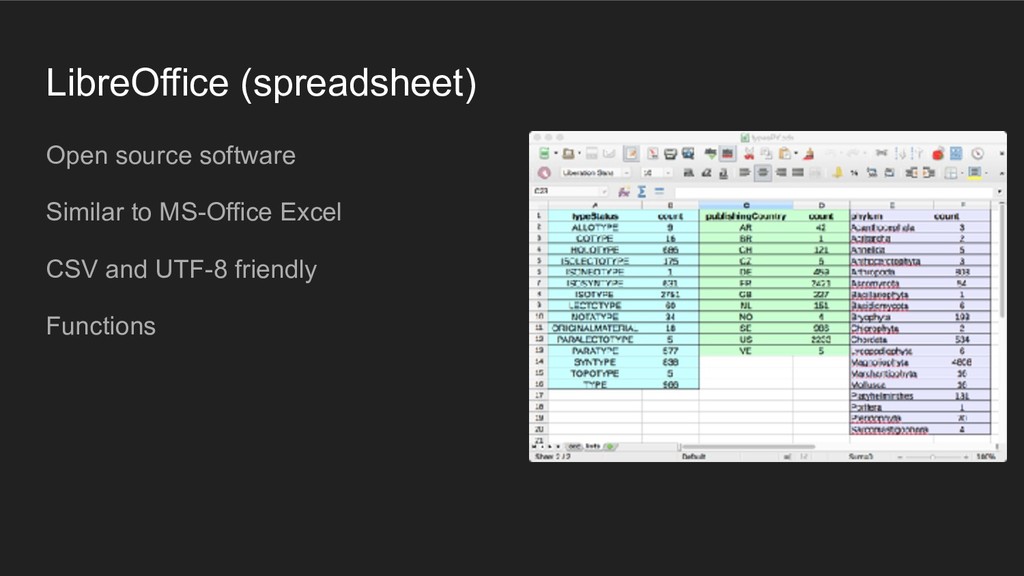
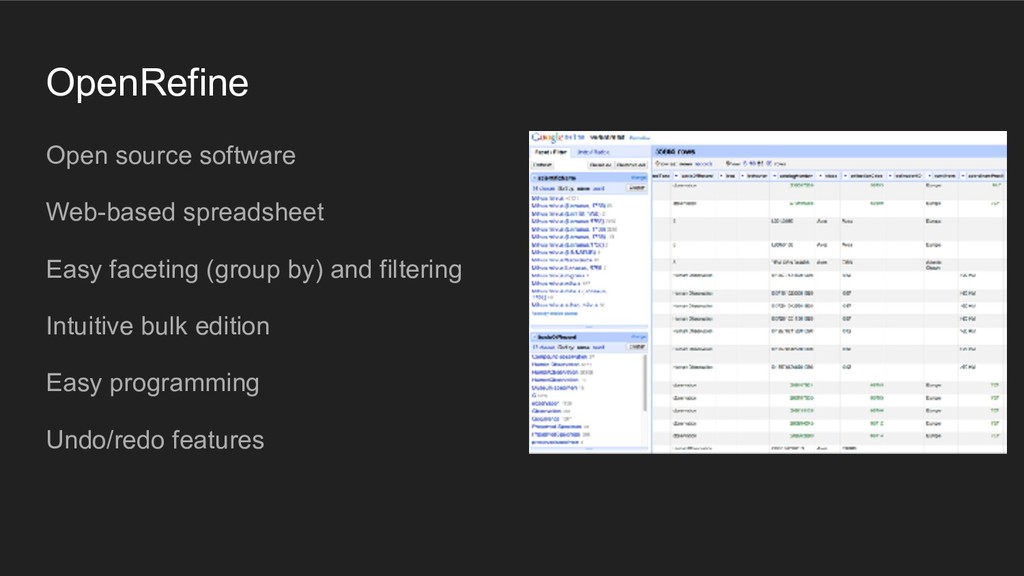
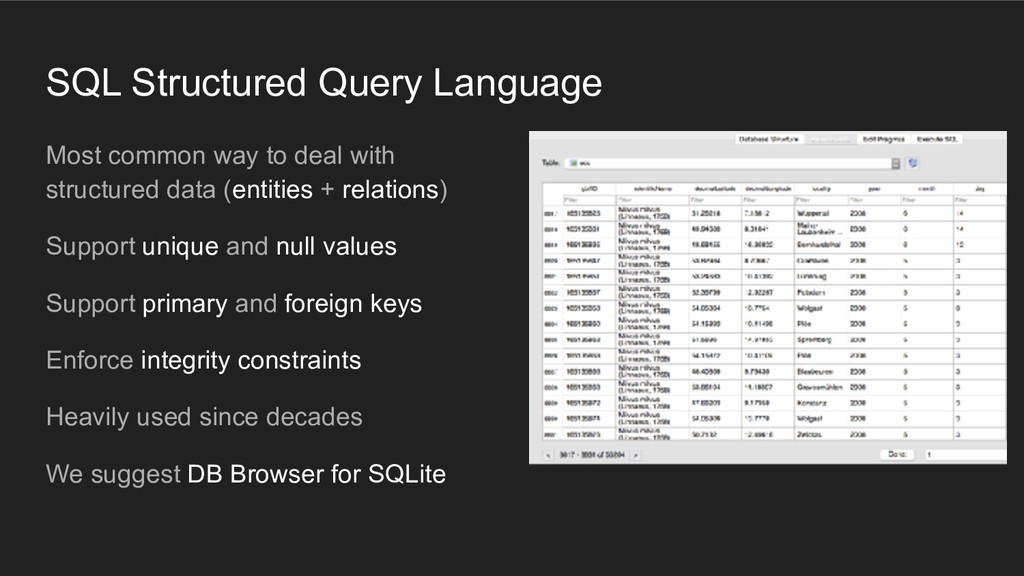
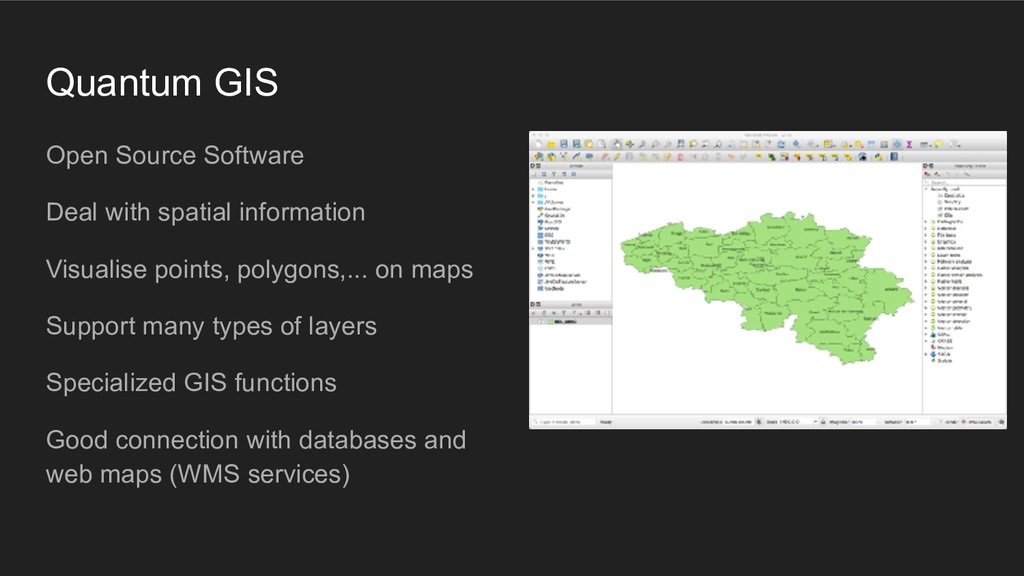
It includes Open Data Principles, Data Quality Principles and a short presentation of the workshop tools: LibreOffice, OpenRefine, SQLite and QuantumGIS.

André Heughebaert

August 27, 2018
Tweet

More Decks by André Heughebaert

Other Decks in Research

Transcript

  1. Objectives This workshop will increase your skills in open biodiversity

    data and is a good opportunity to discover data cleaning tools. You will learn how to document and clean your research data with the goal to increase its quality and ultimately to make it reusable for further research.

  2. Practicalities Wifi Repository Timing 09:00-17:00 Coffee breaks 11:00 & 15:30

    Lunch break 12:30-13:30 Principles Interact, share your experience, practice and... enjoy
  3. Agenda overview Day 1 Day 2 Introduction Open Data Principles

    Data Quality Principles Workshop Tools Organizing Data Describing Data Tidy Data Cleaning data fields Wrap-up & Conclusions Practice Practice Practice Practice
  4. 4 workgroups Andr é ! X ! Y ! Z

    Dimi ! X ! Y ! Z Nico ! X ! Y ! Z Max ! X ! Y ! Z
  5. Preparatory Survey - your difficulties/challenges “Standardization” “Structure my data” “Taxonomic

    inconsistencies” “Coordinates errors” “Keep changes traceable” “Avoid misinterpretations”
  6. Summary • How open are your data? • Open access

    in a nutshell • Global Biodiversity Information Facility • FAIR Principles • Creative Common Licenses
  7. How open are your data? Private Home-made,often cryptic Not very

    well organized Not documented (Unassessed quality) My treasure! Circulated Home-made Not very well organized Not documented (Unassessed quality) Emailed to contact(s) Shared (Not fully documented) (Unassessed quality) With your colleagues Open (Unassessed quality) Open Data
  8. Open Access in a nutshell Capture Re-use sum Document &

    Clean Discover Publish Data Life Cycle
  9. Global Biodiversity Information Facility • 57 country participants, 36 organisations

    • 1.250 publishing institutions • 40.000 datasets • 1 billion occurrences records • 160.000 user sessions/month • 130 billion records downloaded/month • 2 peer reviewed articles/day of data re-use
  10. FAIR Principles “Good data management is not a goal in

    itself, but rather is the key conduit leading to knowledge discovery and innovation, and to subsequent data and knowledge integration and reuse by the community after the data publication process.” Mark D. Wilkinson et al.# In 2016, the ‘FAIR Guiding Principles for scientific data management and stewardship’ were published in Scientific Data.
  11. Quality is relative to the usage Theatrum orbis Terrarum by

    Ortelius Abraham, 1527-1598 Image from the collections of the State Library of New South Wales.
  12. Fitness for use “...data quality is related to use and

    cannot be assessed independently of the user. In a database, the data have no actual quality or value (Dalcin 2004); they only have potential value that is realized when someone uses the data to do something useful. Information quality relates to its ability to satisfy its customers and to meet customers’ needs (English 1999).” Arthur Chapman
  13. Fitness for use in the real world How well does

    a thing do what it’s supposed to and what is that anyway? A shoemaker creates clogs for the purpose of covering a person’s feet.
  14. Data quality is a relative concept that depends on the

    use of these data. "The general intent of describing the quality of a particular dataset or record is to describe the fitness of that dataset or record for a particular use that one may have in mind for the data." Chrisman, 1991 The genus level will be sufficient to run predictive models of ecological niches, whereas someone studying a particular taxon will need really detailed occurrences with subspecies information. Fitness for use in Biodiversity data
  15. Fitness for use in Biodiversity data Do you understand your

    data and can you explain its purpose to someone else? 1. accessibility 2. accuracy 3. timeliness 4. completeness / comprehensiveness 5. consistency 6. relevancy 7. well documented [outside of your head] 8. easy to read and easy to interpret

  16. Measures of Quality "All data include error – there is

    no escaping it! It is knowing what the error is that is important, and knowing if the error is within acceptable limits for the purpose to which the data are to be put.” A. Chapman 2005 • Correctness (Accuracy)
 How close is the recorded value to the actual value?
 • Consistency (Precision)
 How often do you get it right?

  17. Correctness example 1 A dataset contains fossil specimens from the

    Triassic period.
 The recorded taxa for a specimen Is Thismia. 
 
 Is Thismia a fossil bird?

  18. Correctness example 1 A dataset contains fossil specimens from the

    Triassic period.
 The recorded taxa for a specimen Is Thismia. 
 
 Is Thismia a fossil bird? > No! It’s a very rare plant from Illinois (US)

  19. Correctness example 2 A botanical dataset contains specimens from Kalamazoo..


    The zip code is 49007 and the collector is Richard Spruce. 1. Is 49007 the right zip code for Kalamazoo? 2. Did Richard Spruce Collect in Michigan?
 

  20. Consistency example A botanical dataset has specimens collected by: Full

    Name = Joseph Dalton Hooker
 Full Name = Hooker, J.
 Full Name = W. J. Hooker
 Full Name = Hook.f.
 Full Name = Hook. How many unique collectors are there?

  21. Consistency example A botanical dataset has specimens collected by: Full

    Name = Joseph Dalton Hooker
 Full Name = Hooker, J.
 Full Name = W. J. Hooker
 Full Name = Hook.f.
 Full Name = Hook. How many unique collectors are there?
 > 3 different collectors for 5 different names
  22. Data cleaning "All data include error – there is no

    escaping it! It is knowing what the error is that is important, and knowing if the error is within acceptable limits for the purpose to which the data are to be put.” A. Chapman 2005 Data cleaning is the process of correcting (or removing) dirty data caused by contradictions, disparities, keying mistakes, missing bits, etc. It also includes validation of the changes made, and may require normalization.

  23. Cleaning maximizes fitness for use Private Home-made,often cryptic Not very

    well organized Not documented (Unassessed quality) My treasure! Circulated Home-made Not very well organized Not documented (Unassessed quality) Emailed to contact(s) Shared (Not fully documented) (Unassessed quality) With your colleagues Open (Unassessed quality) Open Data
  24. Data Cleaning principles • Planning • Organizing • Prevention •

    Responsibility • Partnership • Prioritisation
 
 • Performance measures • Optimization • Feedback • Training • Transparency • Documentation
  25. Data Management Plan Typical questions to address in your DMP:

    • What types of research data are you working with? 
 e.g. microscopic images, video recordings etc. • What is your strategy for organising your data? 
 e.g. how do you organise your folders and name your files? • What is your data backup strategy? 
 e.g. How frequently do you do your backups? At how many independent locations? • How do you exchange files (and other information) with your collaborators? • What are your plans for data sharing? Are your plans in-line with your funder’s requirements? • Are you working with commercial/sensitive/personal/patentable data? Will you be able to share these data? See your funder requirements See DMP online
  26. References • Chapman, AD 2005. Principles of Data Quality. Global

    Biodiversity Information Facility. https:// doi.org/10.15468/doc.jrgg-a190 • Chapman, AD 2005. Principles and Methods of Data Cleaning: Primary Species and Species- Occurrence Data, version 1.0. Report for the Global Biodiversity Information Facility, Copenhagen. Available online at http:// www.gbif.org/document/80528
  27. Summary • Short presentation of the Workshop tools • Demos

    of the tools • Other Tools and References • Exercice 1 with prepared data • Exercice 2 with your own data
  28. OpenRefine Open source software Web-based spreadsheet Easy faceting (group by)

    and filtering Intuitive bulk edition Easy programming Undo/redo features
  29. SQL Structured Query Language Most common way to deal with

    structured data (entities + relations) Support unique and null values Support primary and foreign keys Enforce integrity constraints Heavily used since decades We suggest DB Browser for SQLite
  30. Quantum GIS Open Source Software Deal with spatial information Visualise

    points, polygons,... on maps Support many types of layers Specialized GIS functions Good connection with databases and web maps (WMS services)
  31. More tools... • RegExp (eg from your text editor) •

    Taxon names search/match/validate • Gazetteers (locations to coordinates) • R-Studio or Exploratory(statistics) • Python (or other programming languages) • GBIF Data Validator • ... Make your own toolbox!
  32. Exercice 1.A. LibreOffice 1. Open 2018Formidabel.csv 2. Sort by scientificName


    How many records of 
 Lasius emarginatus (Olivier, 1792)? 3. Sort by catalogNumber
 Locality for catalogNumber 26101? 4. Use min()/max() on year:
 Determine lowest/highest value ? 5. Use countif() on basis_of_record:
 How many HUMAN_OBSERVATIONS?
 How many PRESERVED_SPECIMENS?
  33. Exercice 1.B. OpenRefine 1. Create new project 2. Import 2018Formidabel.csv

    3. Add Text Facet on species 4. How many ‘Formica picea Nylander, 1846’? 5. Display ‘Lasius plathytorax Seifert, 1991’ 6. Edit as ‘Lasius platythorax Seifert, 1991’ 7. Rename year column as oYear 8. Add new column year based on oYear values (for editing) 9. Add Text Facet on year 10. Edit ‘2021’ values as ‘2012’ 11. Export to 20180827Formidabel.csv
  34. Exercice 1.C. SQL Browser 1. Create new database 2. Import

    2018Formidabel.csv
 Tab delimited, UTF-8 3. Count() records per basisOfRecord 4. Count() records per species 5. Count() records per year 6. Calculate min(), max() of decimalLatitude/ decimalLongitude 7. Create a speciesList view with 
 family, genus, species, scientificName, count(*) 8. Export speciesList as CSV file
  35. Exercice 1.D. Quantum GIS 1. Create new project 2. Add

    layer BEL3.shp 3. Alter properties to change color 4. Alter properties to display names 5. Add layer 2018Formidabel.csv 6. Alter properties to change symbol 7. Alter properties to display catalogNumber 8. Try to detect records not in Belgium 9. Add new calculated Layer with 
 records not in Belgium
  36. Exercice 2.A. LibreOffice 1. Open your data file(s) 2. Look

    for unexpected coordinates:
 -90 < Latitude < 90
 -180 < Longitude < 180 3. Look for unexpected dates:
 01 < Day < 31
 01 < Month < 12
 Year < 2018 4. Flag any records with invalid values 5. Look for missing dates, scientific Names 6. Save your file
  37. Exercice 2.B. OpenRefine 1. Create new project 2. Import your

    CSV file(s) 3. Add Text Facet on taxons 4. Add new column taxon (for editing) 5. Edit taxon if necessary 6. Export to new csv file
  38. Exercice 2.C. SQL Browser 1. Create new database 2. Import

    your CSV file(s) 3. Create a speciesList view with 
 family, genus, species, scientificName, count(*) 4. Export speciesList as CSV file 5. Save database
  39. Exercice 2.D. Quantum GIS 1. Create new project 2. Add

    your data as layer 3. Display your relevant label(s) 4. Try to detect outliers (visually) 5. Add new calculated Layer with 
 records outside a definite polygon 6. Save QGIS project