Multithreading Cross platform API File system Networking Linux – User space VM Memory management Virtual memory Permissive multitasking File system and networking
/ AMD64 (Huge page support exist on Linux, but it has own problems) Pages from process point of view - Virtual address reservation - Committed memory page - File mapped memory page
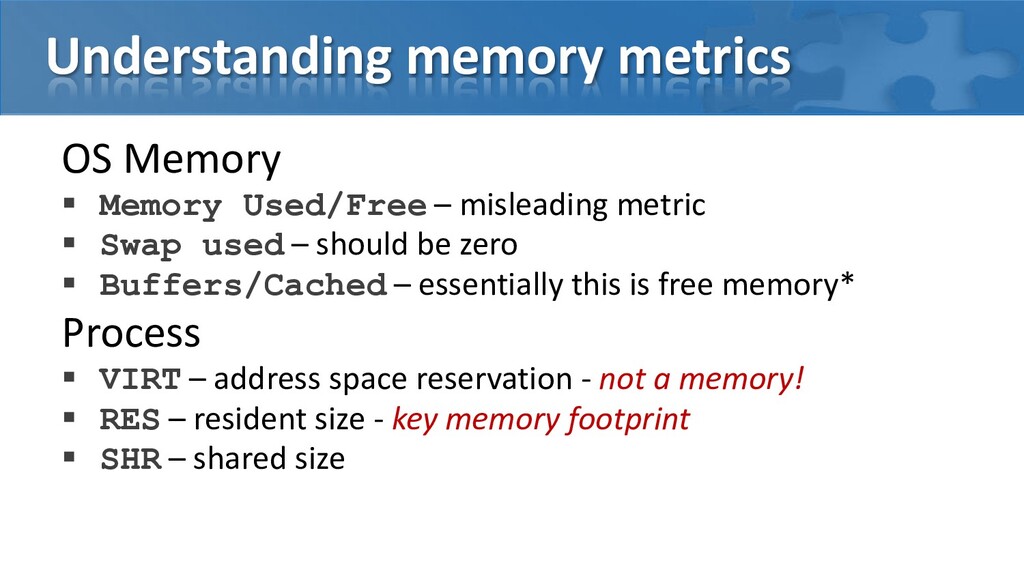
metric Swap used – should be zero Buffers/Cached – essentially this is free memory* Process VIRT – address space reservation - not a memory! RES – resident size - key memory footprint SHR – shared size
disk data (e.g. file system metadata) Cached – pages mapped to file data Non-dirty pages – are essentially free memory. Such pages can be used immediately to fulfill memory allocation request. Dirty pages – writable file mapped pages which has modifications not synchronized to disk.
scans Any Java thread blocked by page fault can block Stop the World pause Java never give up memory to OS Yes, G1 and serial collector can give memory back to OS In practice, JVM would still hold all memory it is allowed too
limit reached Start Full GC If reclaimed memory below threshold throw OutOfMemoryError OOM error is not recoverable, useful to shutdown gracefully -XX:OnOutOfMemoryError="kill -9 %p“ OOM can be caught and discarded prolonging agony
–Xmx limit JVM heap is full but below –Xmx limit Heap is extended by requesting more memory from OS If OS rejects memory requests JVM would crash (no OOM error)
–Xmx limit JVM heap is full but below –Xmx limit NIO direct buffers capacity is capped by JVM -XX:MaxDirectMemorySize=16g Cap is enfored by JVM OOM error in case is limit has been reached – recoverable
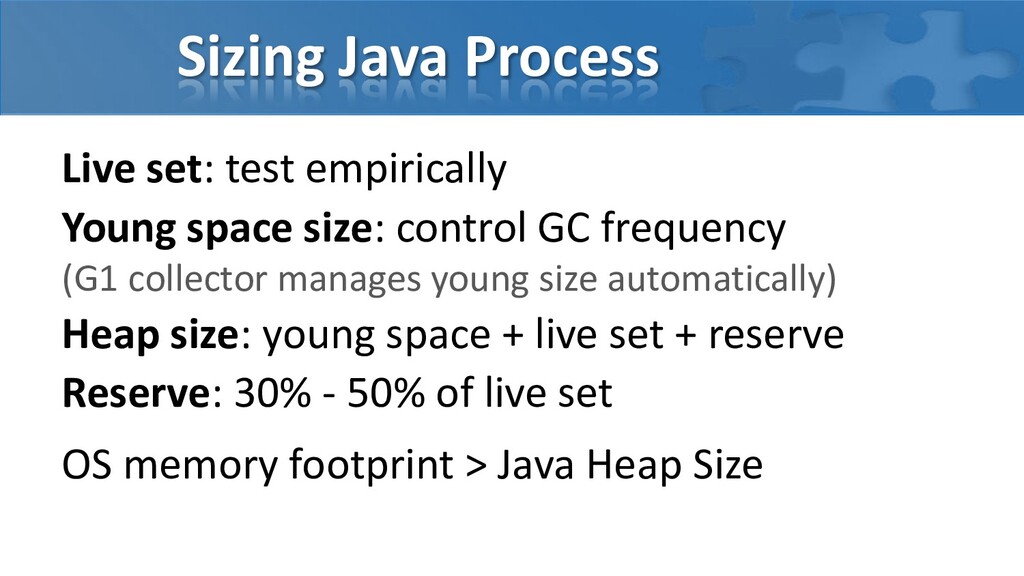
control GC frequency (G1 collector manages young size automatically) Heap size: young space + live set + reserve Reserve: 30% - 50% of live set OS memory footprint > Java Heap Size
cgroups Kernel memory pools can be limited resident / swap / memory mapped Limits are global for container Resources restrictions violations remediated by container termination Plan your container size carefully!
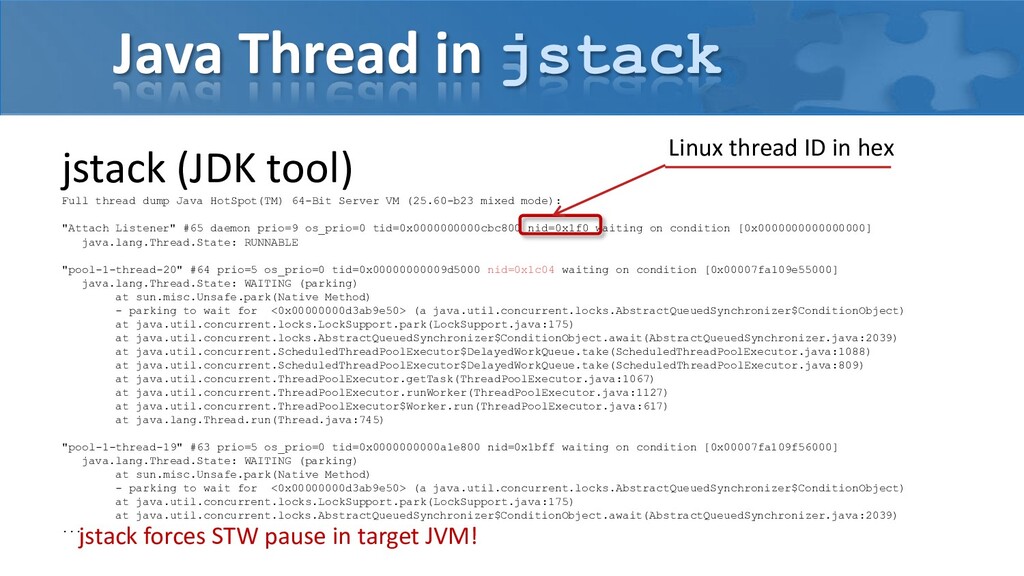
Java HotSpot(TM) 64-Bit Server VM (25.60-b23 mixed mode): "Attach Listener" #65 daemon prio=9 os_prio=0 tid=0x0000000000cbc800 nid=0x1f0 waiting on condition [0x0000000000000000] java.lang.Thread.State: RUNNABLE "pool-1-thread-20" #64 prio=5 os_prio=0 tid=0x00000000009d5000 nid=0x1c04 waiting on condition [0x00007fa109e55000] java.lang.Thread.State: WAITING (parking) at sun.misc.Unsafe.park(Native Method) - parking to wait for <0x00000000d3ab9e50> (a java.util.concurrent.locks.AbstractQueuedSynchronizer$ConditionObject) at java.util.concurrent.locks.LockSupport.park(LockSupport.java:175) at java.util.concurrent.locks.AbstractQueuedSynchronizer$ConditionObject.await(AbstractQueuedSynchronizer.java:2039) at java.util.concurrent.ScheduledThreadPoolExecutor$DelayedWorkQueue.take(ScheduledThreadPoolExecutor.java:1088) at java.util.concurrent.ScheduledThreadPoolExecutor$DelayedWorkQueue.take(ScheduledThreadPoolExecutor.java:809) at java.util.concurrent.ThreadPoolExecutor.getTask(ThreadPoolExecutor.java:1067) at java.util.concurrent.ThreadPoolExecutor.runWorker(ThreadPoolExecutor.java:1127) at java.util.concurrent.ThreadPoolExecutor$Worker.run(ThreadPoolExecutor.java:617) at java.lang.Thread.run(Thread.java:745) "pool-1-thread-19" #63 prio=5 os_prio=0 tid=0x0000000000a1e800 nid=0x1bff waiting on condition [0x00007fa109f56000] java.lang.Thread.State: WAITING (parking) at sun.misc.Unsafe.park(Native Method) - parking to wait for <0x00000000d3ab9e50> (a java.util.concurrent.locks.AbstractQueuedSynchronizer$ConditionObject) at java.util.concurrent.locks.LockSupport.park(LockSupport.java:175) at java.util.concurrent.locks.AbstractQueuedSynchronizer$ConditionObject.await(AbstractQueuedSynchronizer.java:2039) ... Linux thread ID in hex jstack forces STW pause in target JVM!
Use Linux diagnostic tools -XX:+PreserveFramePointer – make Java stack “walkable” JIT symbol generation - https://github.com/jvm-profiling-tools/perf-map-agent Exploit taskset to control CPU affinity Control number of system Java threads Limit number of parallel GC threads -XX:ParallelGCThredas
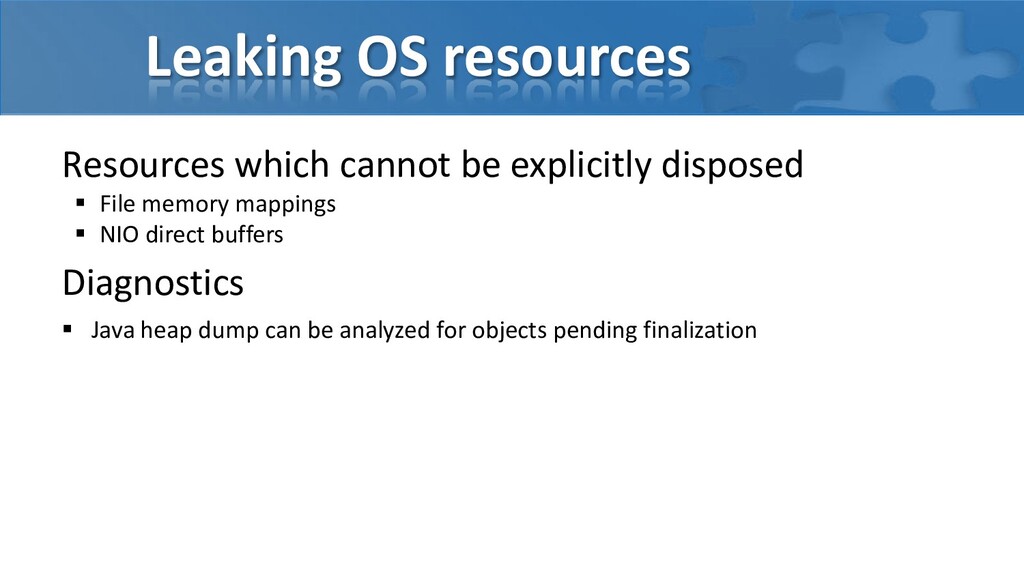
handles Java Garbage collector closes handles automatically Files and sockets Eventually … Best practices Always close your files and sockets explicitly You should explicitly close socket object after SocketException
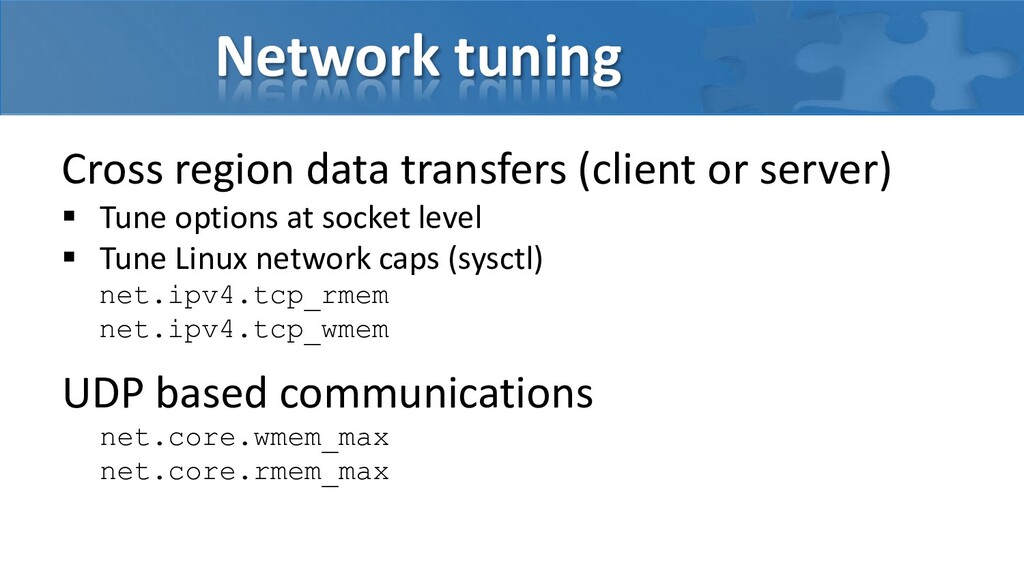
space + live set + reserve JVM footprint = heap size + extra You can use native Linux diagnostic tools for JVM Tip: you can use JDK tools with Linux core dump (requires debug symbols for OpenJDK) Linux tuning Beware THP (Transparent Huge Pages) Do network tuning on non-frontend servers too Exploit NUMA and thread affinity
![Out of Memory in Java public void doWork() { Object[]](https://files.speakerdeck.com/presentations/ff10edfa77044224b6950f46514fedb6/slide_11.jpg)
![Out of Memory in Linux public void doWork() { Object[]](https://files.speakerdeck.com/presentations/ff10edfa77044224b6950f46514fedb6/slide_12.jpg)
![Thank you Alexey Ragozin [email protected] https://blog.ragozin.info https://github.com/aragozin](https://files.speakerdeck.com/presentations/ff10edfa77044224b6950f46514fedb6/slide_35.jpg)