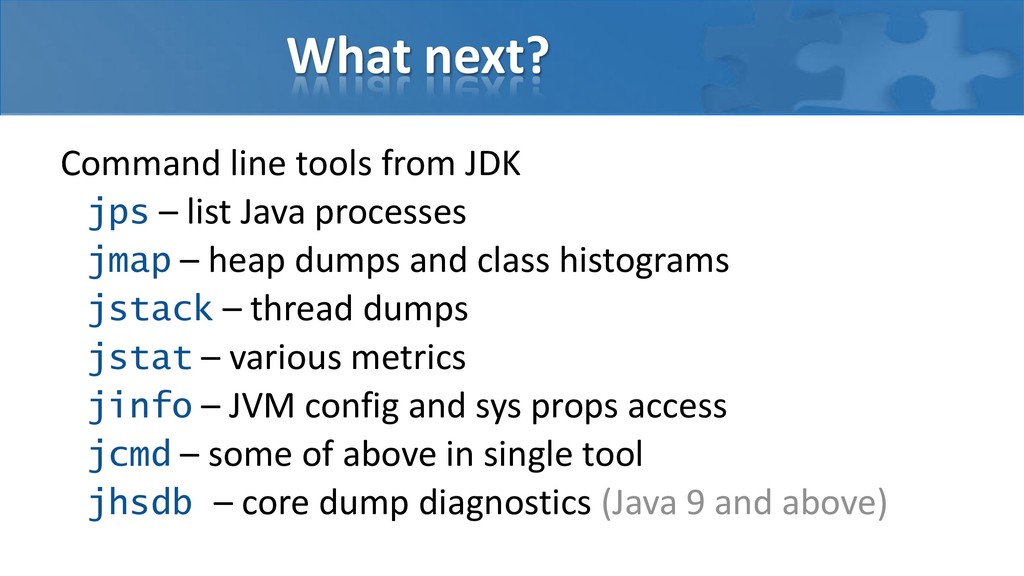
Java processes jmap – heap dumps and class histograms jstack – thread dumps jstat – various metrics jinfo – JVM config and sys props access jcmd – some of above in single tool jhsdb – core dump diagnostics (Java 9 and above)
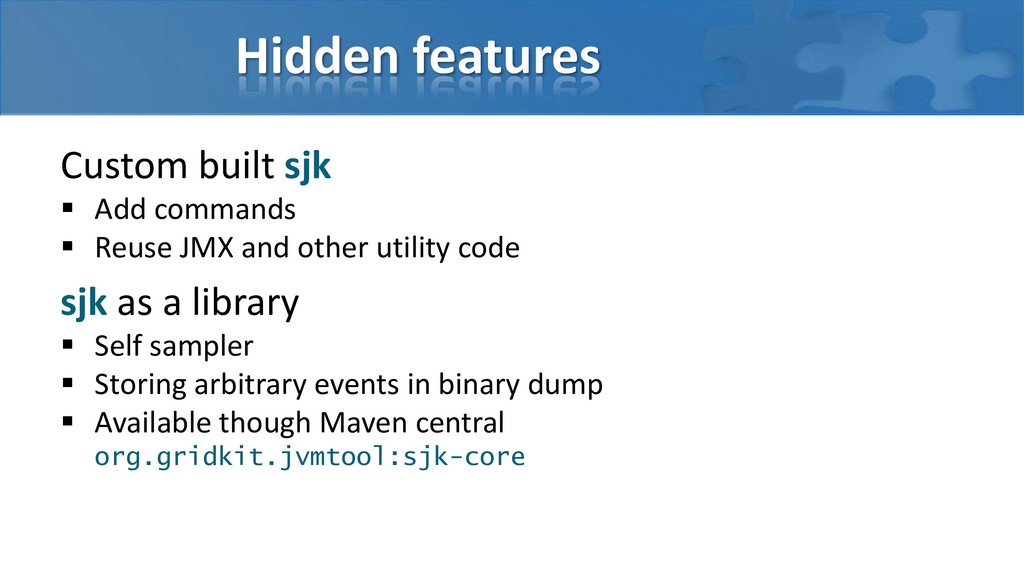
JMX and other utility code sjk as a library Self sampler Storing arbitrary events in binary dump Available though Maven central org.gridkit.jvmtool:sjk-core
JMX and other utility code sjk as a library Self sampler Storing arbitrary events in binary dump Available though Maven central org.gridkit.jvmtool:sjk-core
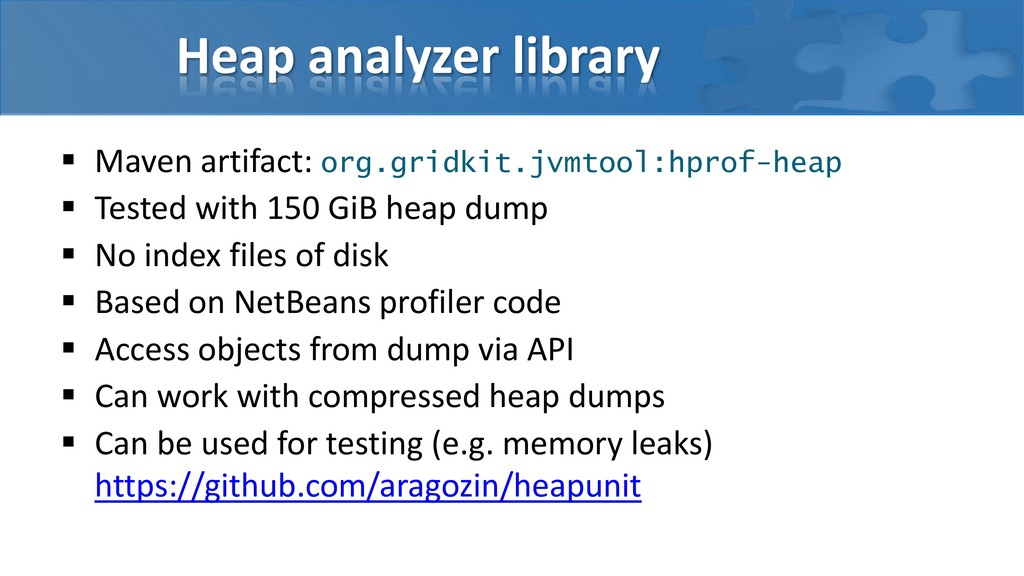
150 GiB heap dump No index files of disk Based on NetBeans profiler code Access objects from dump via API Can work with compressed heap dumps Can be used for testing (e.g. memory leaks) https://github.com/aragozin/heapunit
![SJK – Essential Tool for Java Plumber Alexey Ragozin [email protected]](https://files.speakerdeck.com/presentations/b1dfb46b09124c8d8833a136443b73a9/slide_0.jpg)
![Thank you Алексей Рагозин [email protected] https://blog.ragozin.info https://training.ragozin.info](https://files.speakerdeck.com/presentations/b1dfb46b09124c8d8833a136443b73a9/slide_31.jpg)