Upgrade to Pro — share decks privately, control downloads, hide ads and more …

Measure Everything

Sponsored · Your Podcast. Everywhere. Effortlessly. Share. Educate. Inspire. Entertain. You do you. We'll handle the rest.

Measure Everything

Avatar for Arik Fraimovich

Arik Fraimovich

August 01, 2012
Tweet

More Decks by Arik Fraimovich

Other Decks in Technology

Transcript

  1. Today’s plan • Why measure • How to measure •

    Graphite / StatsD • Using Graphite/StatsD with Ruby and Rails Tuesday, February 12, 13
  2. Questions to answer • How fast is my system? •

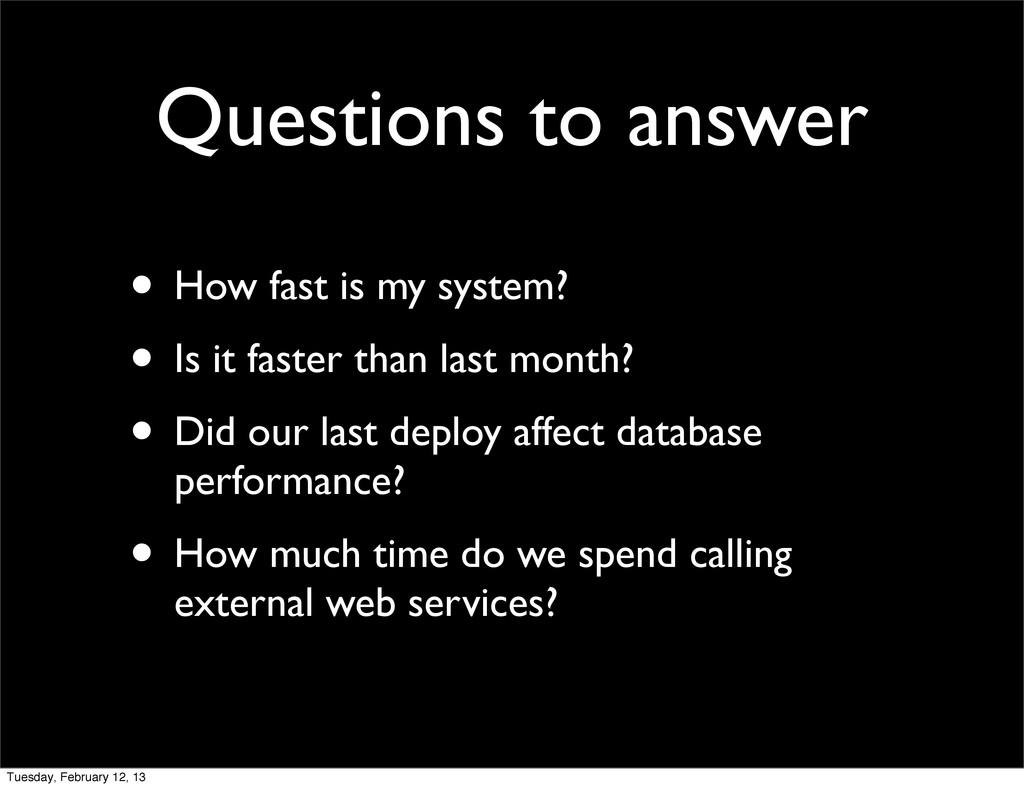
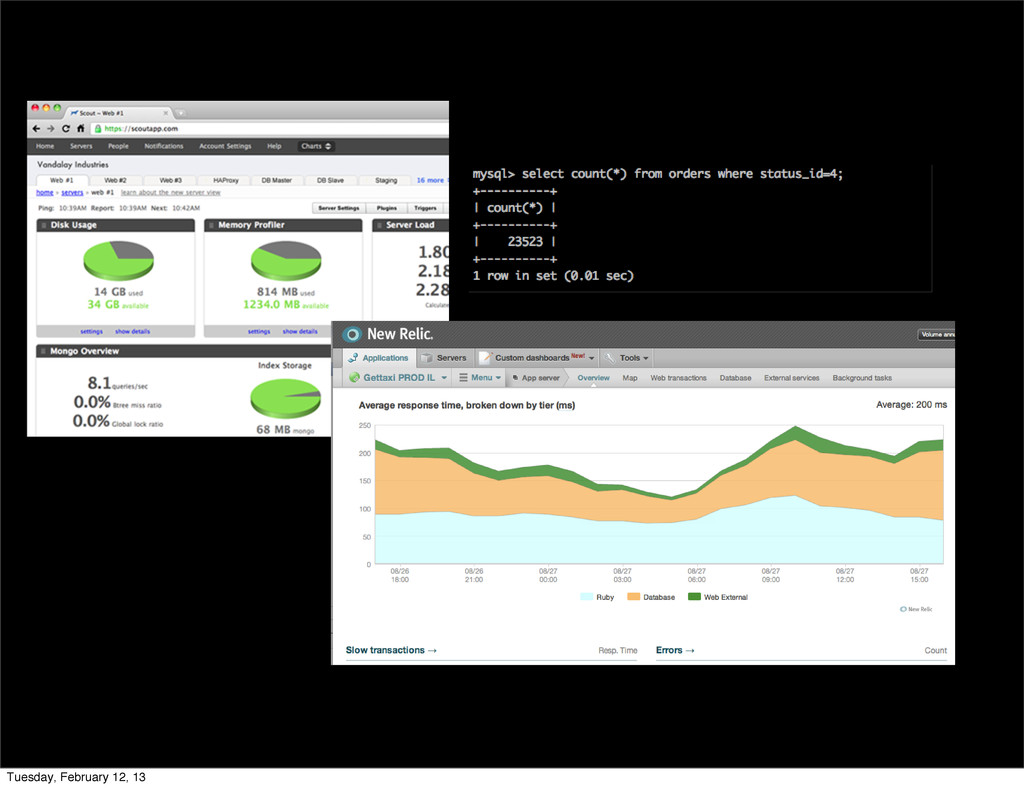
    Is it faster than last month? • Did our last deploy affect database performance? • How much time do we spend calling external web services? Tuesday, February 12, 13
  3. More questions • How many errors do we have a

    day? • How many failed logins? • How many successful logins? • How many orders without house number? Tuesday, February 12, 13
  4. And more questions! • How many orders did we have

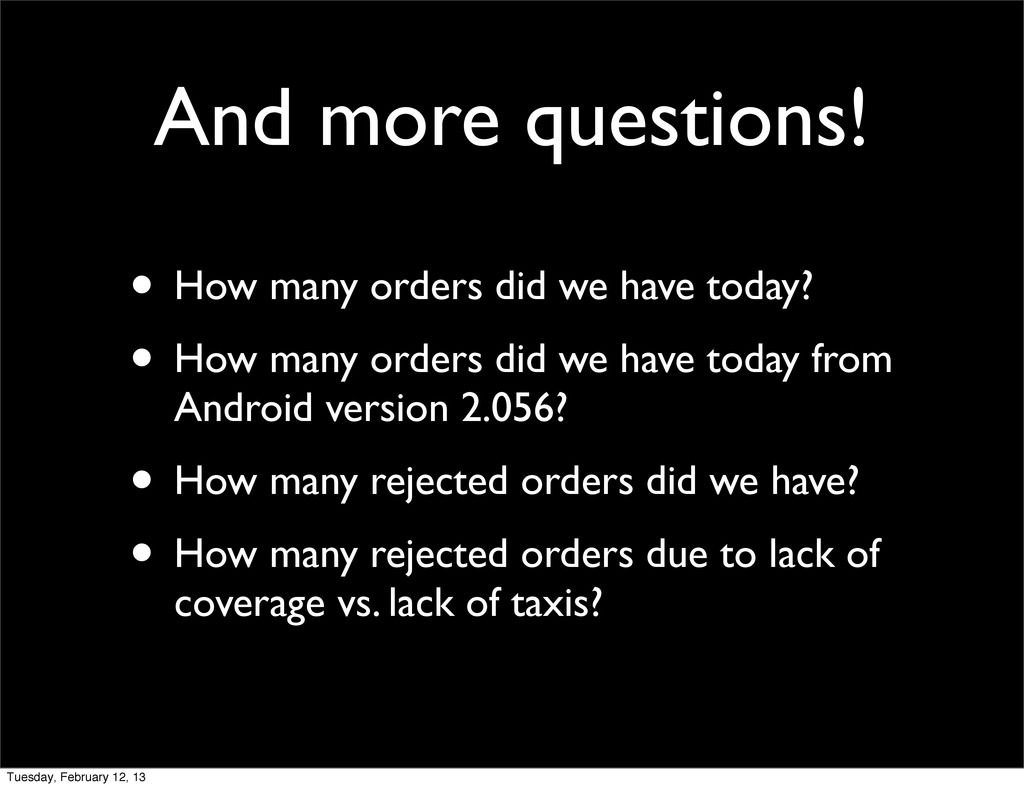
    today? • How many orders did we have today from Android version 2.056? • How many rejected orders did we have? • How many rejected orders due to lack of coverage vs. lack of taxis? Tuesday, February 12, 13
  5. To answer all of this, you need a way to

    track different numbers. Tuesday, February 12, 13
  6. But that’s not enough • Not real time enough •

    Hard to control what’s being collected • Pricey for big deployments Tuesday, February 12, 13
  7. The Alternative • Graphite (Whisper, Carbon, Graphite Web) • StatsD

    • CollectD • (there are other options -- OpenTSDB, Liberato, home grown) Tuesday, February 12, 13
  8. Benefits • Easy to install • Highly scalable • Practically

    zero cost to measure anything: • efficient storage • UDP packets to send data in • Ecosystem Tuesday, February 12, 13
  9. Whisper • Default settings: • 6 hours of 10 second

    data • 1 week of 1 minute data • 5 years of 10 minute data • That’s amounts to ~3.2MB per metric. • Configurable. Tuesday, February 12, 13
  10. Types of data • Counters - number of orders per

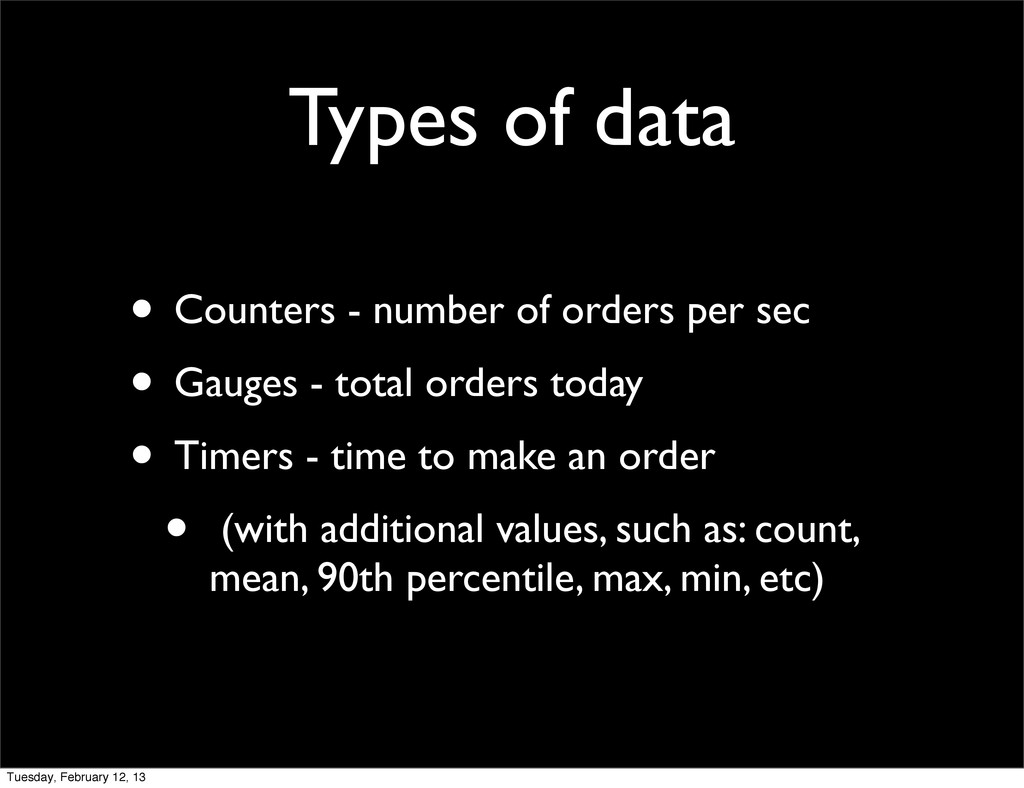
    sec • Gauges - total orders today • Timers - time to make an order • (with additional values, such as: count, mean, 90th percentile, max, min, etc) Tuesday, February 12, 13
  11. Sending a number to Graphite • metric number timestamp •

    example.ruby.under_ground 20 1346075634 • echo "example.ruby_underground 20 `date +%s`" | nc graphite.yourcorp.com 2003 Tuesday, February 12, 13
  12. Naming Convention • Whatever makes sense to you, just remember

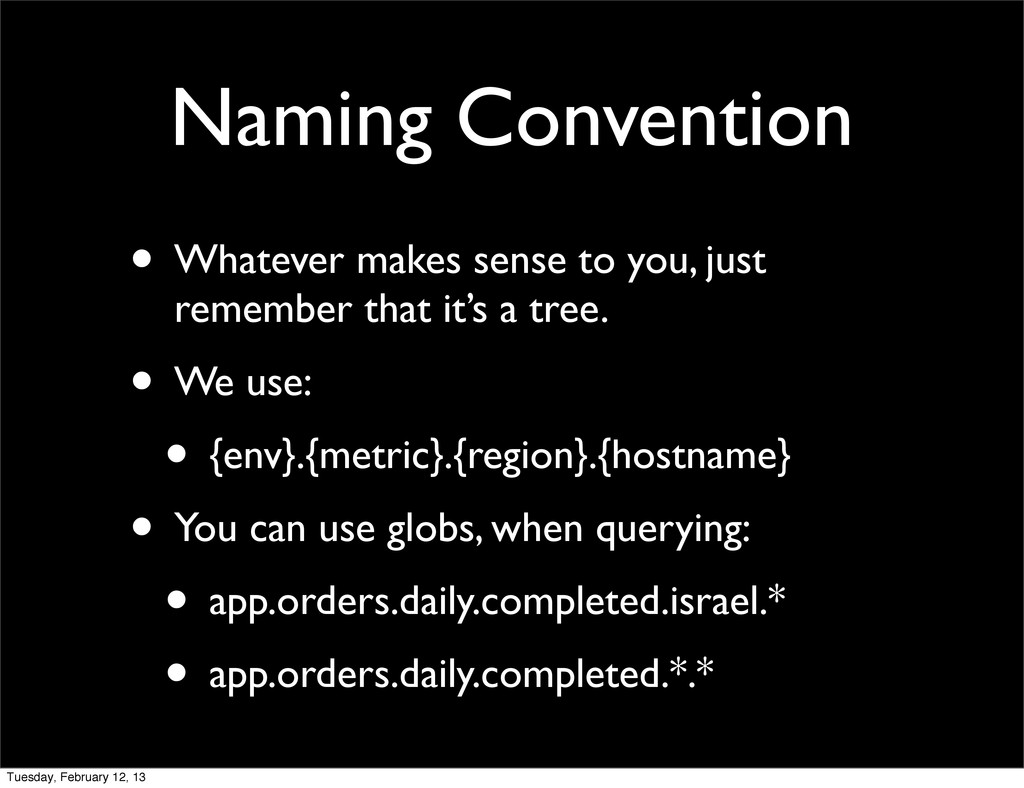
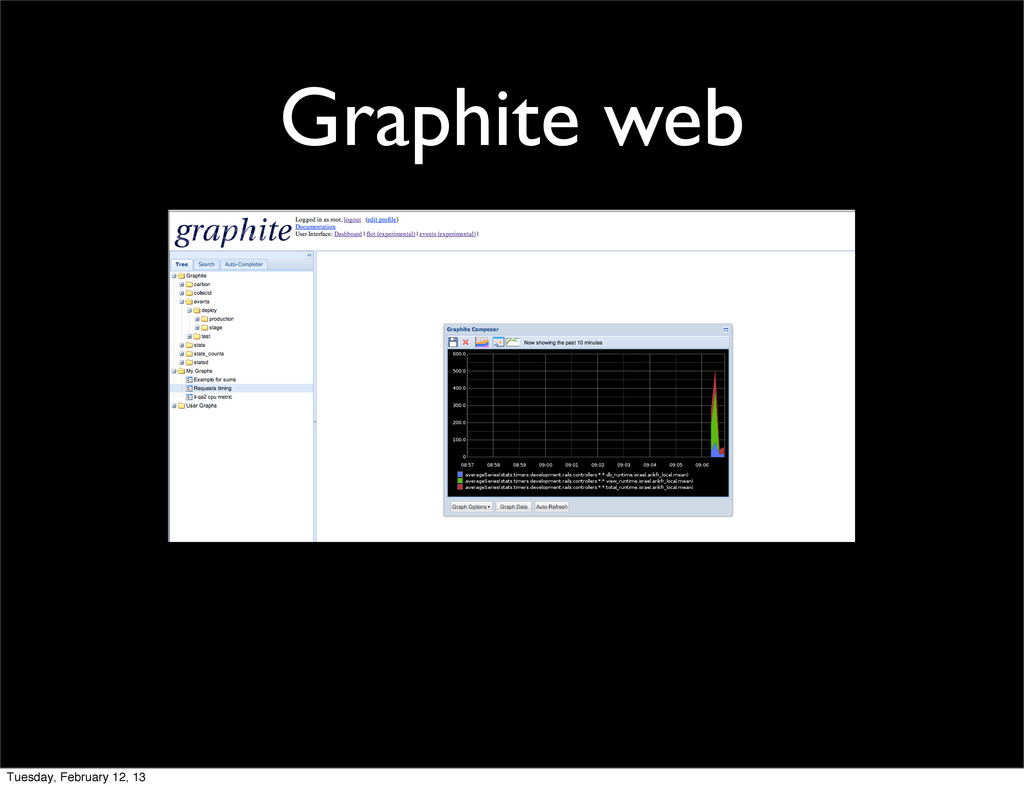
    that it’s a tree. • We use: • {env}.{metric}.{region}.{hostname} • You can use globs, when querying: • app.orders.daily.completed.israel.* • app.orders.daily.completed.*.* Tuesday, February 12, 13
  13. Down sides • Hard to track user analytics • You

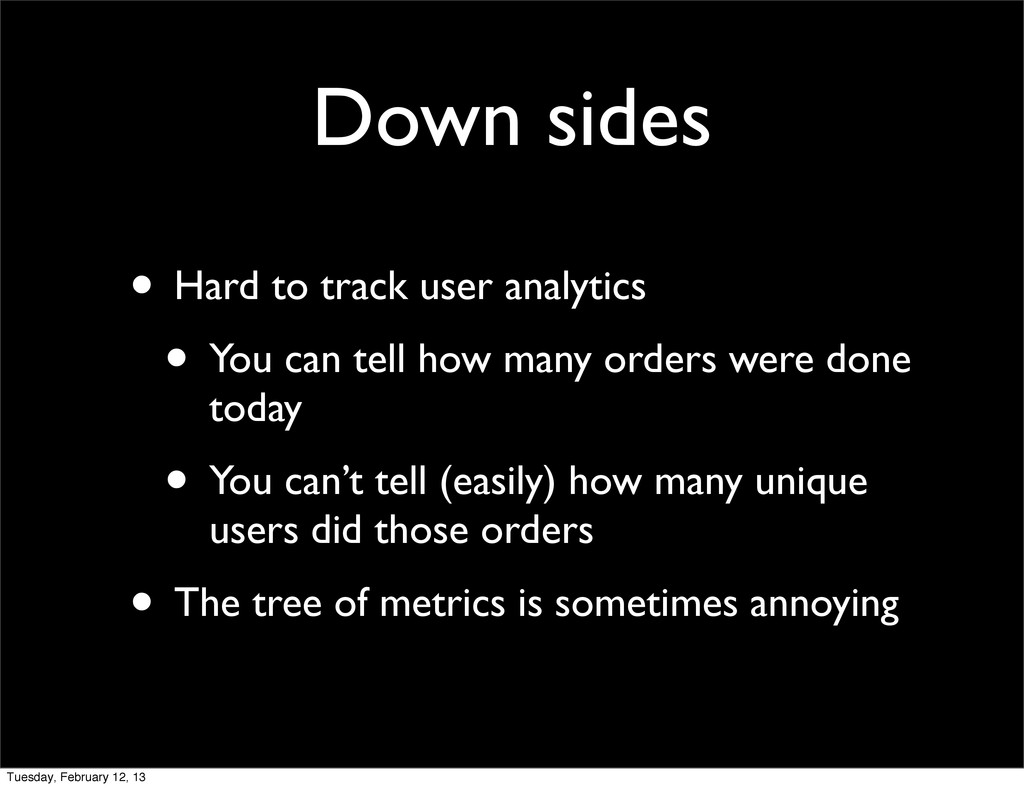
    can tell how many orders were done today • You can’t tell (easily) how many unique users did those orders • The tree of metrics is sometimes annoying Tuesday, February 12, 13