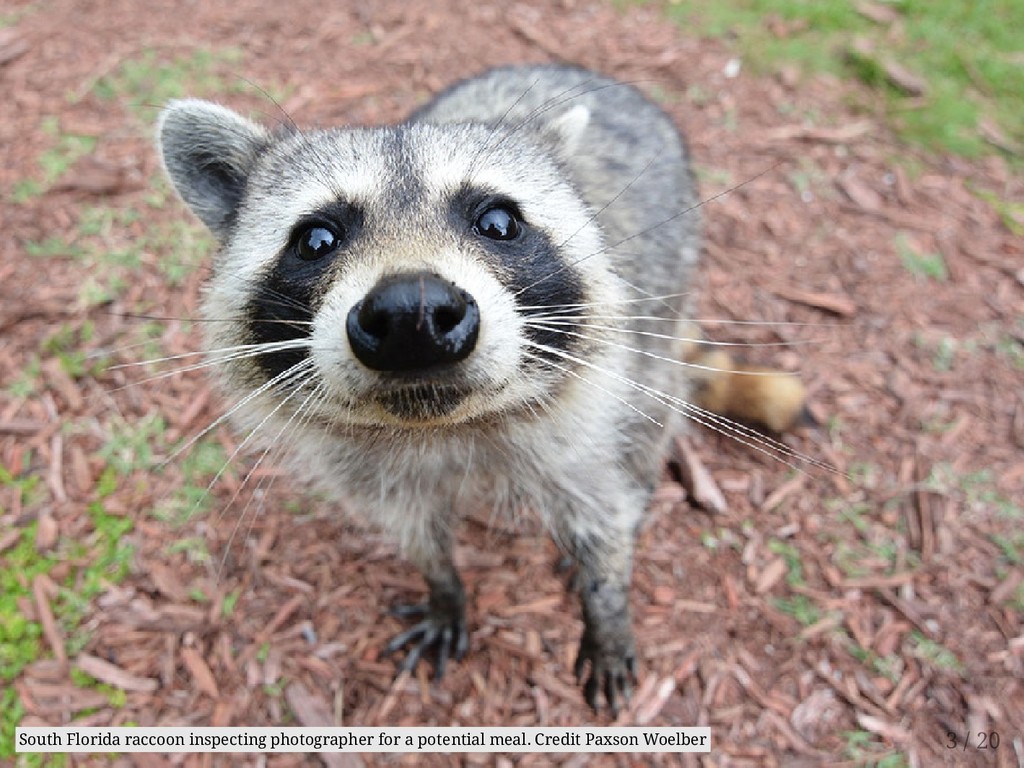
where my application was accepted. Then we realisied that we work well with each other, so why not continue in a GSoC 2017 project? The project idea came from the Movement and Habitat Laboratory (MabLab) at the University of Florida’s Fort Lauderdale Research and Education Center. 2 / 20
where my application was accepted. Then we realisied that we work well with each other, so why not continue in a GSoC 2017 project? The project idea came from the Movement and Habitat Laboratory (MabLab) at the University of Florida’s Fort Lauderdale Research and Education Center. MabLab a quantitative ecology lab focusing on spatial ecology — and in particular movement 2 / 20
where my application was accepted. Then we realisied that we work well with each other, so why not continue in a GSoC 2017 project? The project idea came from the Movement and Habitat Laboratory (MabLab) at the University of Florida’s Fort Lauderdale Research and Education Center. MabLab a quantitative ecology lab focusing on spatial ecology — and in particular movement needed good tools to work with the data that they collect on the field everyday (mainly with GPS trackers) 2 / 20
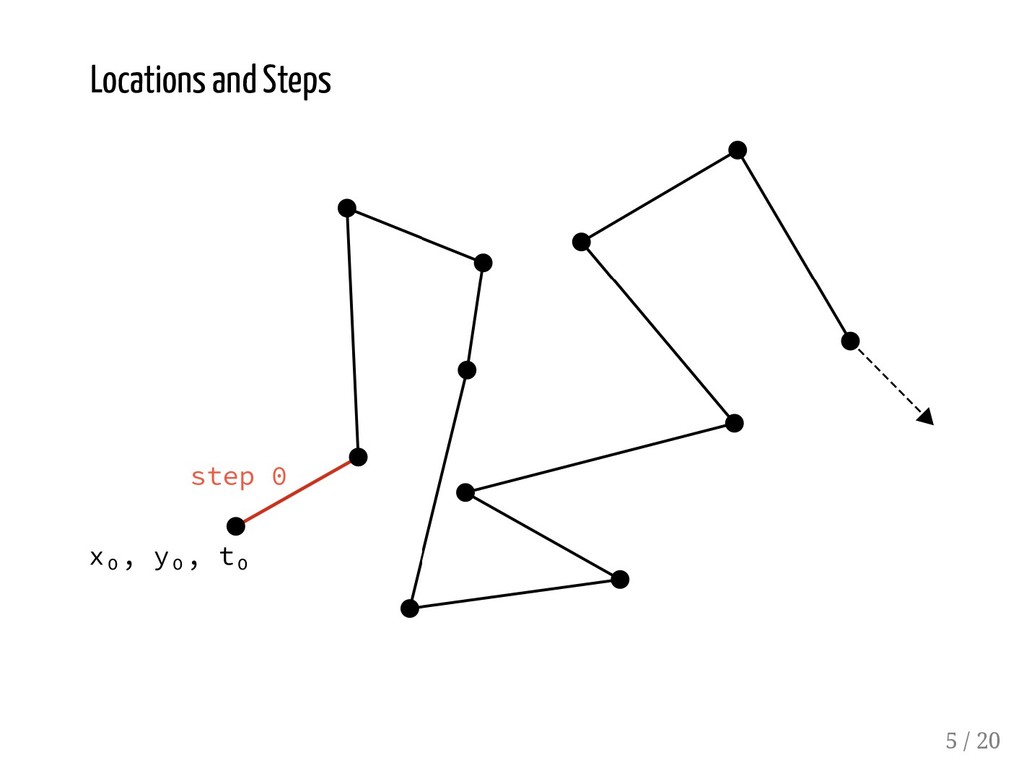
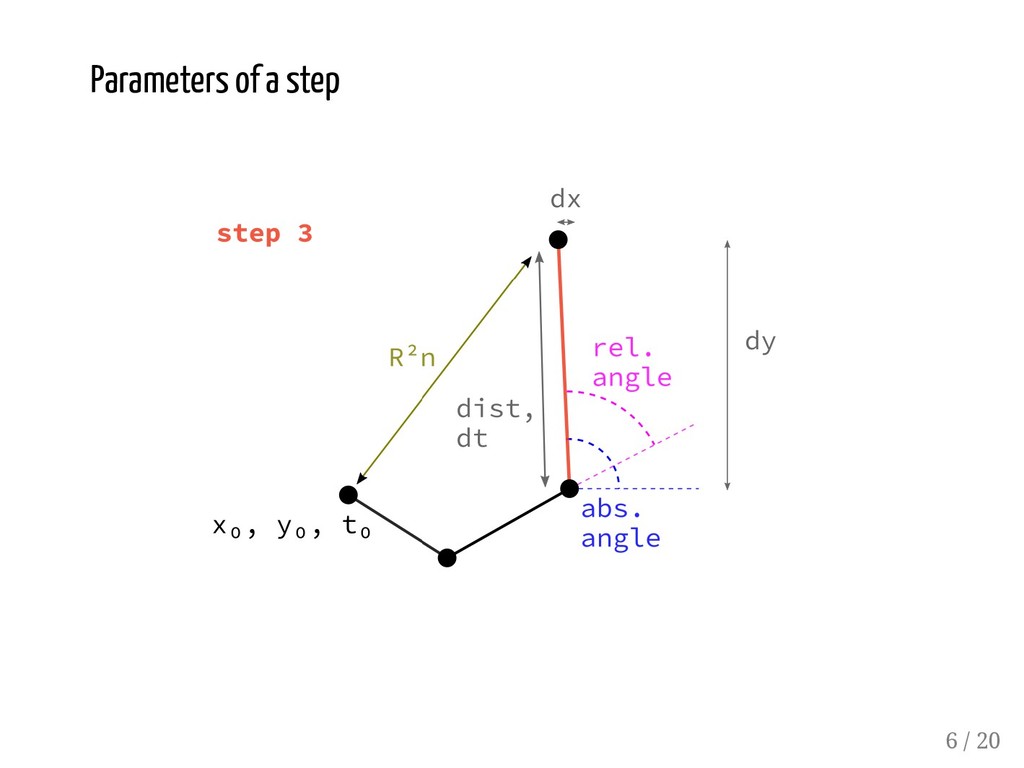
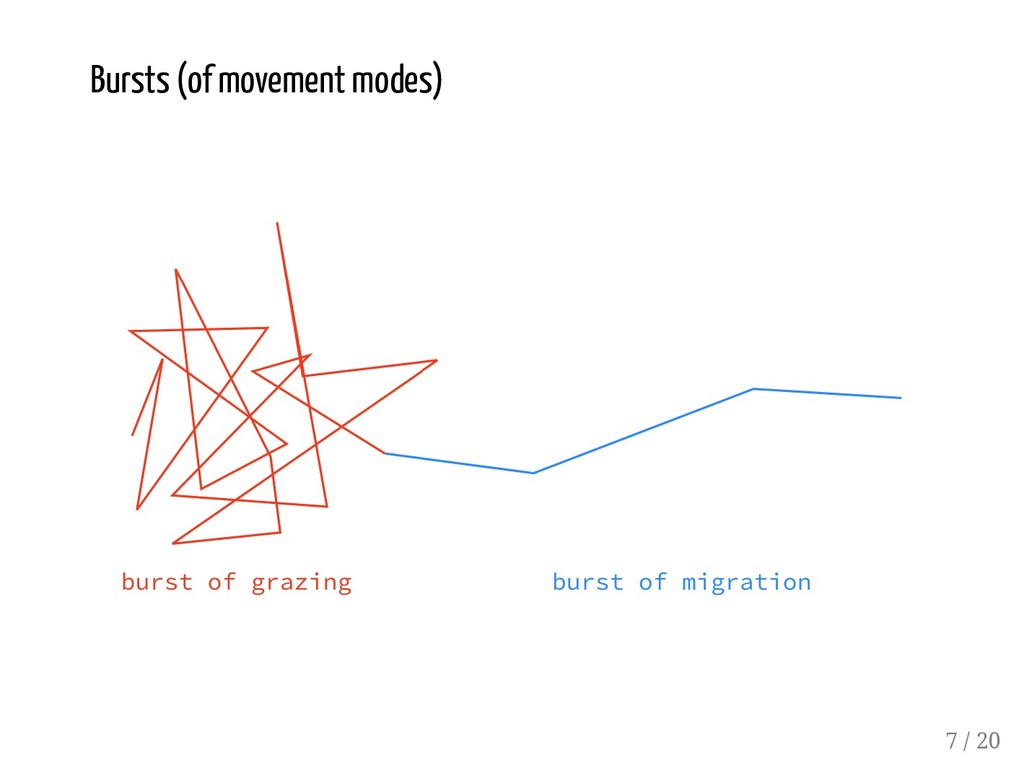
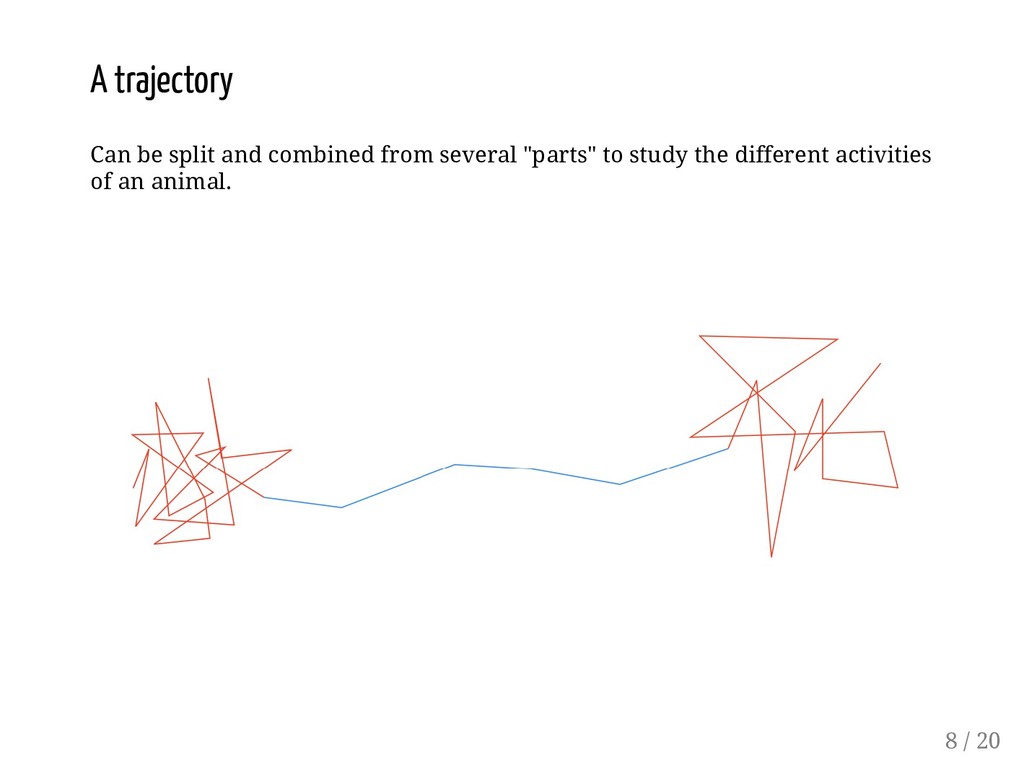
Dray, S., & Royer-Carenzi, M. (2009). The concept of animals' trajectories from a data analysis perspective. Ecological informatics, 4(1), 34-41. 4 / 20
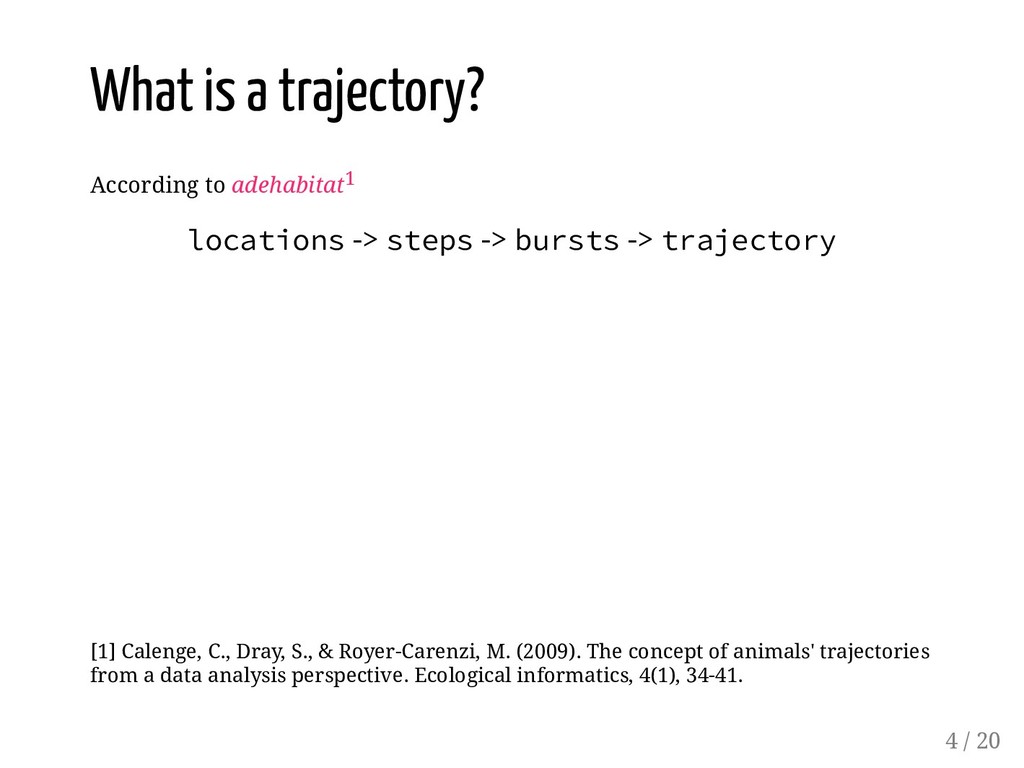
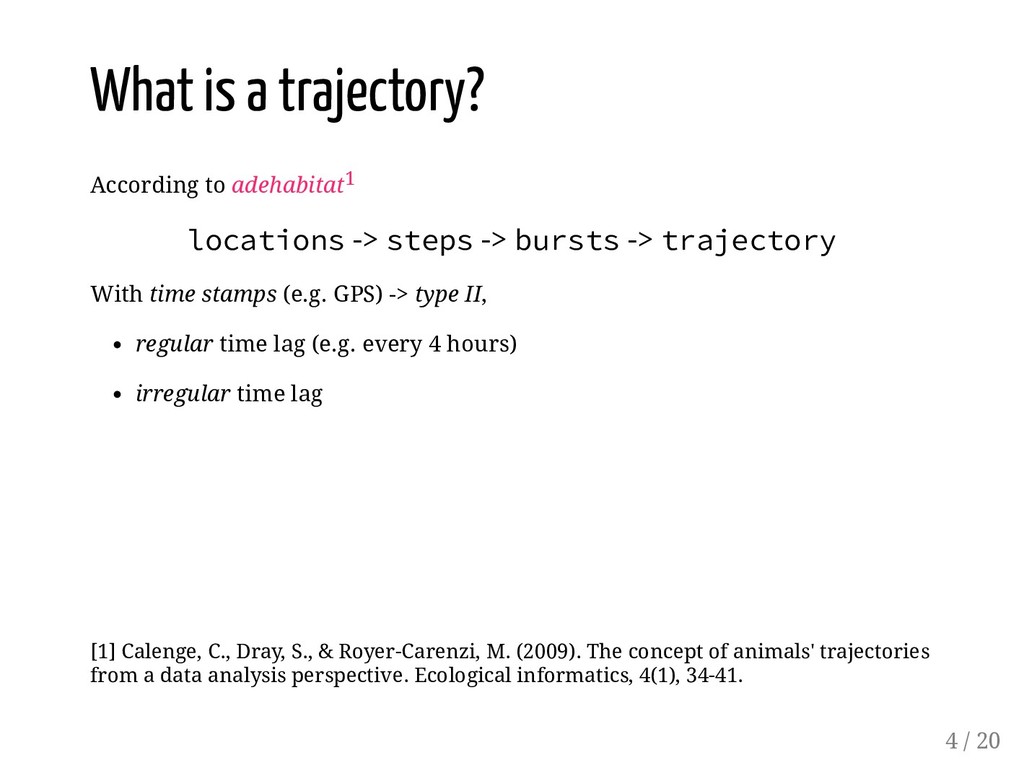
-> bursts -> trajectory [1] Calenge, C., Dray, S., & Royer-Carenzi, M. (2009). The concept of animals' trajectories from a data analysis perspective. Ecological informatics, 4(1), 34-41. 4 / 20
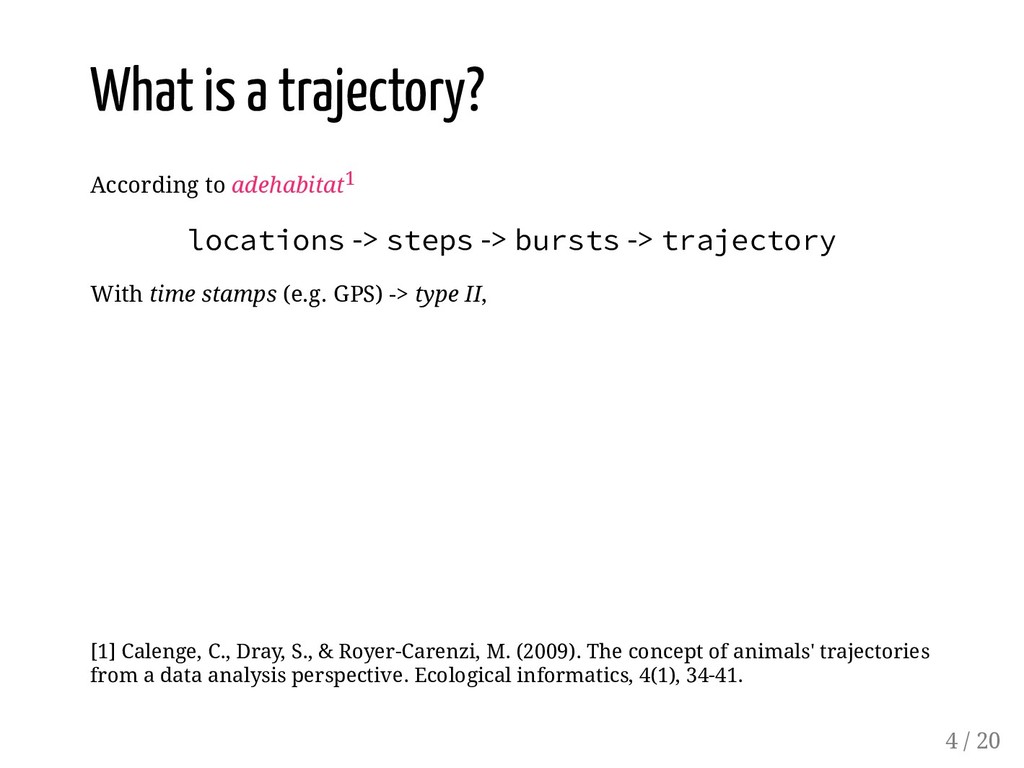
-> bursts -> trajectory With time stamps (e.g. GPS) -> type II, [1] Calenge, C., Dray, S., & Royer-Carenzi, M. (2009). The concept of animals' trajectories from a data analysis perspective. Ecological informatics, 4(1), 34-41. 4 / 20
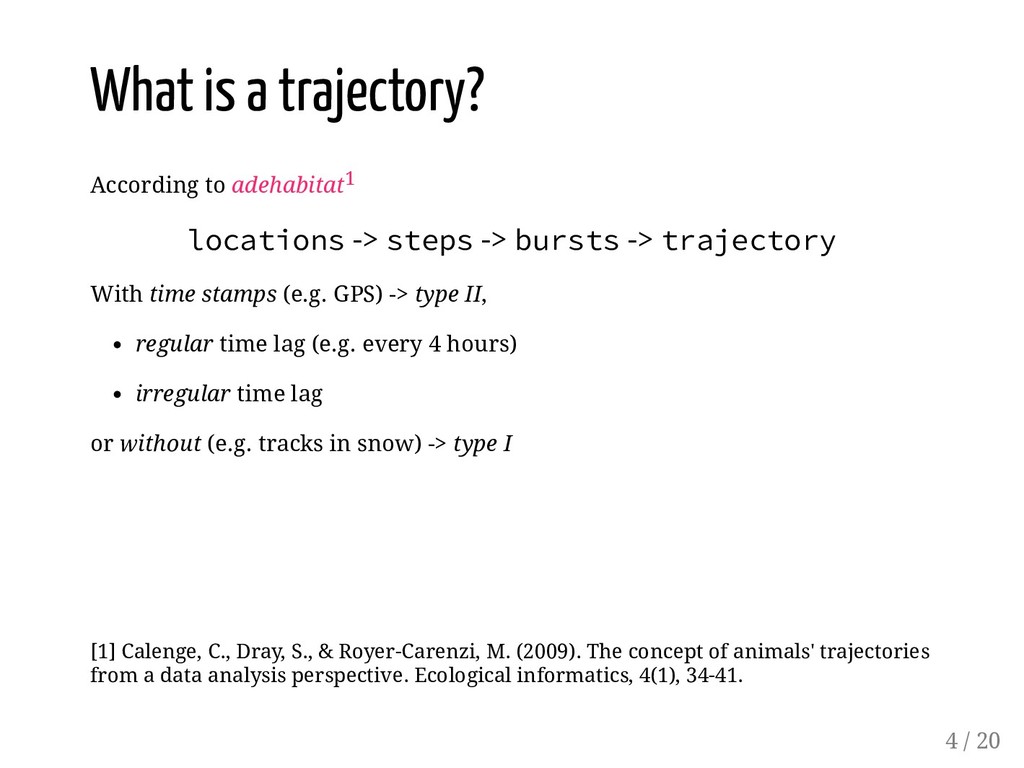
-> bursts -> trajectory With time stamps (e.g. GPS) -> type II, regular time lag (e.g. every 4 hours) irregular time lag [1] Calenge, C., Dray, S., & Royer-Carenzi, M. (2009). The concept of animals' trajectories from a data analysis perspective. Ecological informatics, 4(1), 34-41. 4 / 20
-> bursts -> trajectory With time stamps (e.g. GPS) -> type II, regular time lag (e.g. every 4 hours) irregular time lag or without (e.g. tracks in snow) -> type I [1] Calenge, C., Dray, S., & Royer-Carenzi, M. (2009). The concept of animals' trajectories from a data analysis perspective. Ecological informatics, 4(1), 34-41. 4 / 20
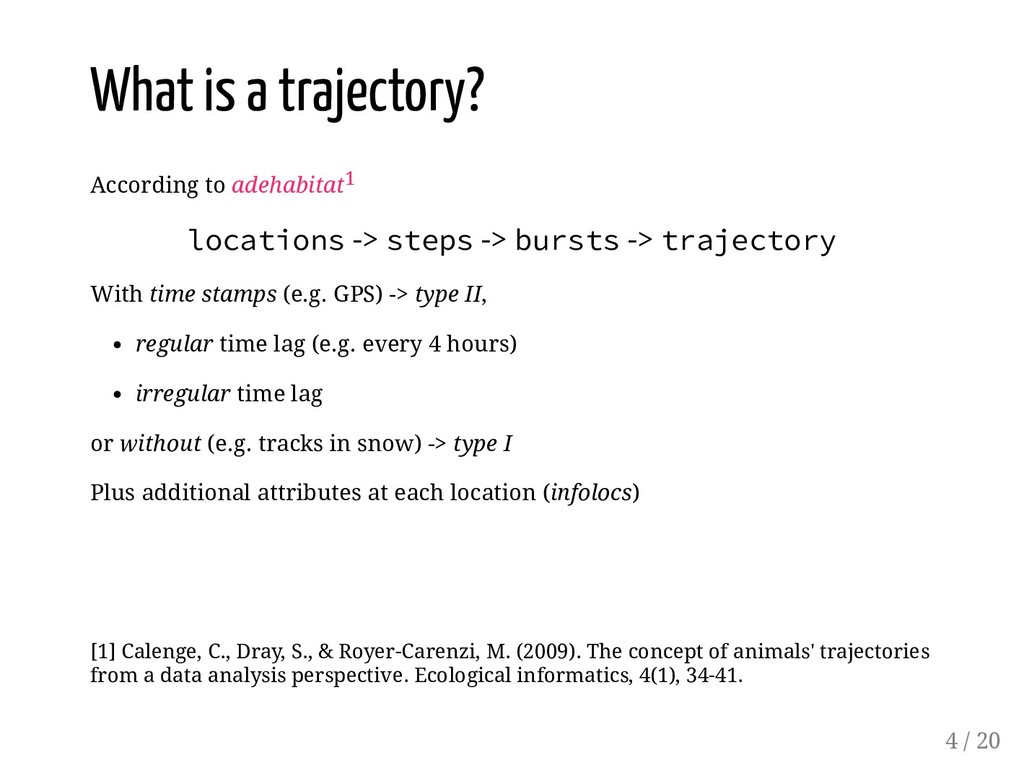
-> bursts -> trajectory With time stamps (e.g. GPS) -> type II, regular time lag (e.g. every 4 hours) irregular time lag or without (e.g. tracks in snow) -> type I Plus additional attributes at each location (infolocs) [1] Calenge, C., Dray, S., & Royer-Carenzi, M. (2009). The concept of animals' trajectories from a data analysis perspective. Ecological informatics, 4(1), 34-41. 4 / 20
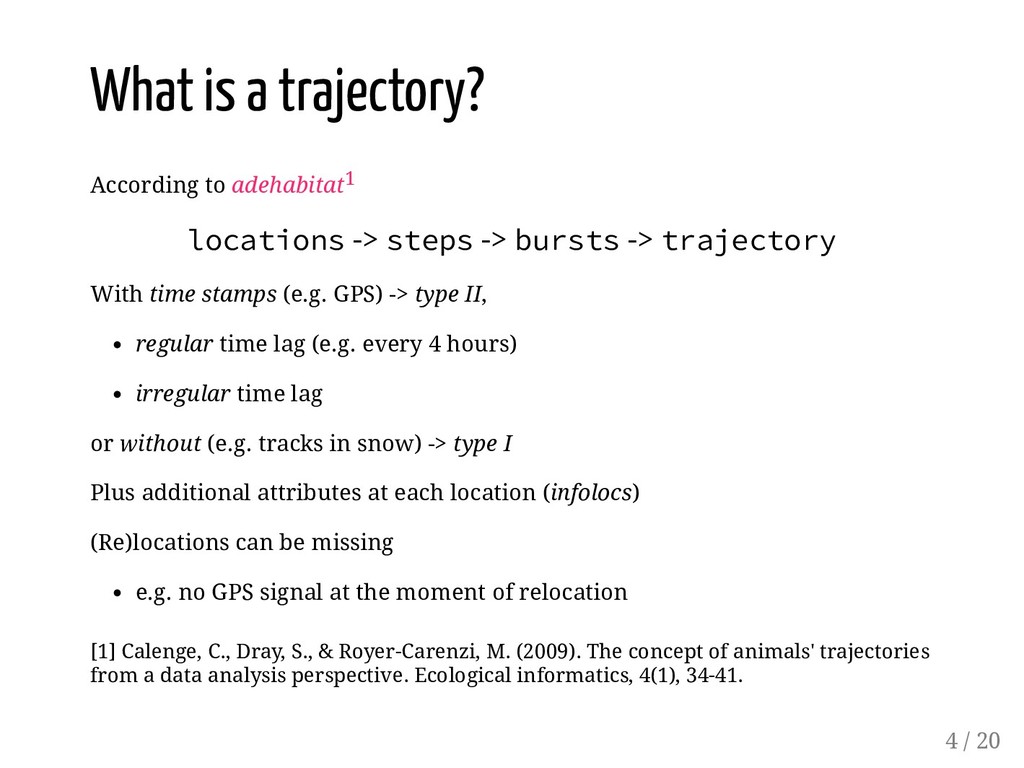
-> bursts -> trajectory With time stamps (e.g. GPS) -> type II, regular time lag (e.g. every 4 hours) irregular time lag or without (e.g. tracks in snow) -> type I Plus additional attributes at each location (infolocs) (Re)locations can be missing e.g. no GPS signal at the moment of relocation [1] Calenge, C., Dray, S., & Royer-Carenzi, M. (2009). The concept of animals' trajectories from a data analysis perspective. Ecological informatics, 4(1), 34-41. 4 / 20
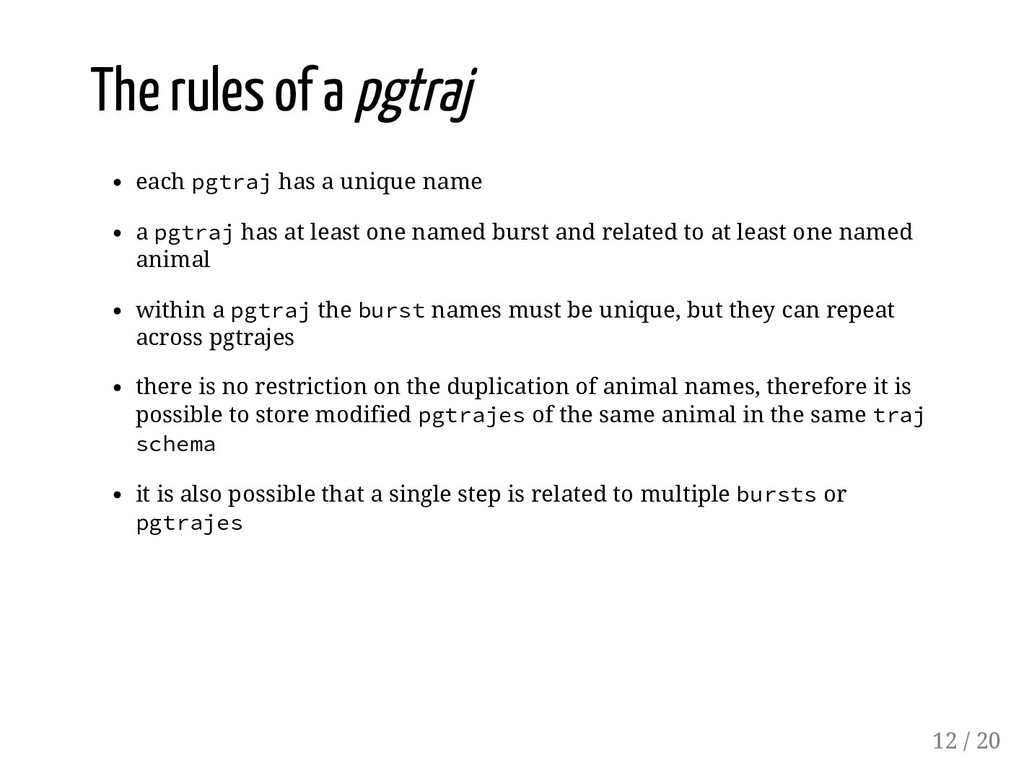
name a pgtraj has at least one named burst and related to at least one named animal within a pgtraj the burst names must be unique, but they can repeat across pgtrajes 12 / 20
name a pgtraj has at least one named burst and related to at least one named animal within a pgtraj the burst names must be unique, but they can repeat across pgtrajes there is no restriction on the duplication of animal names, therefore it is possible to store modified pgtrajes of the same animal in the same traj schema 12 / 20
name a pgtraj has at least one named burst and related to at least one named animal within a pgtraj the burst names must be unique, but they can repeat across pgtrajes there is no restriction on the duplication of animal names, therefore it is possible to store modified pgtrajes of the same animal in the same traj schema it is also possible that a single step is related to multiple bursts or pgtrajes 12 / 20
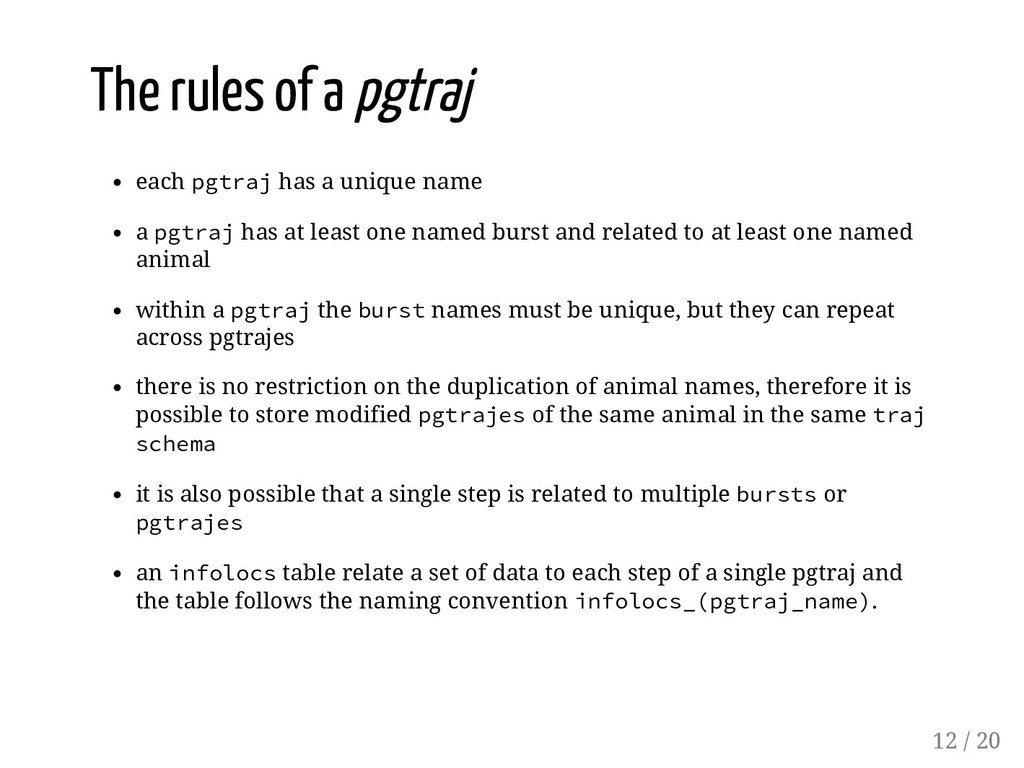
name a pgtraj has at least one named burst and related to at least one named animal within a pgtraj the burst names must be unique, but they can repeat across pgtrajes there is no restriction on the duplication of animal names, therefore it is possible to store modified pgtrajes of the same animal in the same traj schema it is also possible that a single step is related to multiple bursts or pgtrajes an infolocs table relate a set of data to each step of a single pgtraj and the table follows the naming convention infolocs_(pgtraj_name). 12 / 20
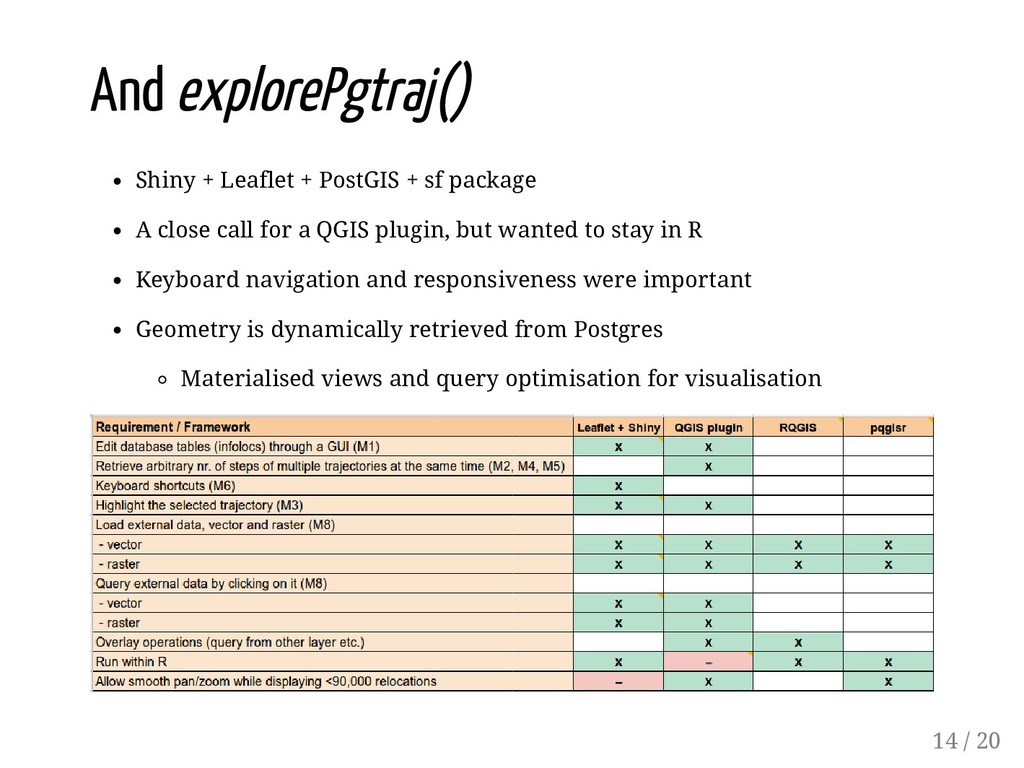
A close call for a QGIS plugin, but wanted to stay in R Keyboard navigation and responsiveness were important Geometry is dynamically retrieved from Postgres Materialised views and query optimisation for visualisation 14 / 20
A close call for a QGIS plugin, but wanted to stay in R Keyboard navigation and responsiveness were important Geometry is dynamically retrieved from Postgres Materialised views and query optimisation for visualisation 14 / 20
for dynamic trajectory visualisation Need performance from a database for visualisation? Consider materialising your data A thorough requirements analysis (e.g. MoSCoW) is a good way to create a common understanding of the project and avoid the "let's just quickly implement this cool extra feature..." 15 / 20
for dynamic trajectory visualisation Need performance from a database for visualisation? Consider materialising your data A thorough requirements analysis (e.g. MoSCoW) is a good way to create a common understanding of the project and avoid the "let's just quickly implement this cool extra feature..." README-driven development -> write the README first, then the code 15 / 20
for dynamic trajectory visualisation Need performance from a database for visualisation? Consider materialising your data A thorough requirements analysis (e.g. MoSCoW) is a good way to create a common understanding of the project and avoid the "let's just quickly implement this cool extra feature..." README-driven development -> write the README first, then the code Trying to make a GIS with R? Maybe rather bring R into a GIS (e.g. QGIS). There are benefits to each approach. Who will use your tool? What do you expect from them to know? 15 / 20
for dynamic trajectory visualisation Need performance from a database for visualisation? Consider materialising your data A thorough requirements analysis (e.g. MoSCoW) is a good way to create a common understanding of the project and avoid the "let's just quickly implement this cool extra feature..." README-driven development -> write the README first, then the code Trying to make a GIS with R? Maybe rather bring R into a GIS (e.g. QGIS). There are benefits to each approach. Who will use your tool? What do you expect from them to know? Testing, testing, testing...But watch out for the overhead in maintenance 15 / 20
for dynamic trajectory visualisation Need performance from a database for visualisation? Consider materialising your data A thorough requirements analysis (e.g. MoSCoW) is a good way to create a common understanding of the project and avoid the "let's just quickly implement this cool extra feature..." README-driven development -> write the README first, then the code Trying to make a GIS with R? Maybe rather bring R into a GIS (e.g. QGIS). There are benefits to each approach. Who will use your tool? What do you expect from them to know? Testing, testing, testing...But watch out for the overhead in maintenance Who will maintain the code? 15 / 20
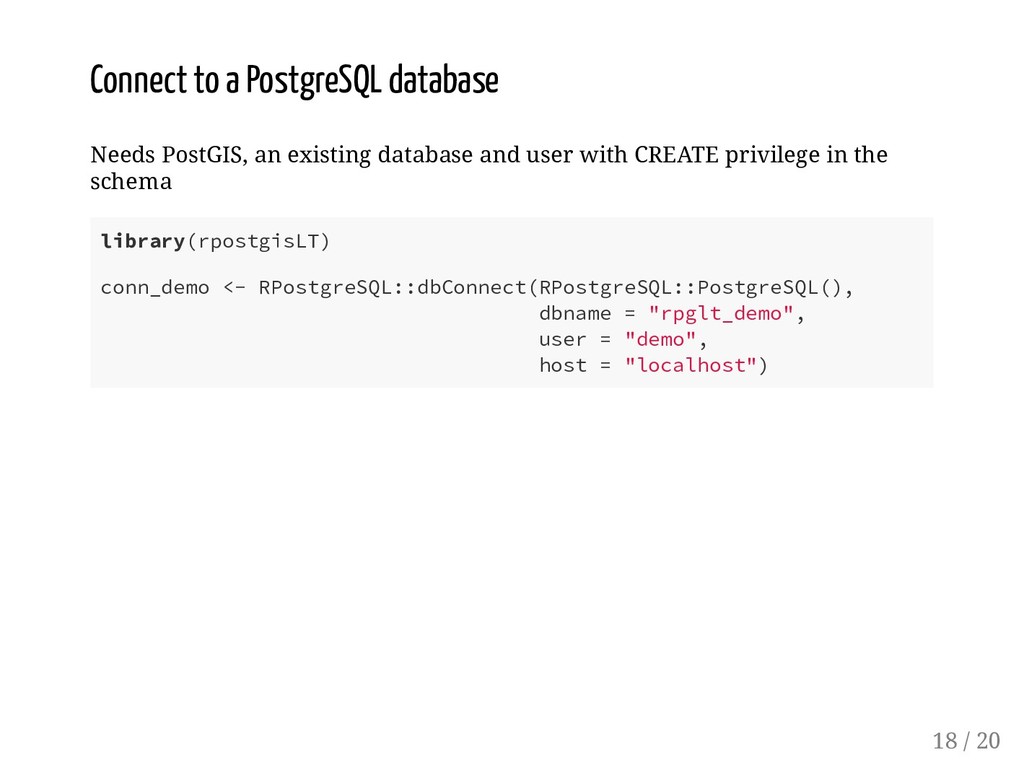
and user with CREATE privilege in the schema library(rpostgisLT) conn_demo <- RPostgreSQL::dbConnect(RPostgreSQL::PostgreSQL(), dbname = "rpglt_demo", user = "demo", host = "localhost") 18 / 20


 balazsdukai
 yuta_onishi_97
 kawashimo0
 nokomoro3
 florets1
 guaca
 akihisaikeda
 uyuki234
 kenjiyoneyama
 tomokon
 ryu1013
 tosite
 moro
 honzajavorek
 eileencodes
 kastner
 shpigford
 notwaldorf
 marcduiker
 bryan
 irinanazarova
 tessaabrams
 reverentgeek
 helenjbeal
 samlambert