Upgrade to Pro
— share decks privately, control downloads, hide ads and more …
Speaker Deck
Features
Speaker Deck
PRO
Sign in
Sign up for free
Search
Search
Small Visualization
Search
binx
October 04, 2012
360
3
Share
Embed
Copy iframe code
Copy JS code
Copy link
Start on current slide
Small Visualization
Presented at Cybera Summit, in Banff, Alberta, October 2012
binx
October 04, 2012
More Decks by binx
See All by binx
On the Importance of Iteration
binx
0
140
Designing for Spacecraft Operations
binx
2
650
Place and Space
binx
0
550
Error: Success
binx
0
550
Peak Visualization?
binx
1
620
The Data Visualization Hustle
binx
2
490
People, Not Users
binx
2
270
Data Collection and Memory
binx
1
250
The Road To Code
binx
1
420
Featured
See All Featured
Visualization
eitanlees
152
17k
Automating Front-end Workflow
addyosmani
1370
210k
Learning to Love Humans: Emotional Interface Design
aarron
275
41k
The Pragmatic Product Professional
lauravandoore
37
7.4k
Fashionably flexible responsive web design (full day workshop)
malarkey
408
67k
SEO for Brand Visibility & Recognition
aleyda
0
4.6k
The Hidden Cost of Media on the Web [PixelPalooza 2025]
tammyeverts
2
400
The Mindset for Success: Future Career Progression
greggifford
PRO
0
430
個人開発の失敗を避けるイケてる考え方 / tips for indie hackers
panda_program
123
22k
How GitHub (no longer) Works
holman
316
150k
The Language of Interfaces
destraynor
162
27k
GraphQLの誤解/rethinking-graphql
sonatard
75
12k
Transcript
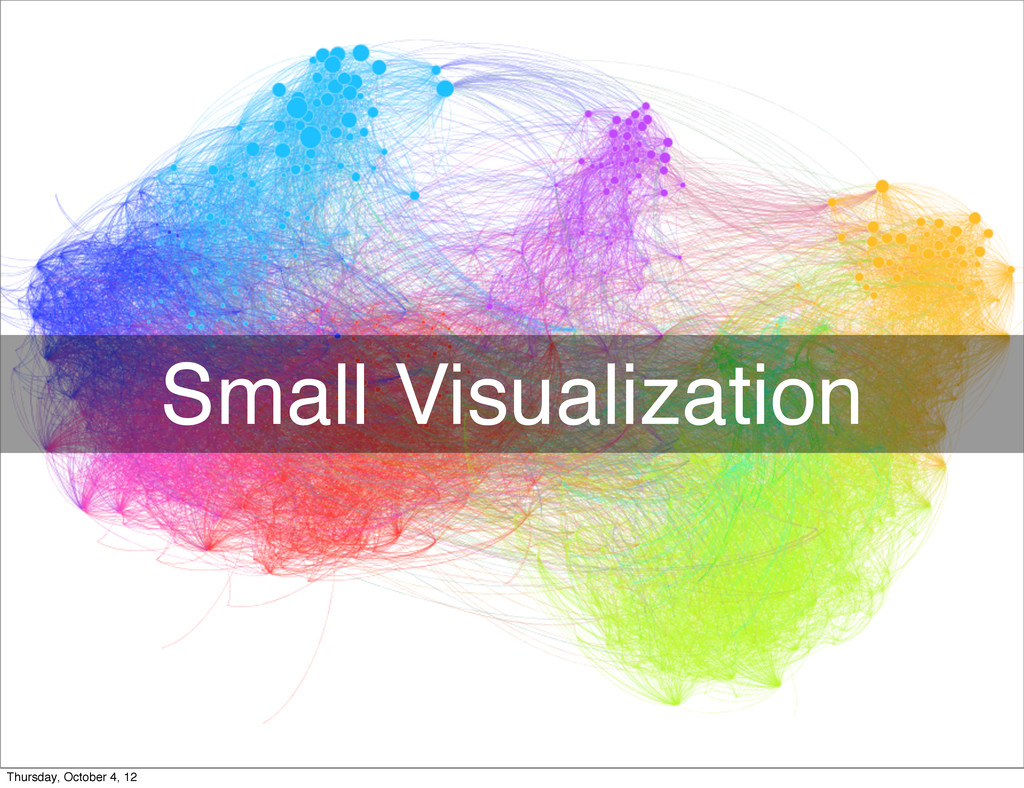
Small Visualization Thursday, October 4, 12
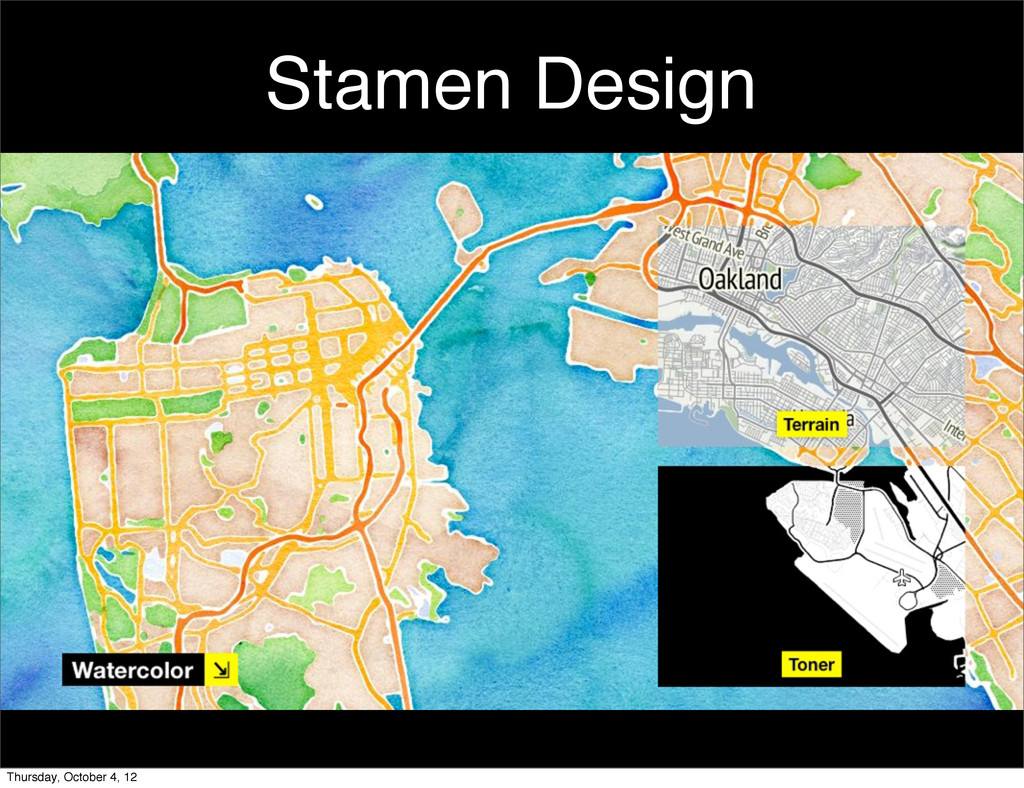
Stamen Design Thursday, October 4, 12
Thursday, October 4, 12
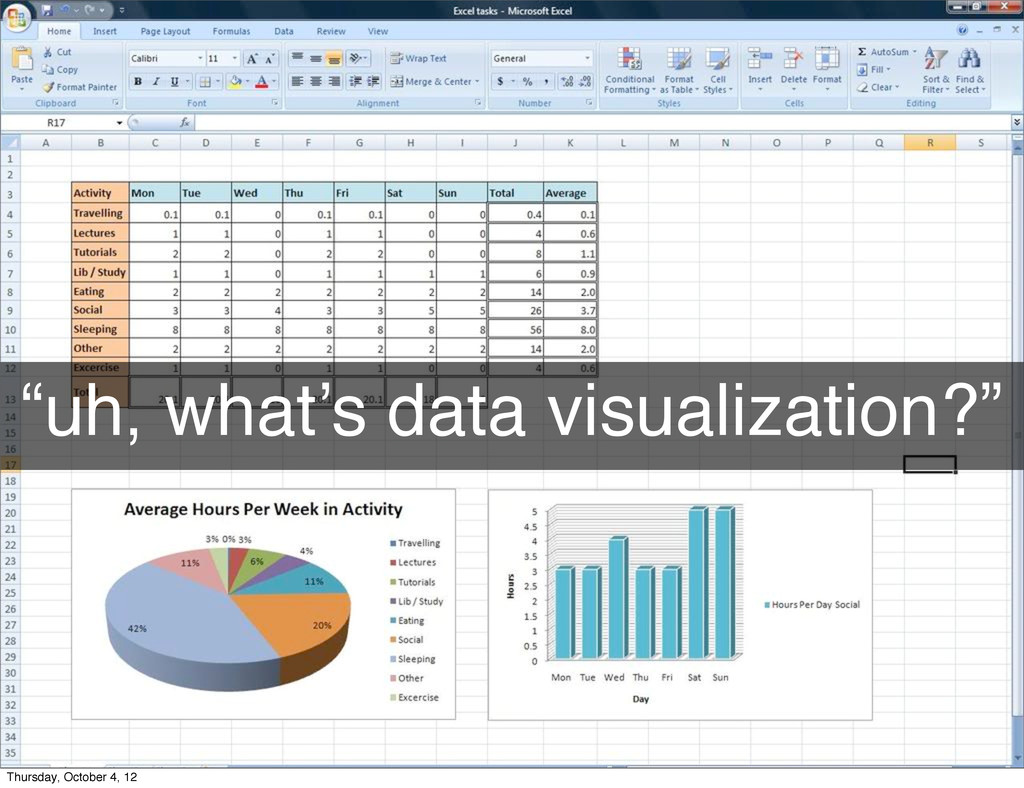
“uh, what’s data visualization?” Thursday, October 4, 12
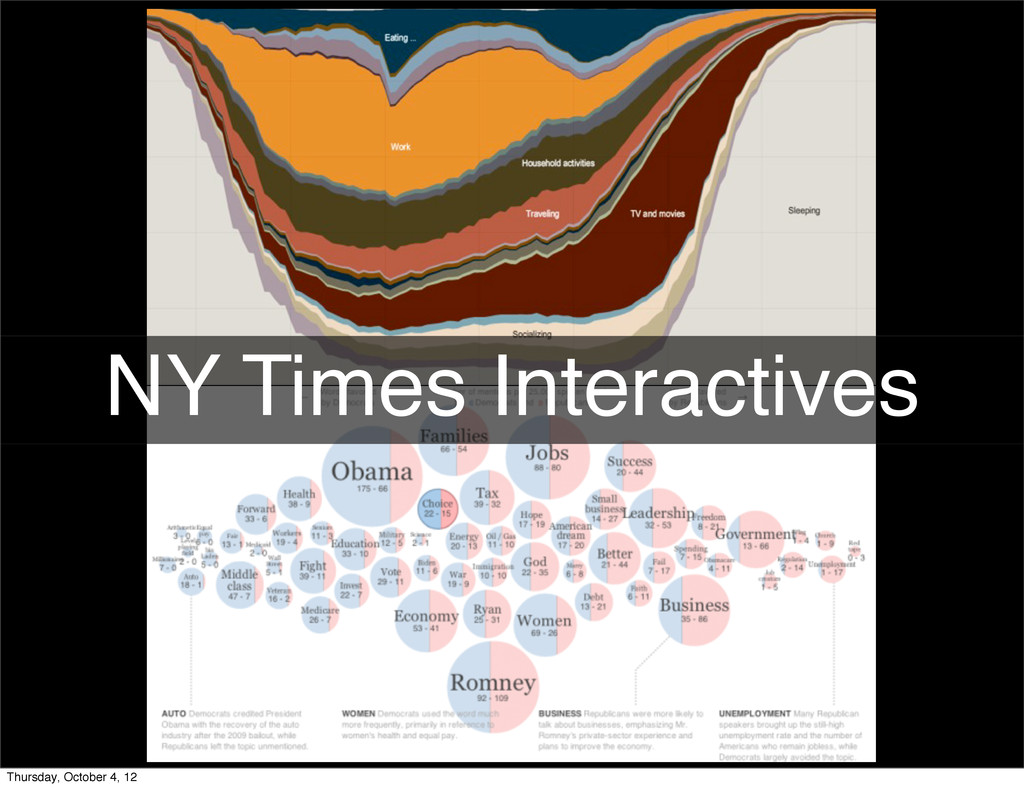
NY Times Interactives Thursday, October 4, 12
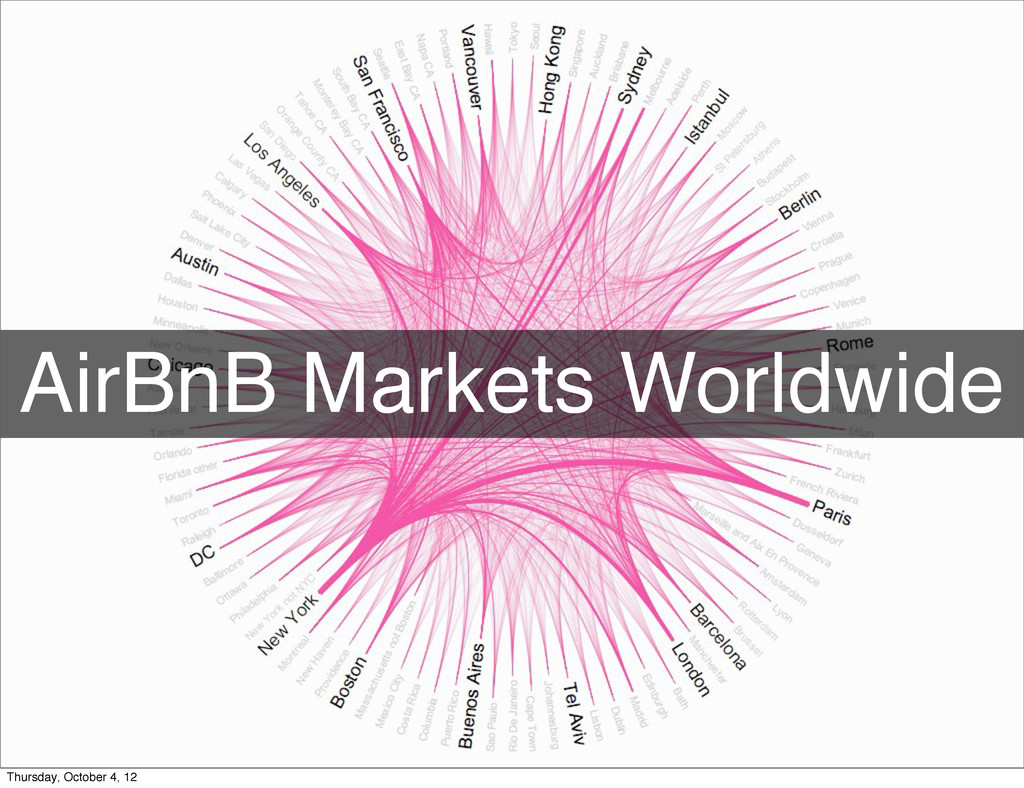
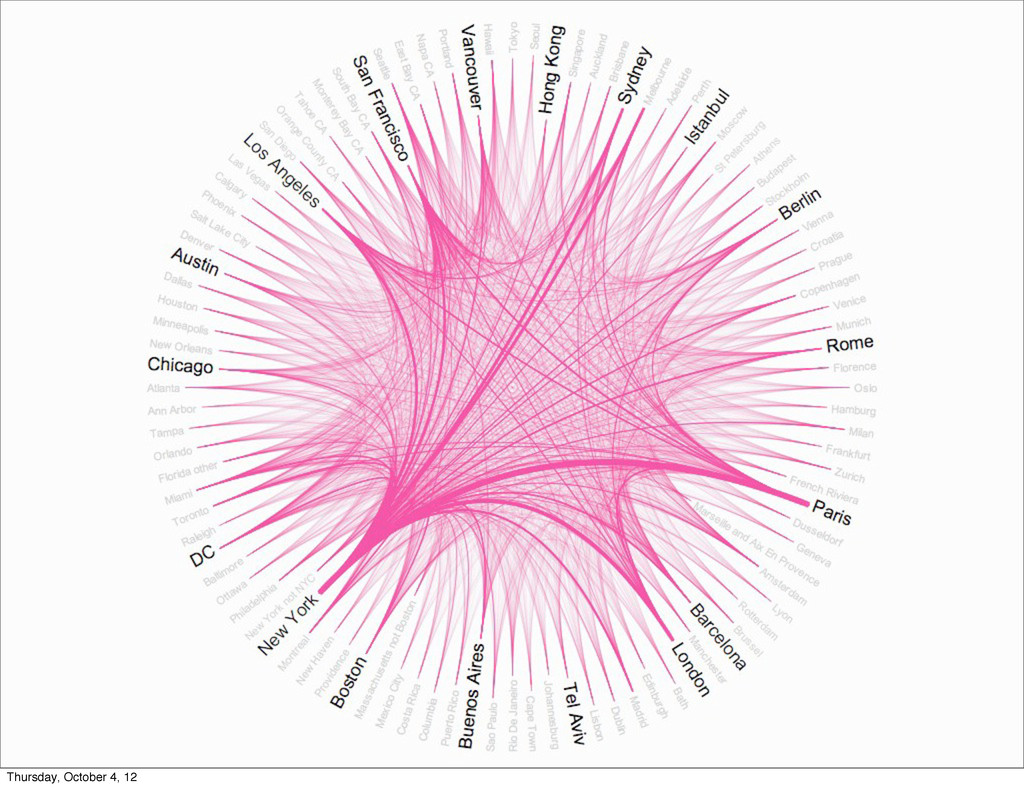
AirBnB Markets Worldwide Thursday, October 4, 12
Thursday, October 4, 12
Small Data, Small Visualization Thursday, October 4, 12
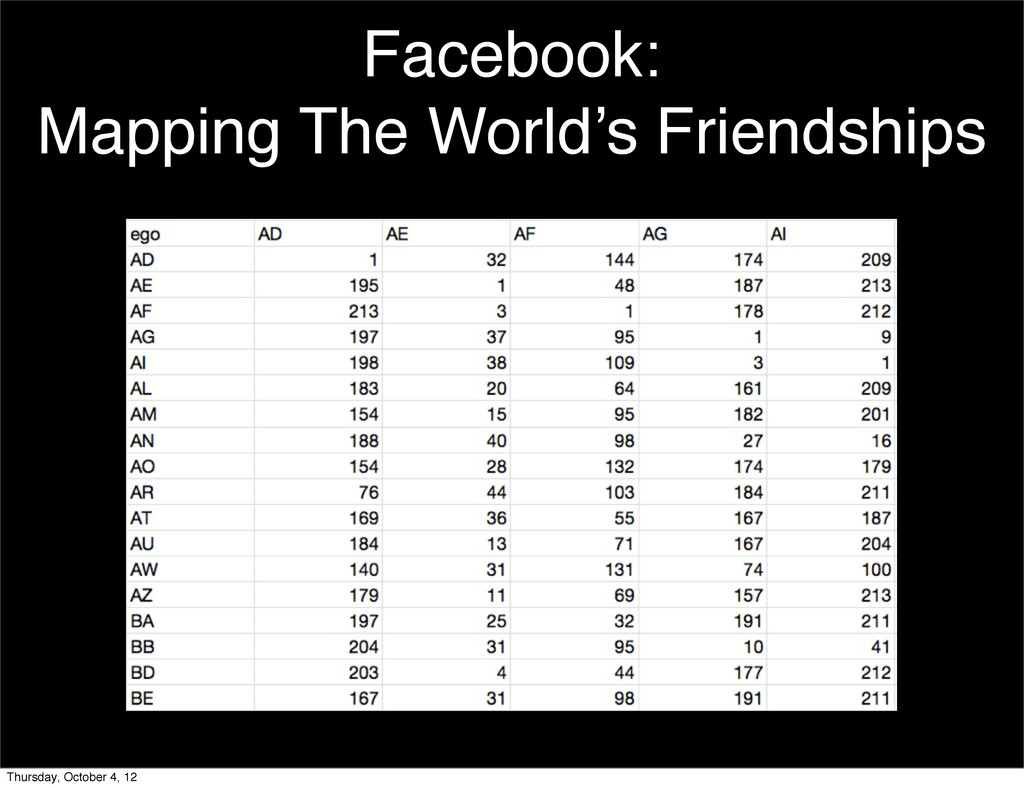
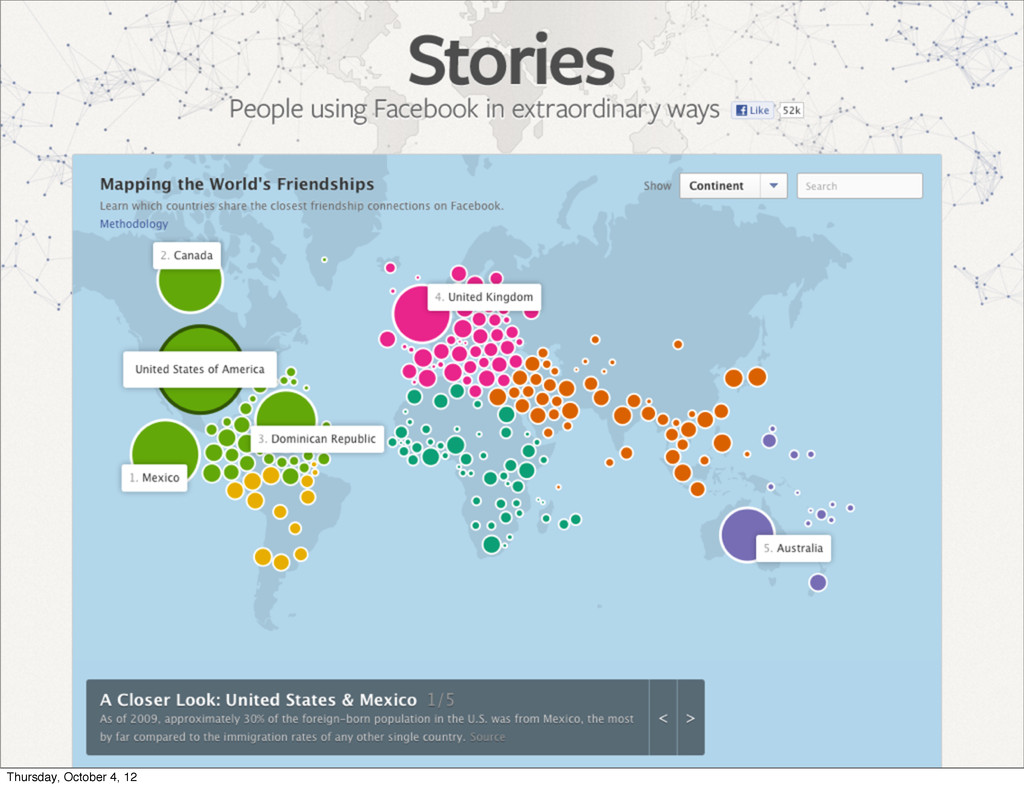
Facebook: Mapping The World’s Friendships Thursday, October 4, 12
Thursday, October 4, 12
Thursday, October 4, 12
The Importance of the Human Connection Thursday, October 4, 12
Thursday, October 4, 12
Thursday, October 4, 12
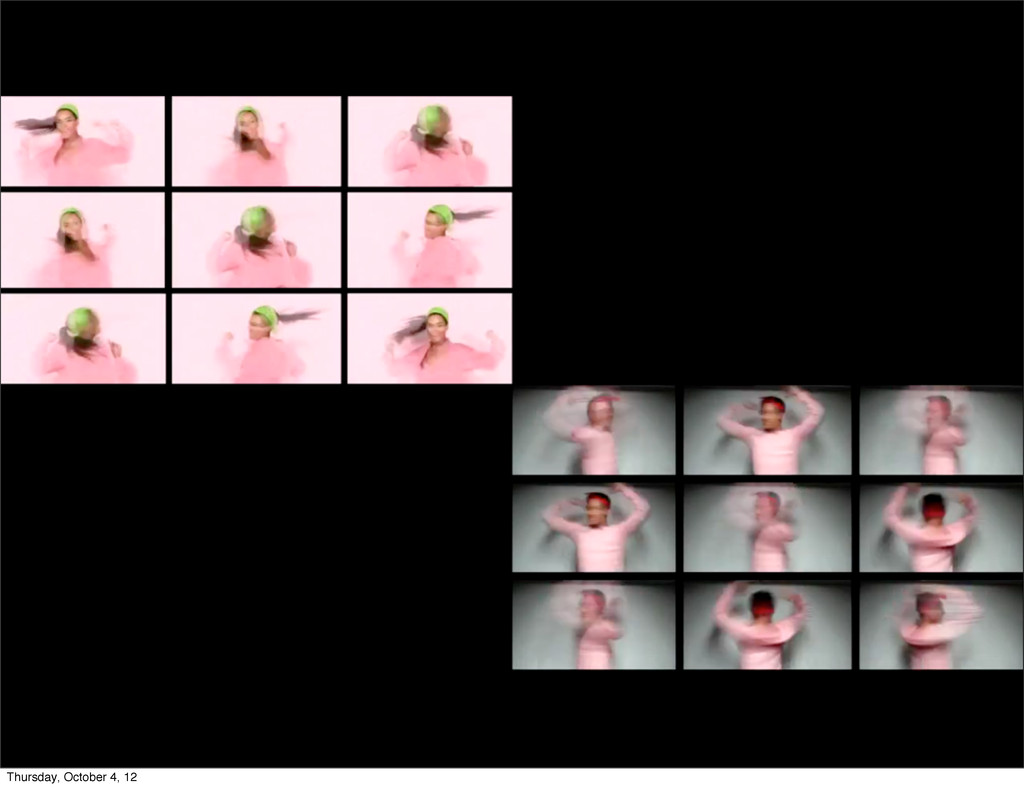
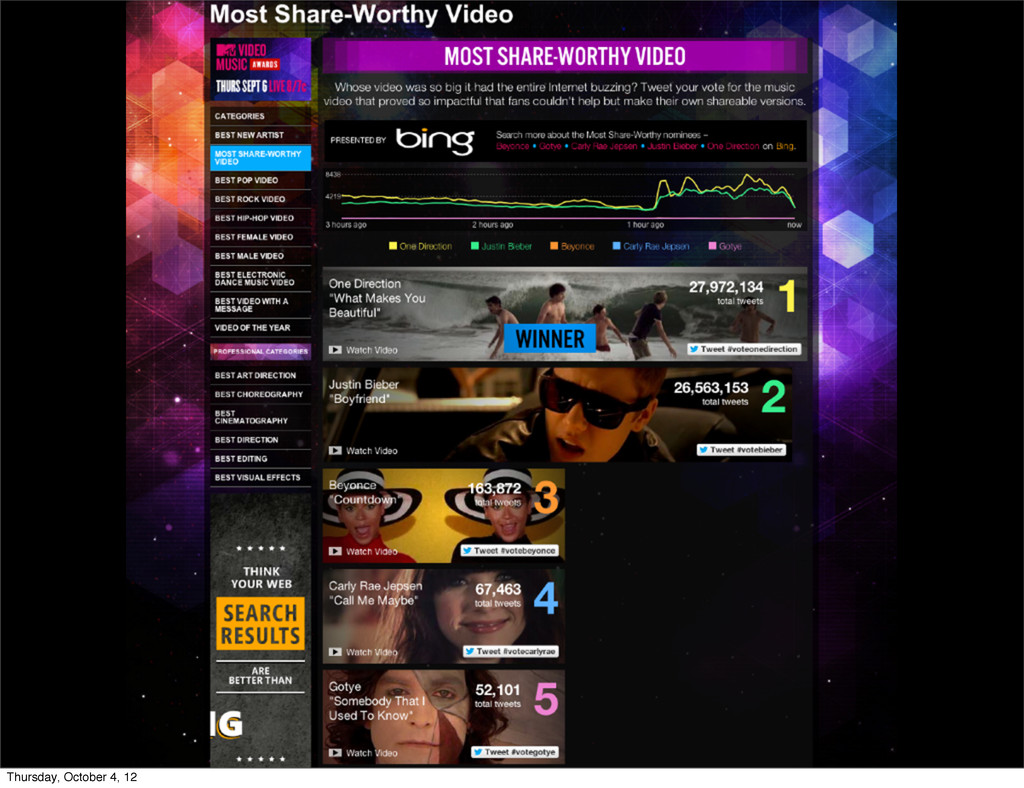
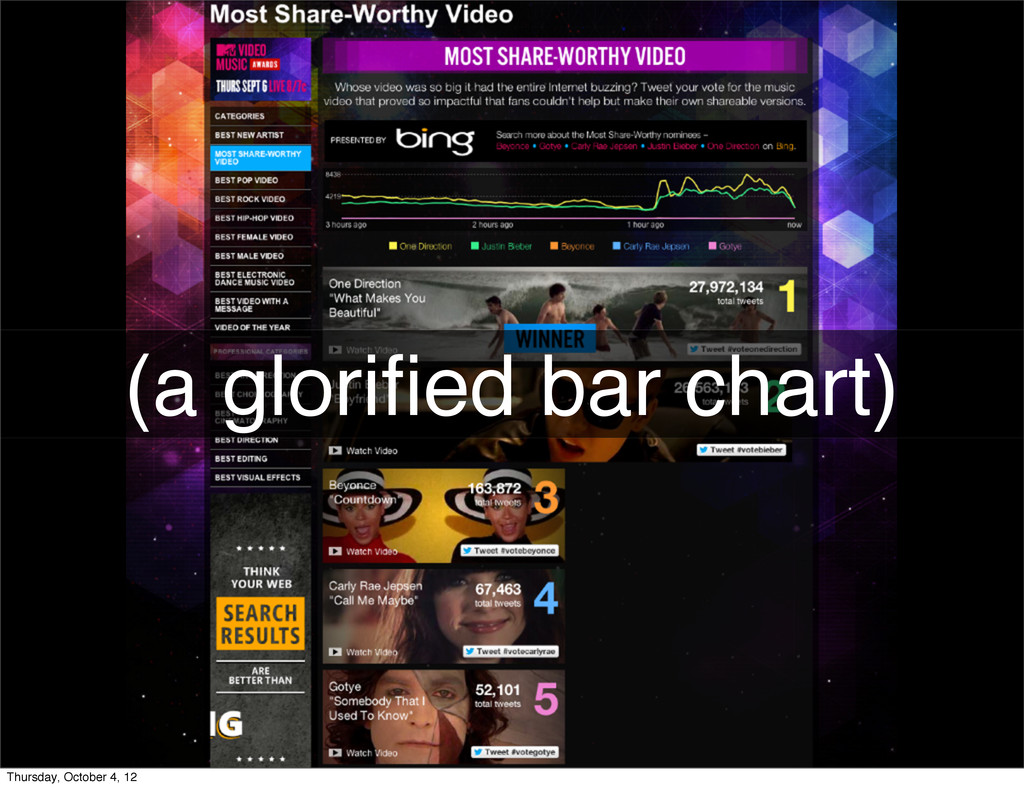
Thursday, October 4, 12
(a glorified bar chart) Thursday, October 4, 12
Thursday, October 4, 12
Thursday, October 4, 12
If Data Visualization Is To Survive, It Will Become Invisible
Thursday, October 4, 12
Thursday, October 4, 12
Thursday, October 4, 12
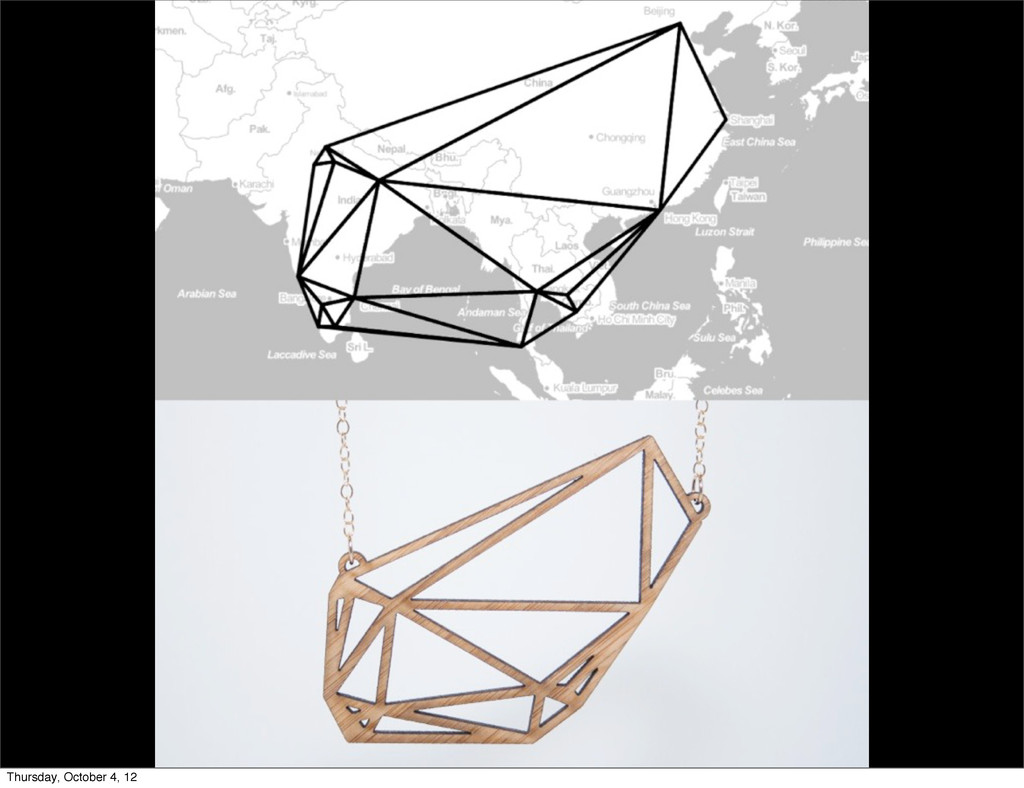
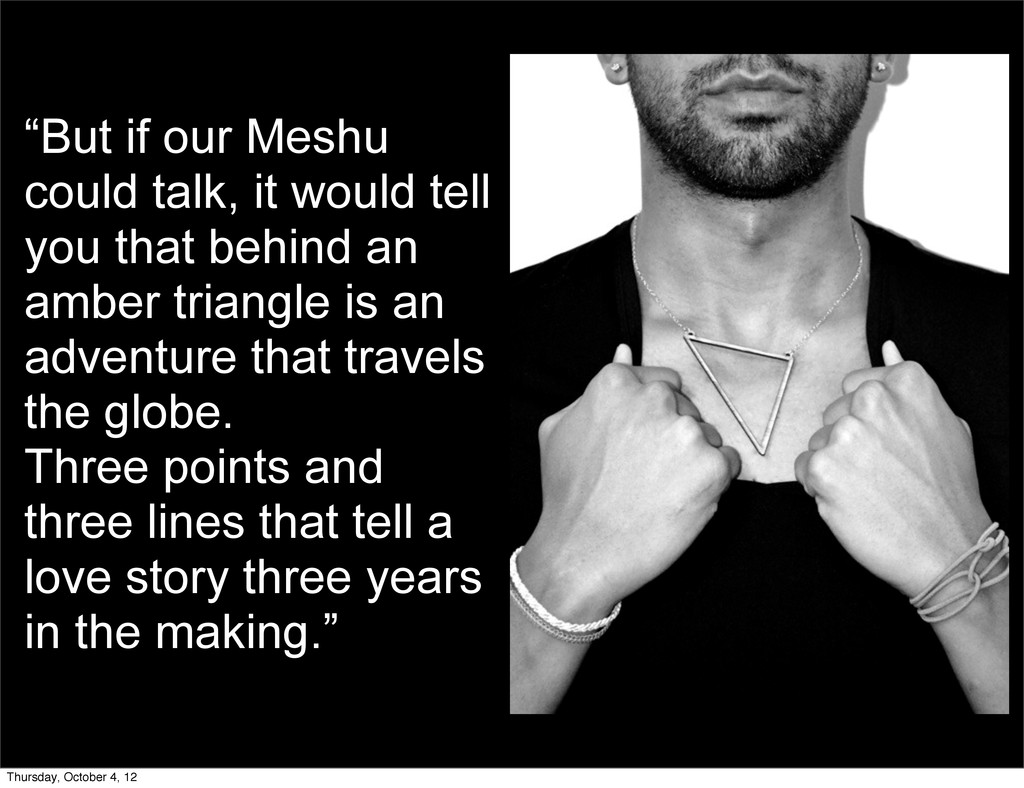
“But if our Meshu could talk, it would tell you
that behind an amber triangle is an adventure that travels the globe. Three points and three lines that tell a love story three years in the making.” Thursday, October 4, 12
Create Visualizations That People Can Connect To. Thursday, October 4,
12
Thanks! @rachelbinx
[email protected]
Thursday, October 4, 12
![Thanks! @rachelbinx [email protected] Thursday, October 4, 12](https://files.speakerdeck.com/presentations/506def3002144e000200e075/slide_23.jpg)