Upgrade to Pro — share decks privately, control downloads, hide ads and more …

The Performance Impact of Telemetry on Java Fra...

The Performance Impact of Telemetry on Java Frameworks

Real-world Java performance is a complex and difficult, if ever-popular, subject.

In this talk, Bruno Baptista presents a showcase of the concerns and problems in evaluating the impact of using frameworks in production Java applications.

We will discuss a year-long project to determine the runtime impact of using OpenTelemetry and Micrometer in a test production-class application based on Quarkus. Towards the end of the talk, we lay out how the approaches and testing methodology (& constraints!) can be applied to testing other frameworks.

Contents:
- Purpose
- A Result
- The Context of that result
- Performance tests in general
- The runs
- Conclusions

Avatar for Bruno Baptista

Bruno Baptista

November 14, 2025

More Decks by Bruno Baptista

Other Decks in Technology

Transcript

  1. Summary 1. Purpose 2. A Result 3. The Context of

    that result 4. Performance tests in general 5. The runs 6. Conclusions
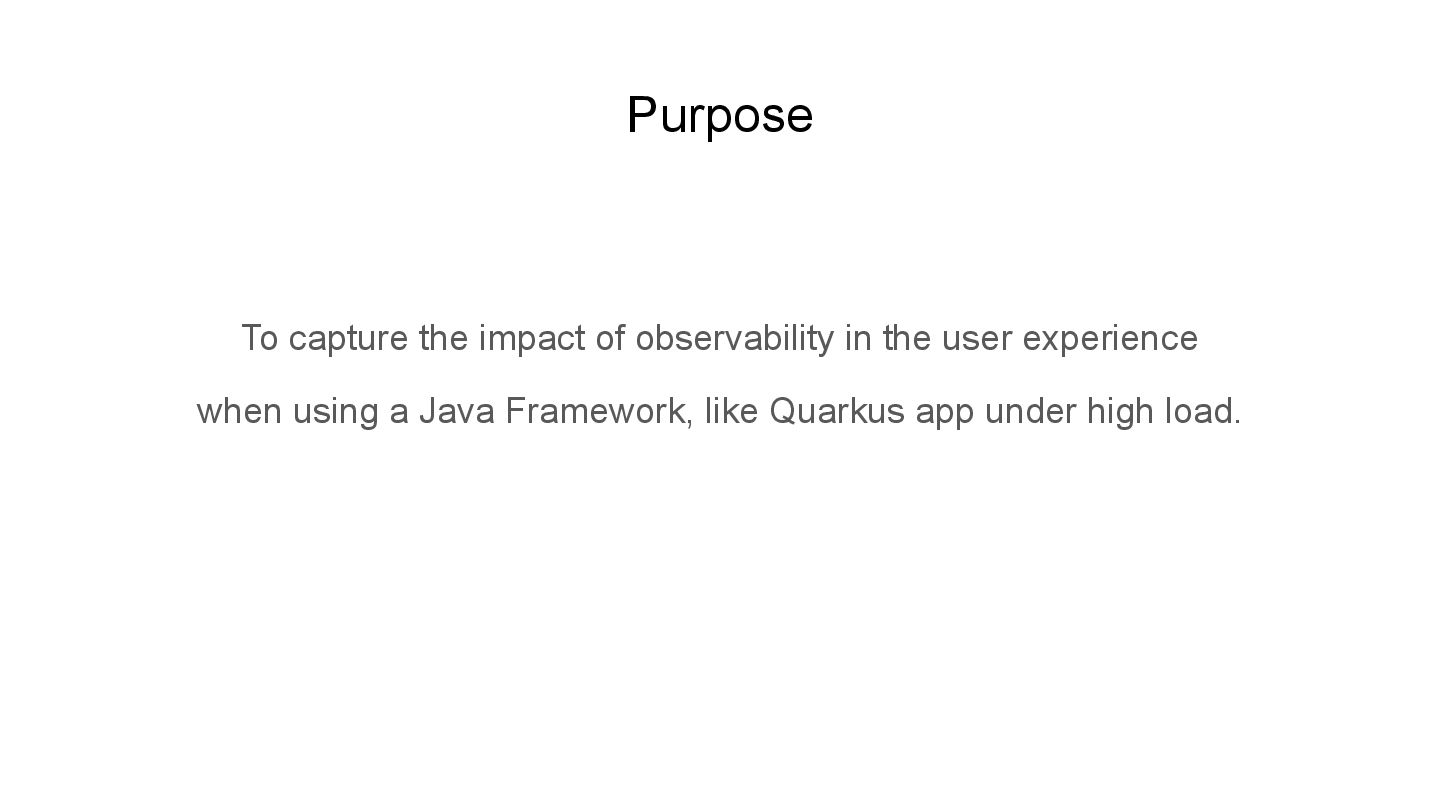
  2. Purpose To capture the impact of observability in the user

    experience when using a Java Framework, like Quarkus app under high load.
  3. Quarkus is a cloud-native Java framework designed to create fast

    startup, low memory usage application while spreading developer joy. https://quarkus.io
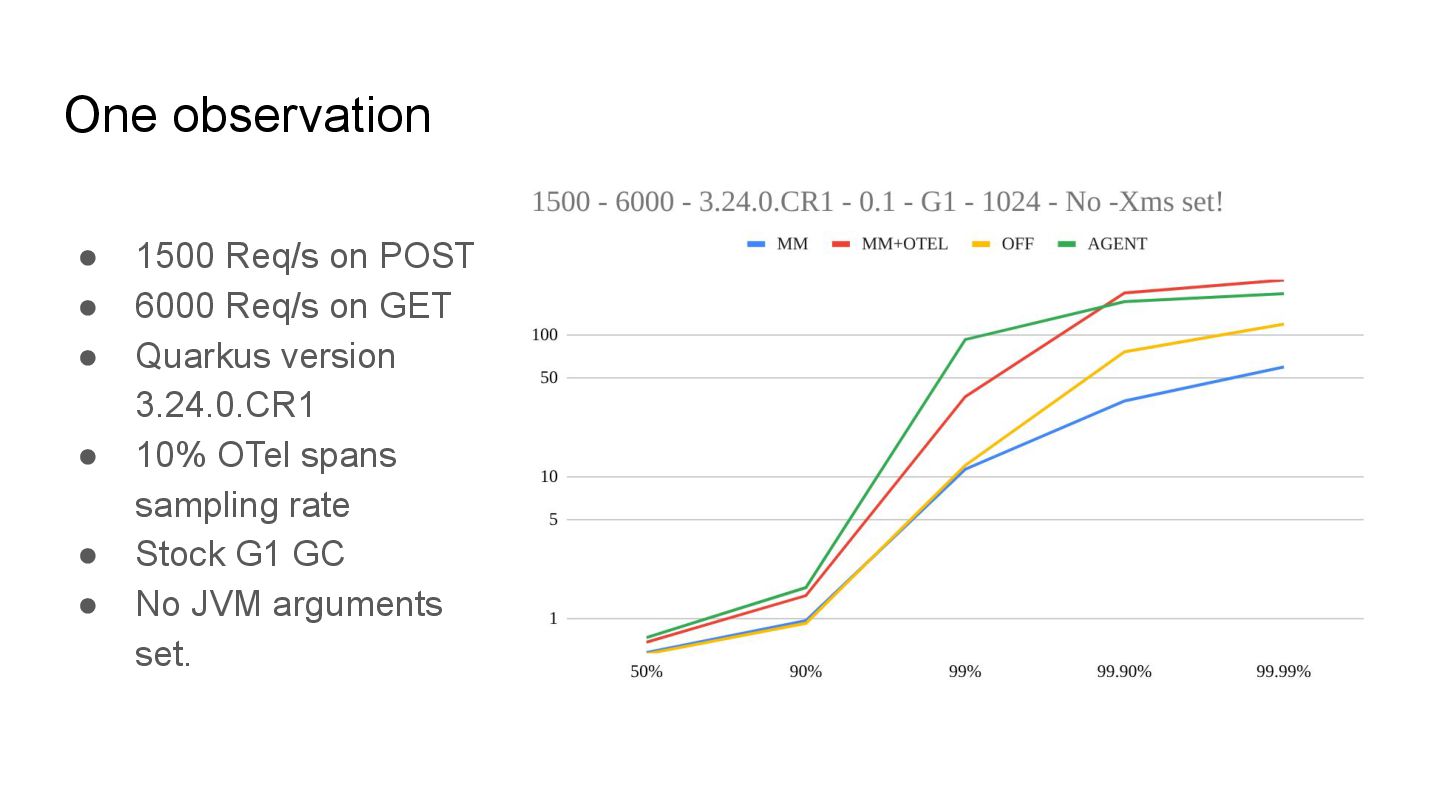
  4. One observation Request Count Mean (ms) 50% 90% 99% 99.90%
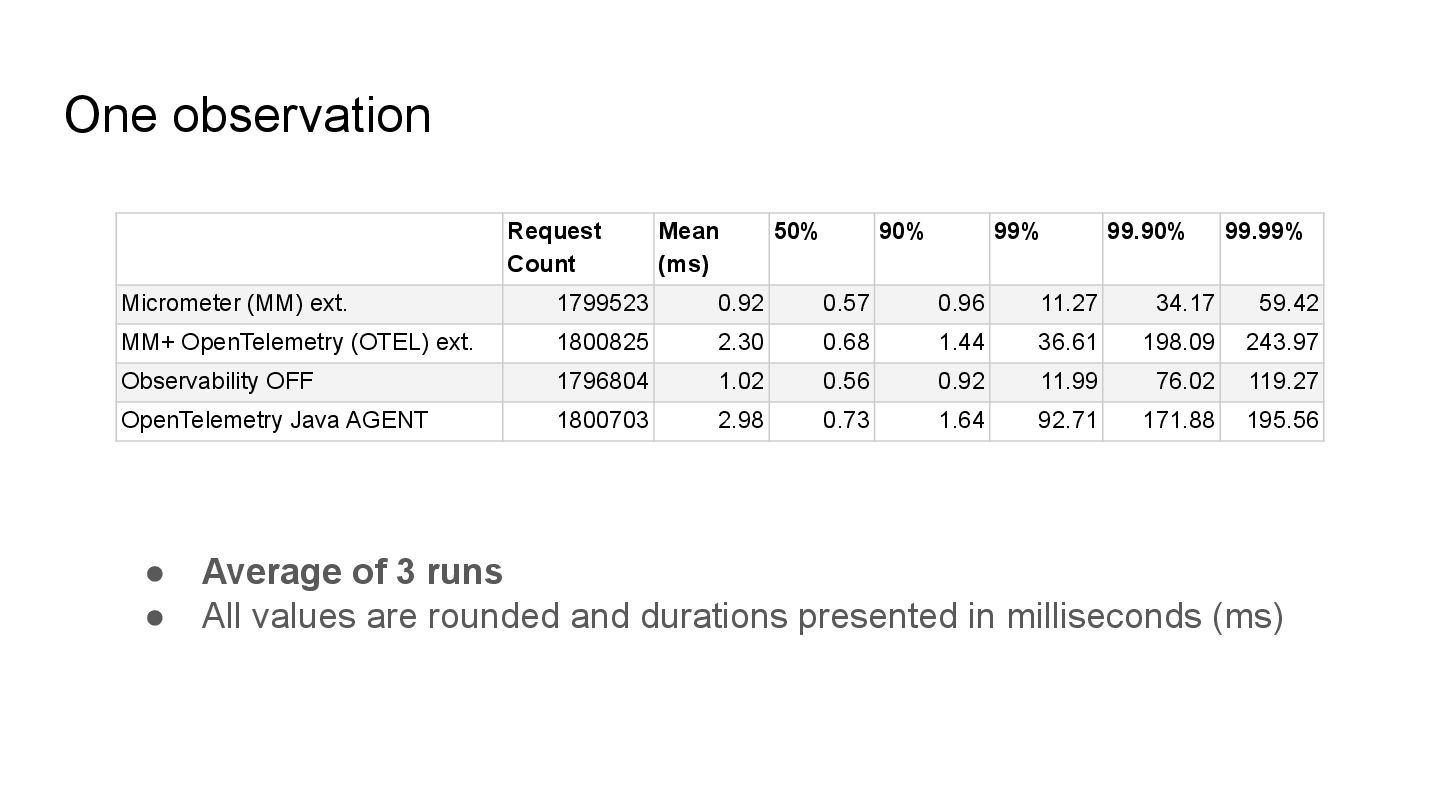
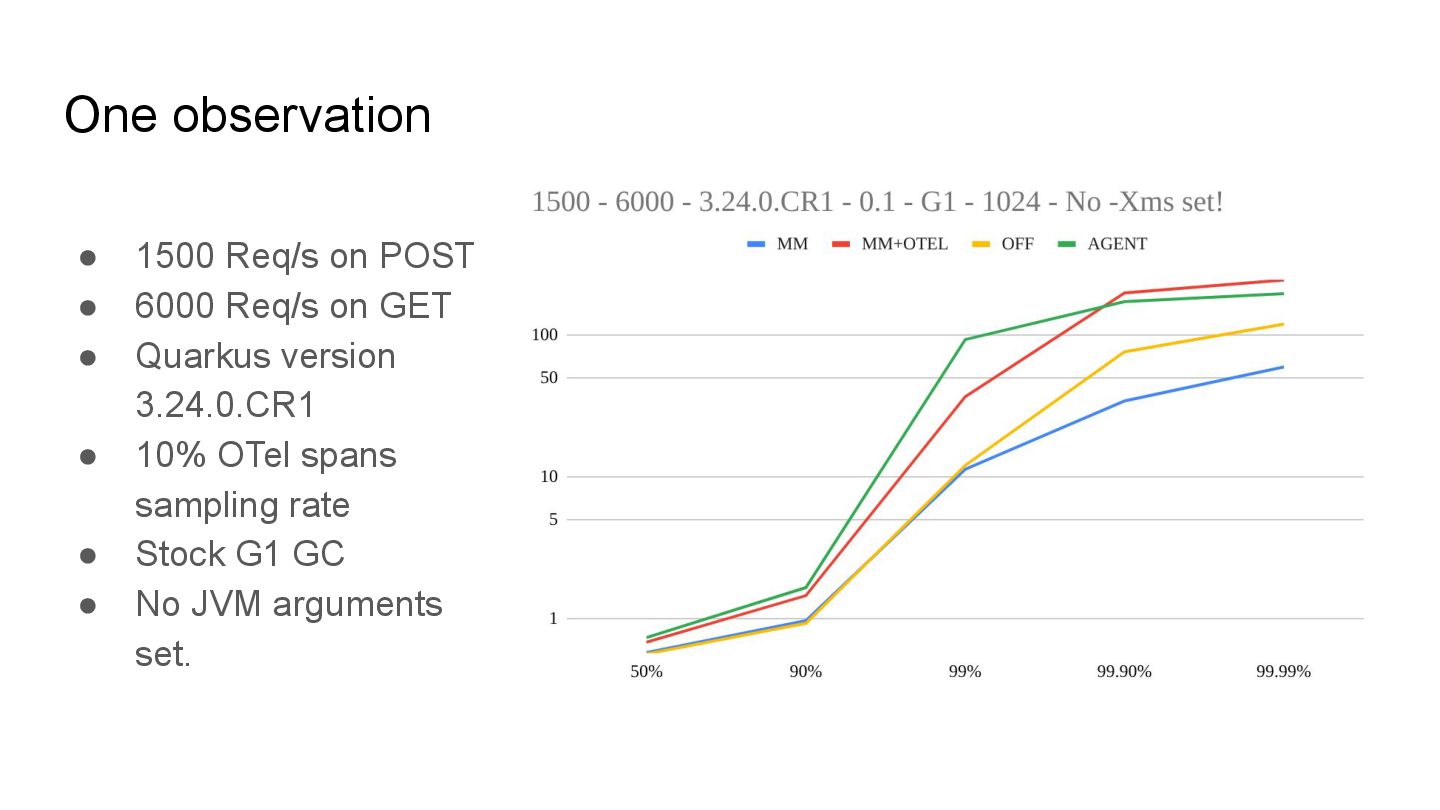
    99.99% Micrometer (MM) ext. 1799523 0.92 0.57 0.96 11.27 34.17 59.42 MM+ OpenTelemetry (OTEL) ext. 1800825 2.30 0.68 1.44 36.61 198.09 243.97 Observability OFF 1796804 1.02 0.56 0.92 11.99 76.02 119.27 OpenTelemetry Java AGENT 1800703 2.98 0.73 1.64 92.71 171.88 195.56 • Average of 3 runs • All values are rounded and durations presented in milliseconds (ms)
  5. One observation Request Count Mean (ms) 50% 90% 99% 99.90%

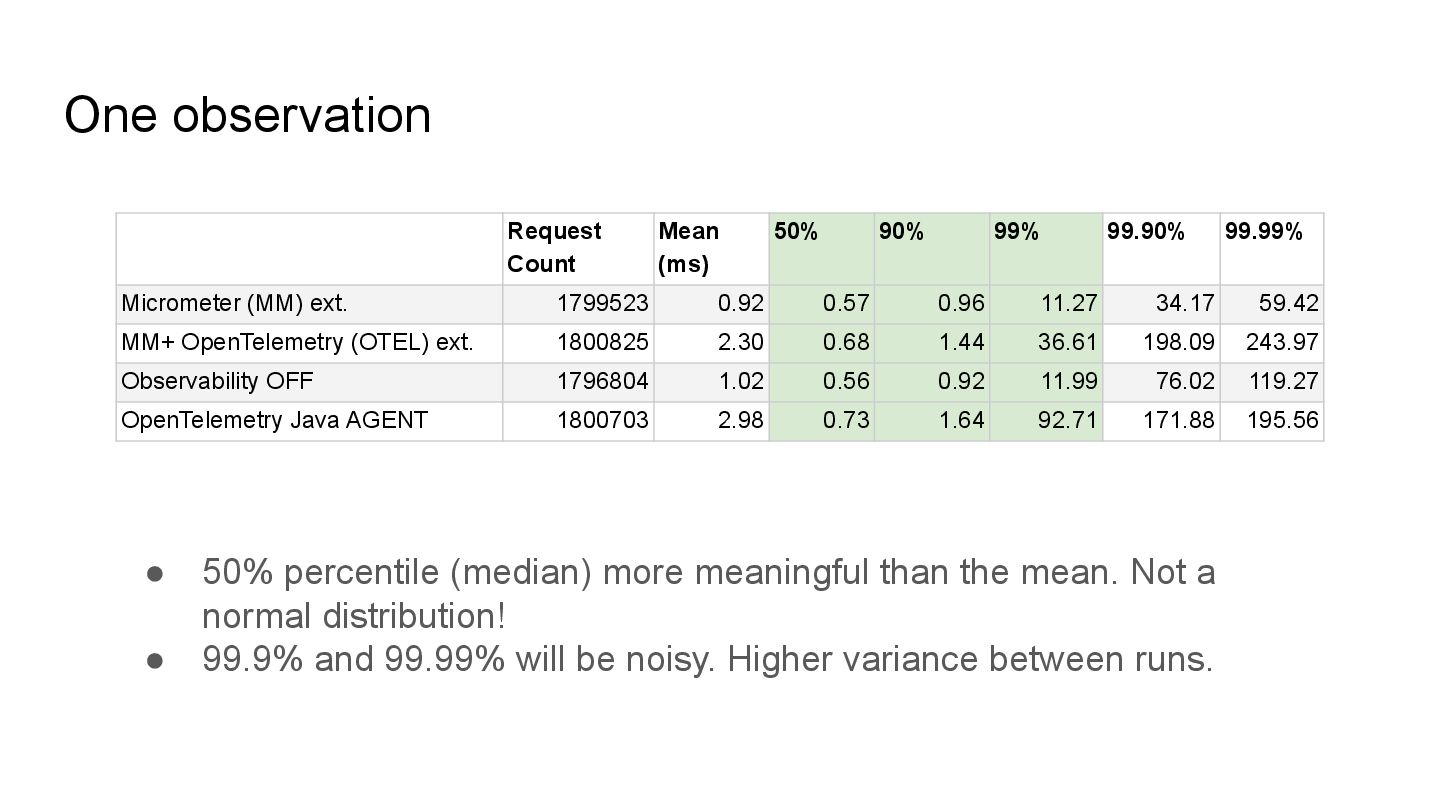
    99.99% Micrometer (MM) ext. 1799523 0.92 0.57 0.96 11.27 34.17 59.42 MM+ OpenTelemetry (OTEL) ext. 1800825 2.30 0.68 1.44 36.61 198.09 243.97 Observability OFF 1796804 1.02 0.56 0.92 11.99 76.02 119.27 OpenTelemetry Java AGENT 1800703 2.98 0.73 1.64 92.71 171.88 195.56 • 50% percentile (median) more meaningful than the mean. Not a normal distribution! • 99.9% and 99.99% will be noisy. Higher variance between runs.
  6. One observation • 1500 Req/s on POST • 6000 Req/s

    on GET • Quarkus version 3.24.0.CR1 • 10% OTel spans sampling rate • Stock G1 GC • No JVM arguments set.
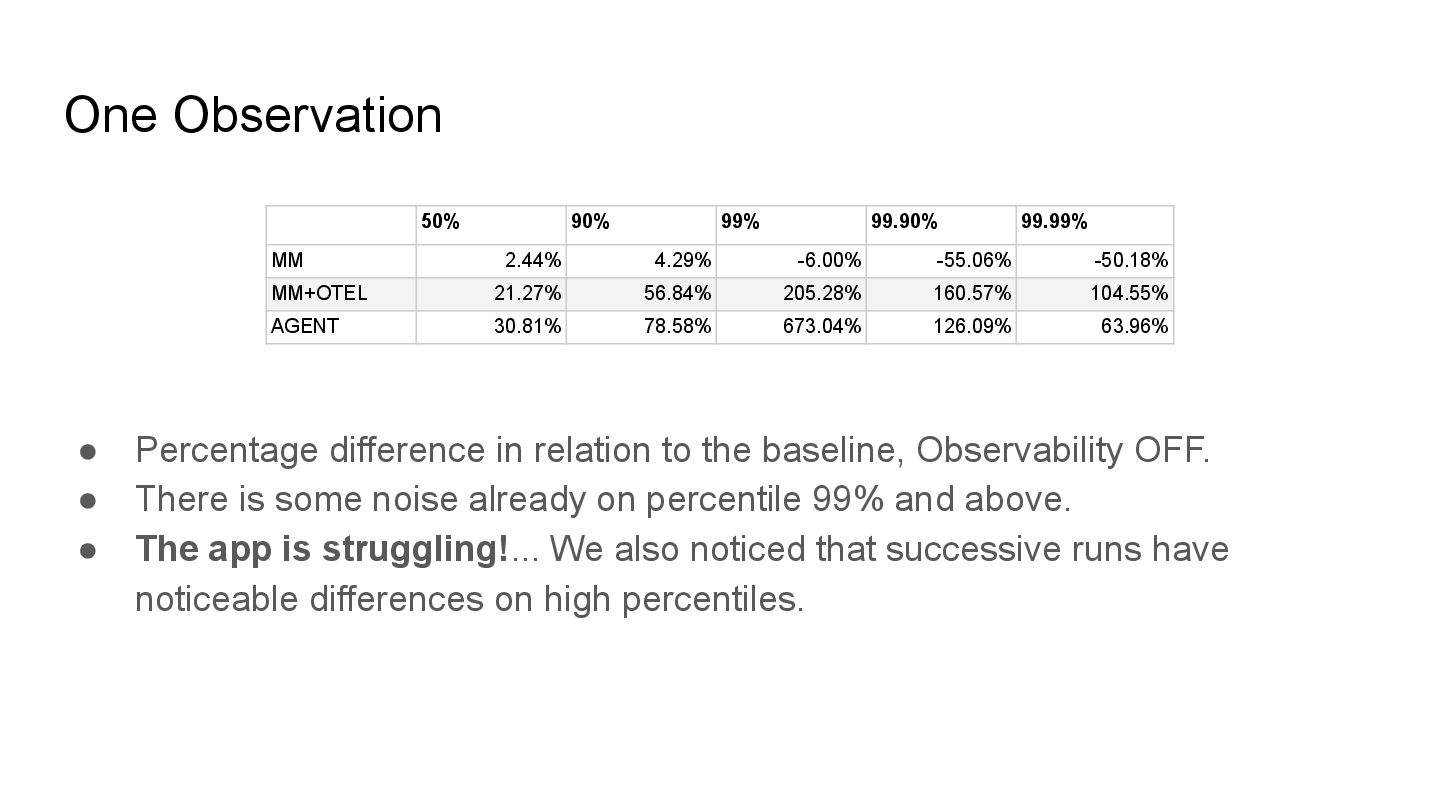
  7. One Observation • Percentage difference in relation to the baseline,

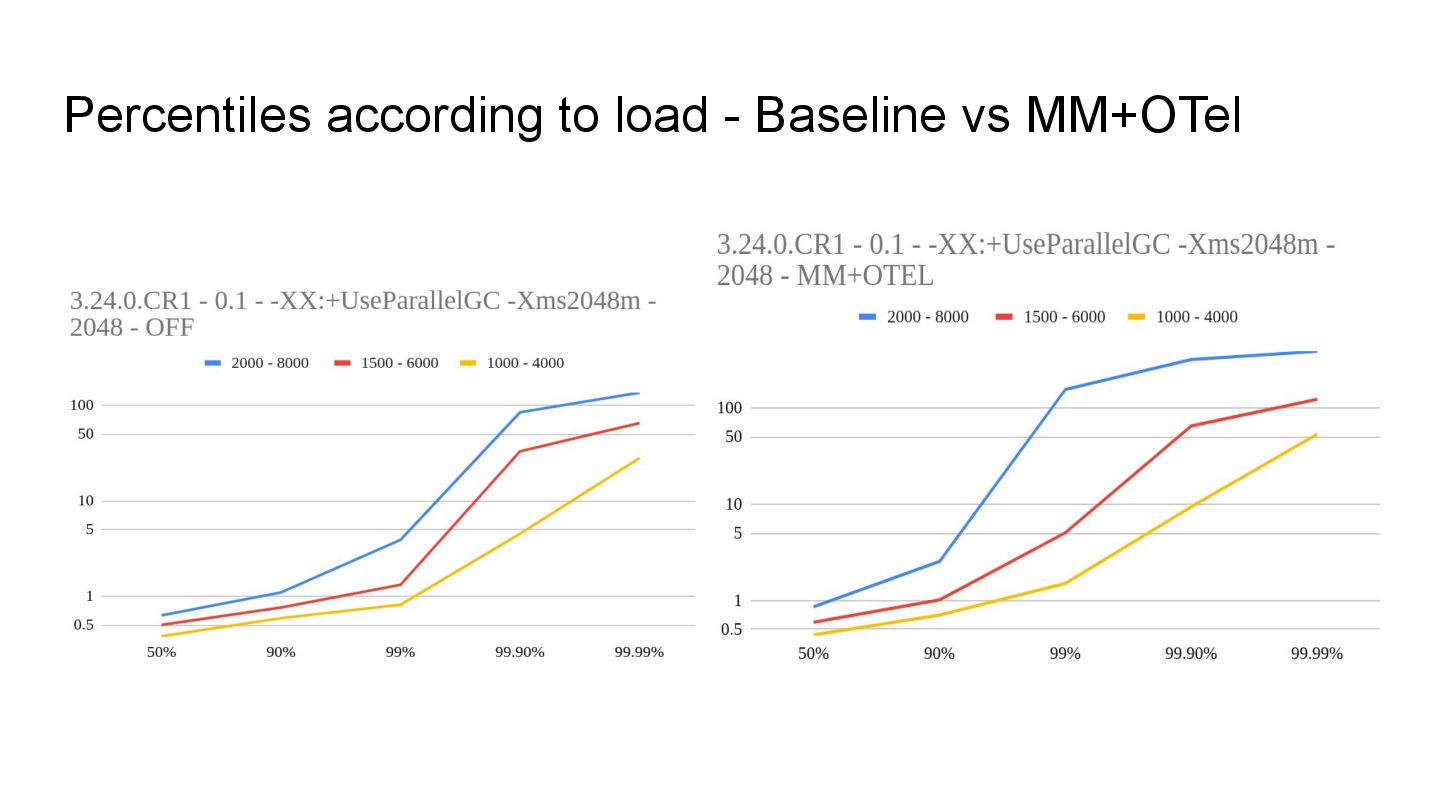
    Observability OFF. • There is some noise already on percentile 99% and above. • The app is struggling!... We also noticed that successive runs have noticeable differences on high percentiles. 50% 90% 99% 99.90% 99.99% MM 2.44% 4.29% -6.00% -55.06% -50.18% MM+OTEL 21.27% 56.84% 205.28% 160.57% 104.55% AGENT 30.81% 78.58% 673.04% 126.09% 63.96%
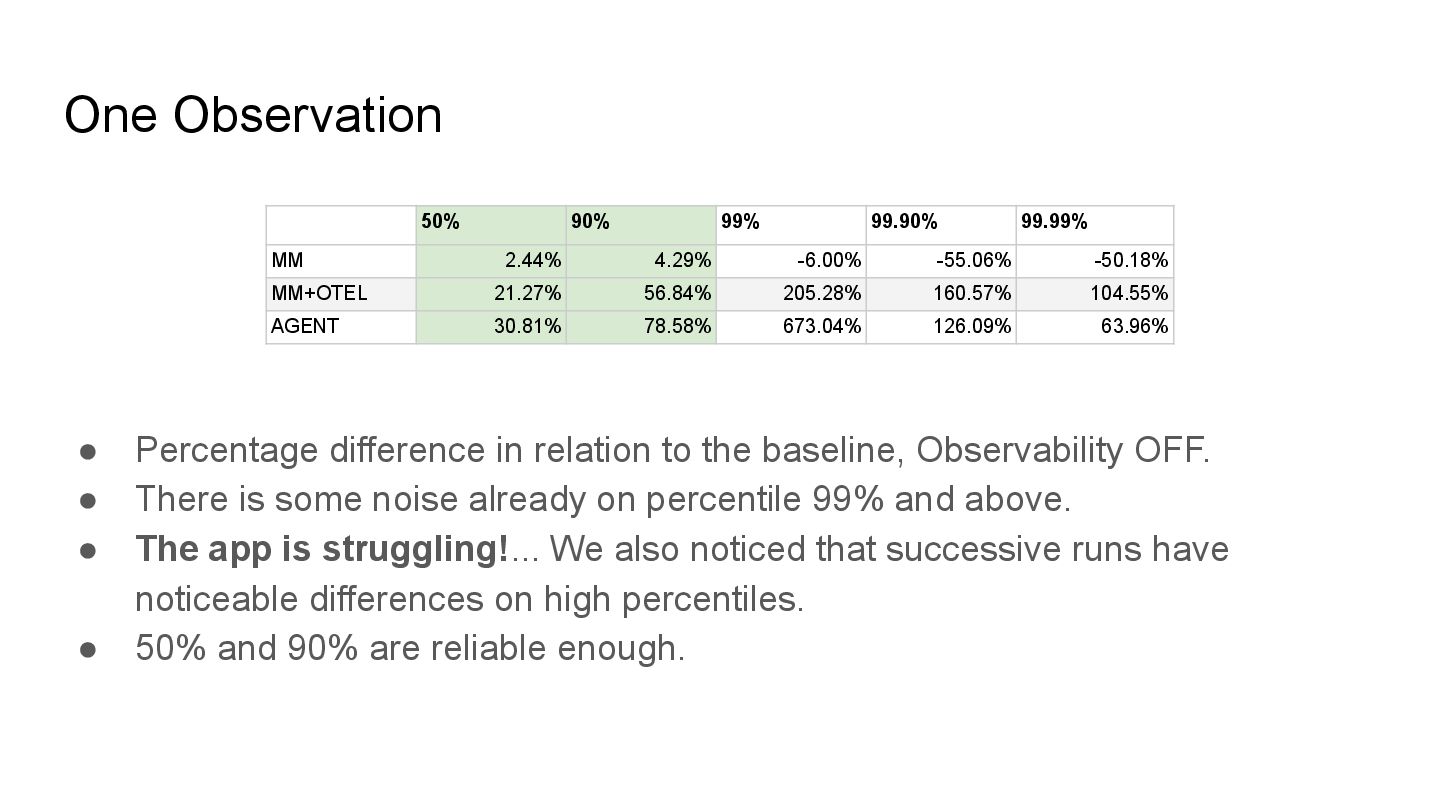
  8. One Observation • Percentage difference in relation to the baseline,

    Observability OFF. • There is some noise already on percentile 99% and above. • The app is struggling!... We also noticed that successive runs have noticeable differences on high percentiles. • 50% and 90% are reliable enough. 50% 90% 99% 99.90% 99.99% MM 2.44% 4.29% -6.00% -55.06% -50.18% MM+OTEL 21.27% 56.84% 205.28% 160.57% 104.55% AGENT 30.81% 78.58% 673.04% 126.09% 63.96%
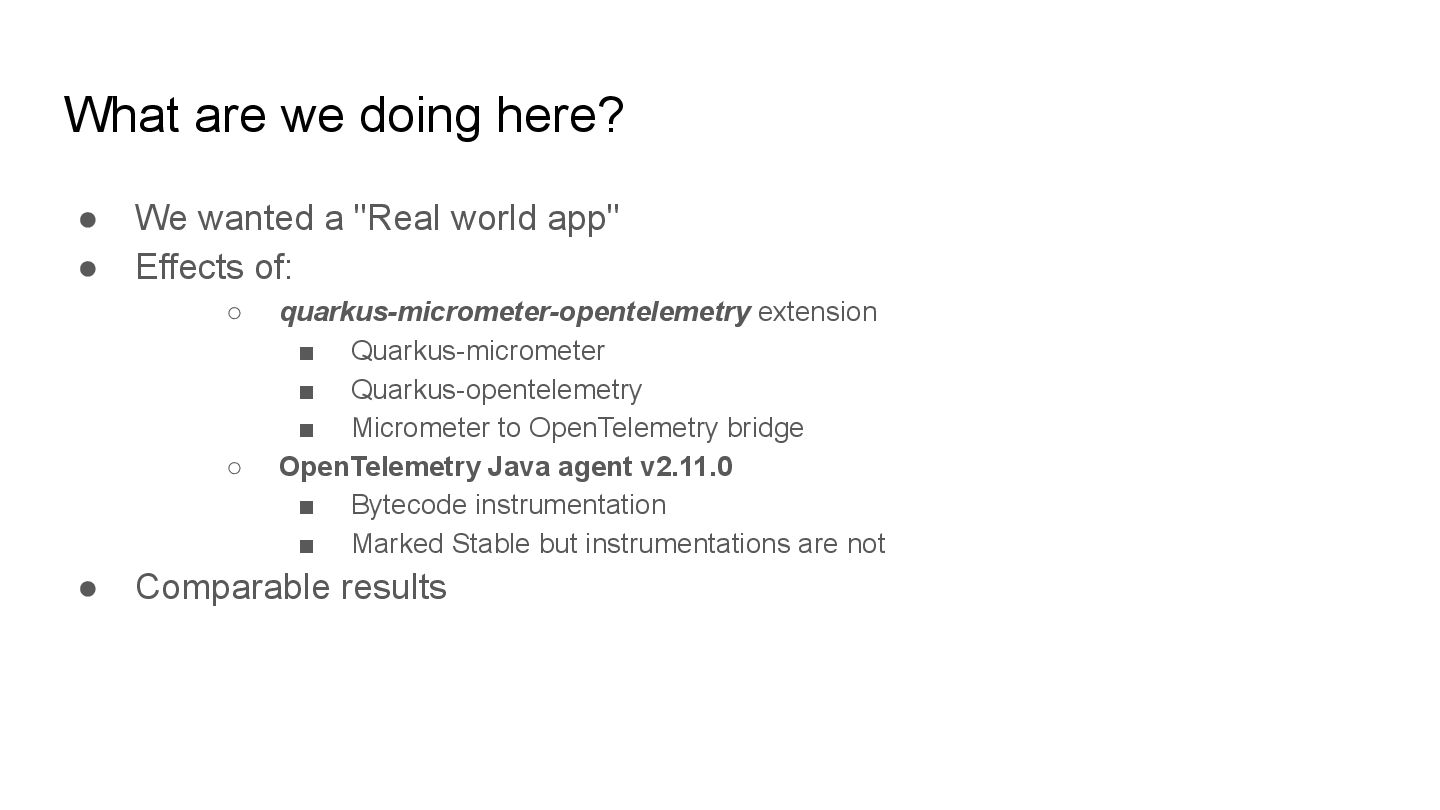
  9. What are we doing here? • We wanted a "Real

    world app" • Effects of: ◦ quarkus-micrometer-opentelemetry extension ▪ Quarkus-micrometer ▪ Quarkus-opentelemetry ▪ Micrometer to OpenTelemetry bridge ◦ OpenTelemetry Java agent v2.11.0 ▪ Bytecode instrumentation ▪ Marked Stable but instrumentations are not • Comparable results
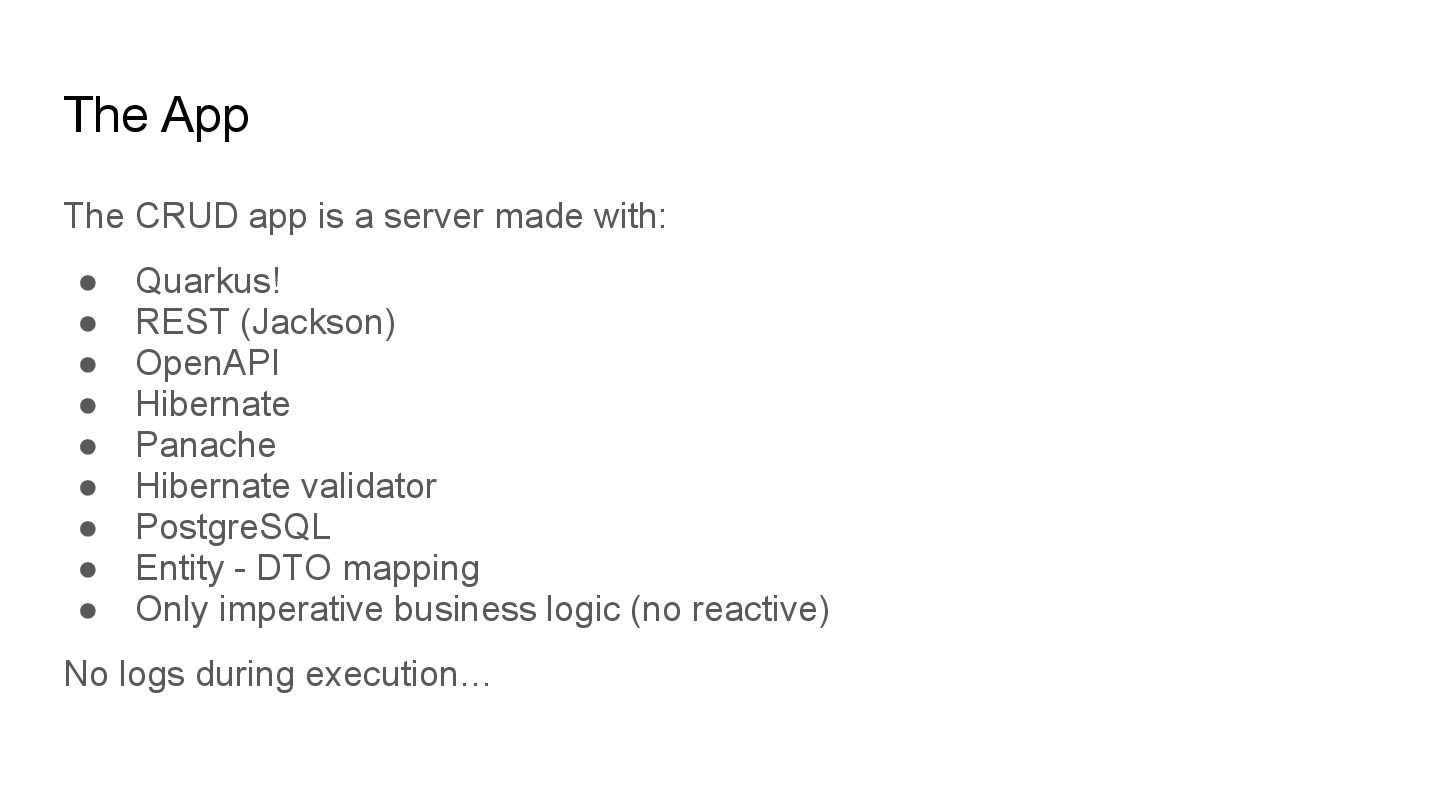
  10. The App The CRUD app is a server made with:

    • Quarkus! • REST (Jackson) • OpenAPI • Hibernate • Panache • Hibernate validator • PostgreSQL • Entity - DTO mapping • Only imperative business logic (no reactive) No logs during execution…
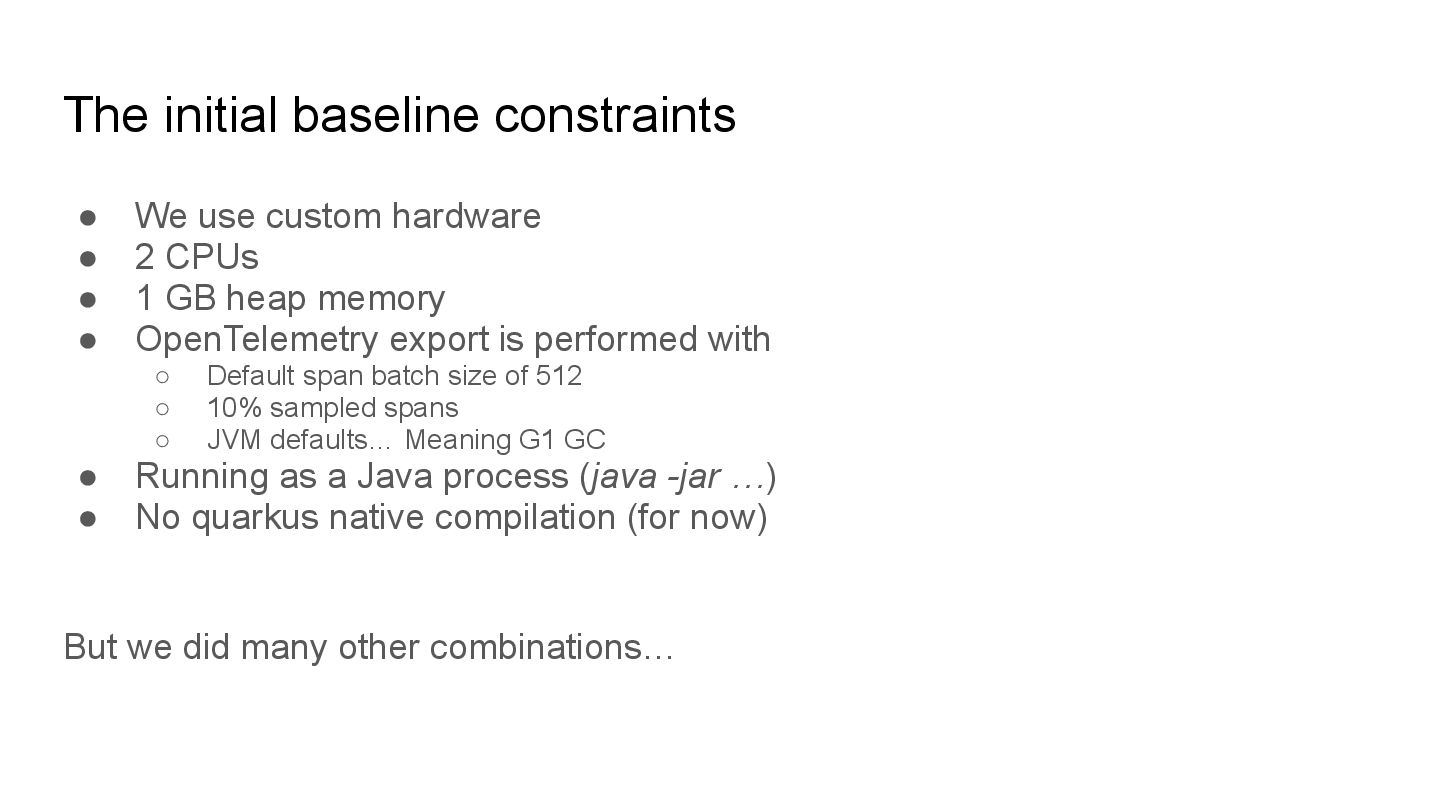
  11. The initial baseline constraints • We use custom hardware •

    2 CPUs • 1 GB heap memory • OpenTelemetry export is performed with ◦ Default span batch size of 512 ◦ 10% sampled spans ◦ JVM defaults… Meaning G1 GC • Running as a Java process (java -jar …) • No quarkus native compilation (for now) But we did many other combinations…
  12. One observation • 1500 Req/s on POST • 6000 Req/s

    on GET • Quarkus version 3.24.0.CR1 • 10% OTel spans sampling rate • Stock G1 GC • No JVM arguments set.
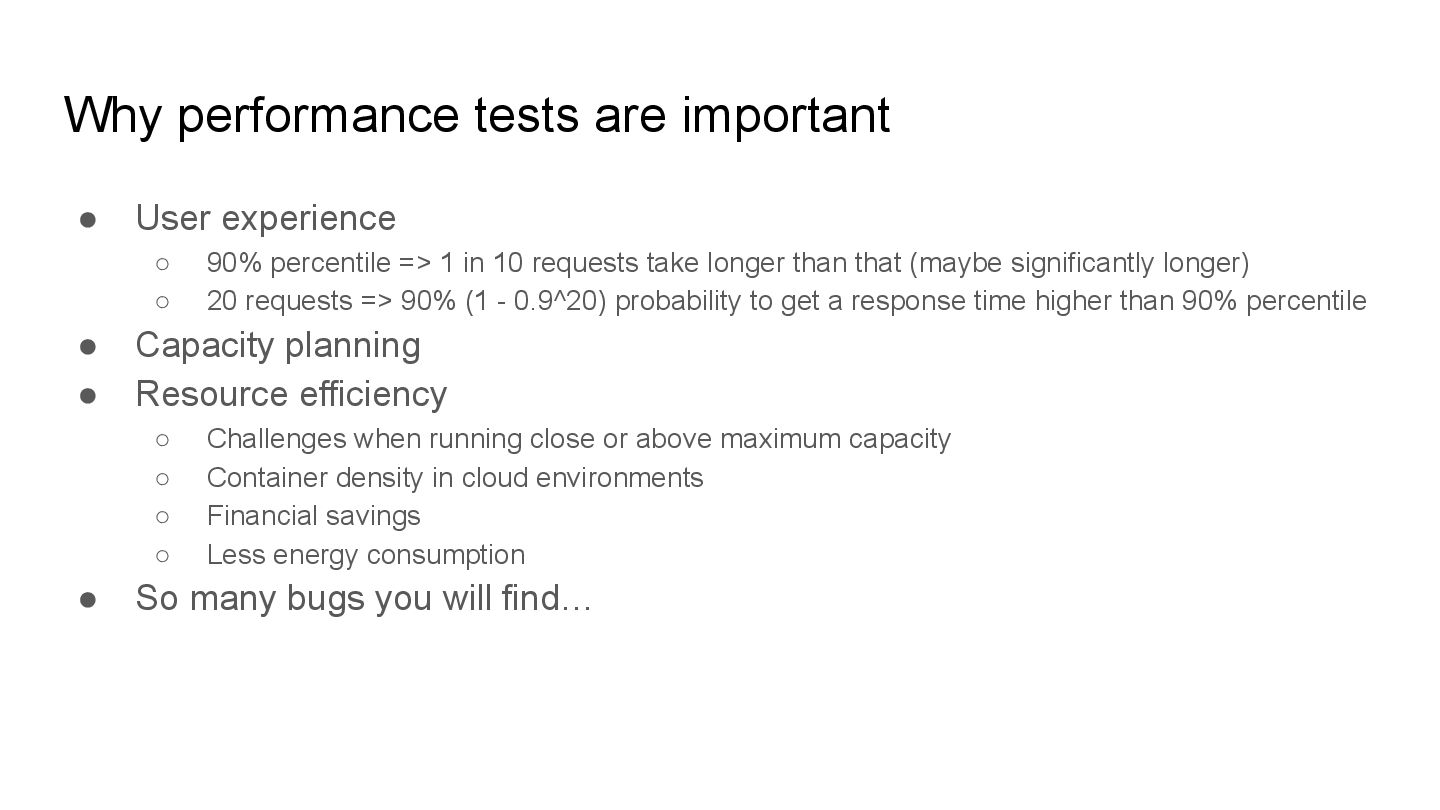
  13. Why performance tests are important • User experience ◦ 90%

    percentile => 1 in 10 requests take longer than that (maybe significantly longer) ◦ 20 requests => 90% (1 - 0.9^20) probability to get a response time higher than 90% percentile • Capacity planning • Resource efficiency ◦ Challenges when running close or above maximum capacity ◦ Container density in cloud environments ◦ Financial savings ◦ Less energy consumption • So many bugs you will find…
  14. Validity of performance tests • Specificity ◦ Identifying bottlenecks ▪

    DISCLAIMER: These results are for our particular use case and setup ▪ Profiling (perf, async-profiler, Java Flight Record JFR) • Sensitivity ◦ Incremental changes
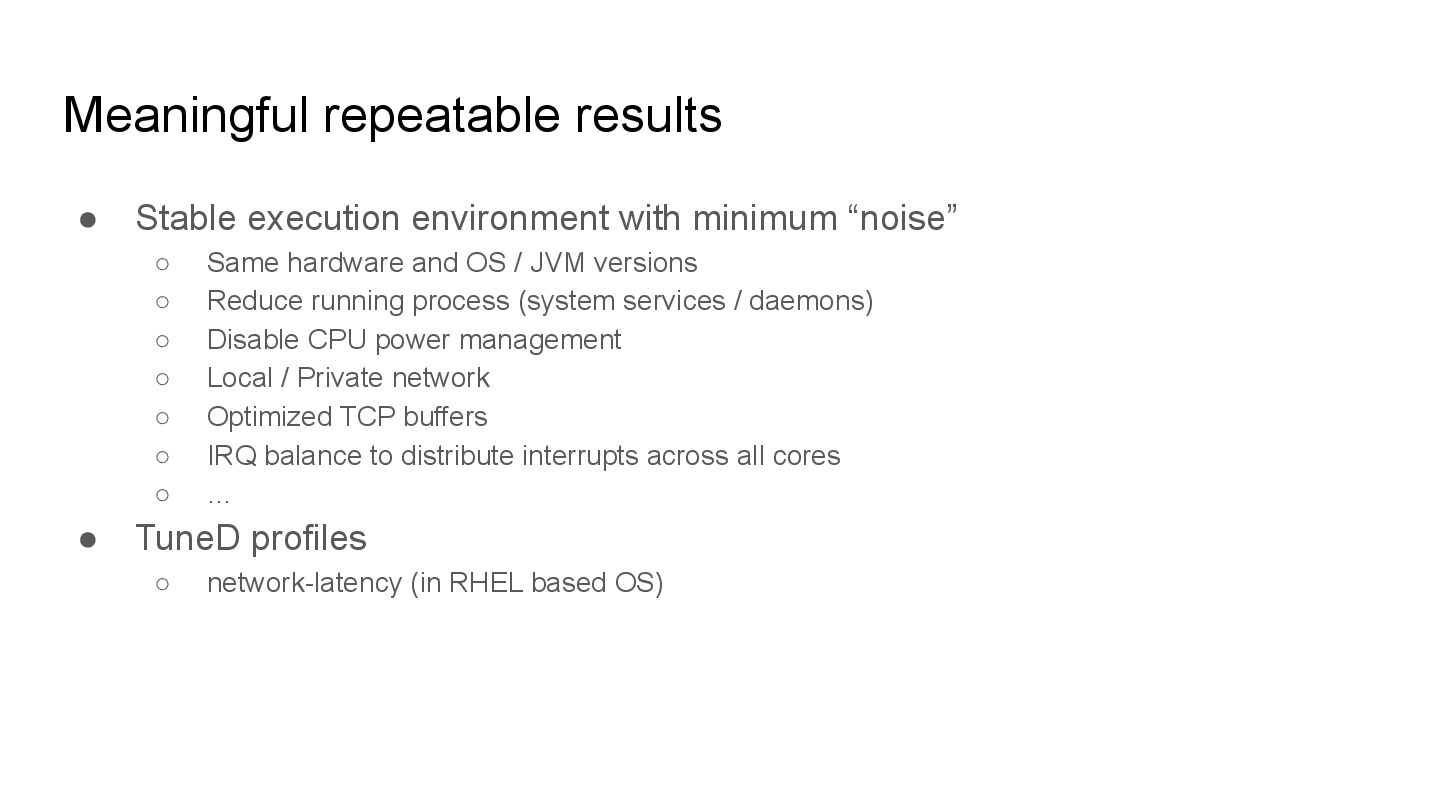
  15. Meaningful repeatable results • Stable execution environment with minimum “noise”

    ◦ Same hardware and OS / JVM versions ◦ Reduce running process (system services / daemons) ◦ Disable CPU power management ◦ Local / Private network ◦ Optimized TCP buffers ◦ IRQ balance to distribute interrupts across all cores ◦ … • TuneD profiles ◦ network-latency (in RHEL based OS)
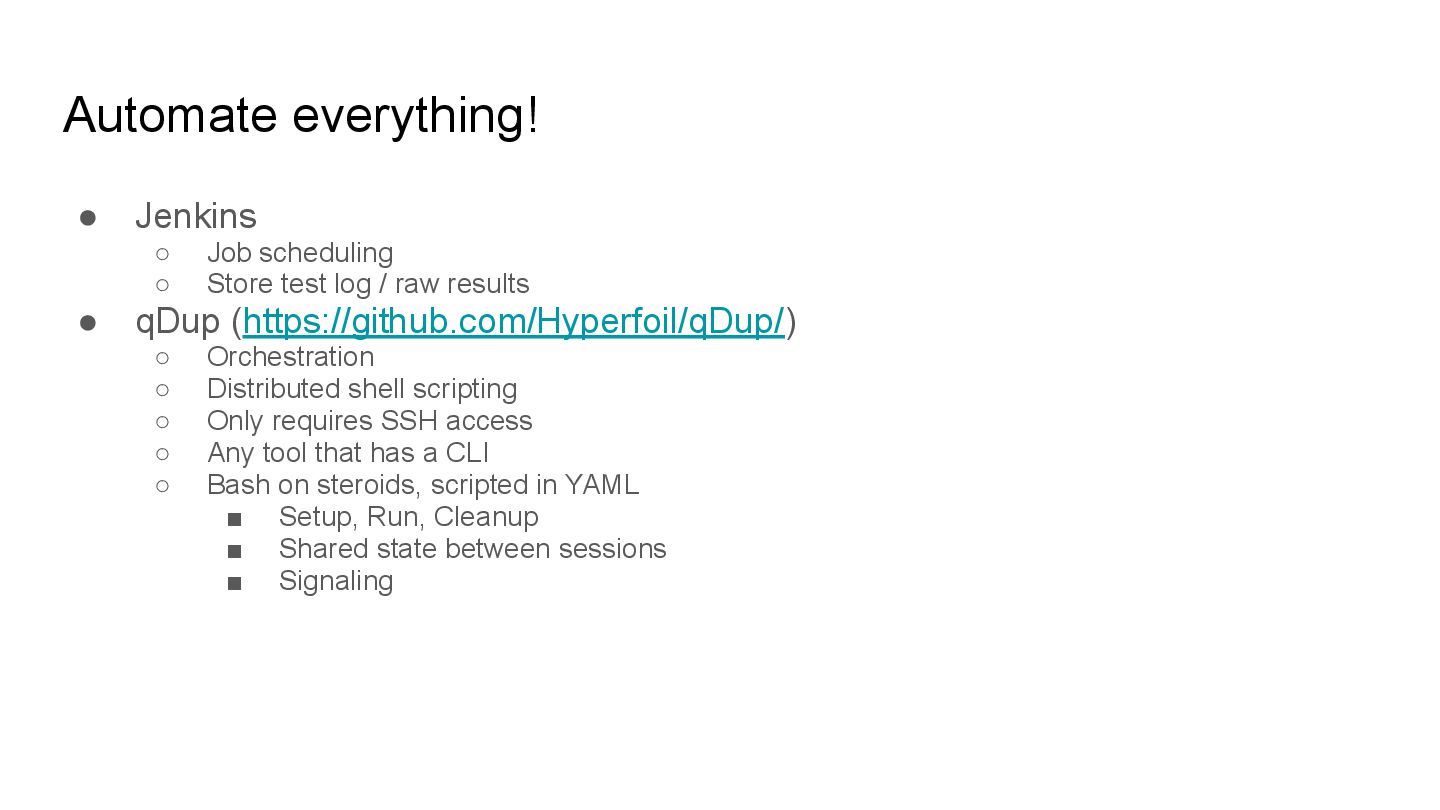
  16. Automate everything! • Jenkins ◦ Job scheduling ◦ Store test

    log / raw results • qDup (https://github.com/Hyperfoil/qDup/) ◦ Orchestration ◦ Distributed shell scripting ◦ Only requires SSH access ◦ Any tool that has a CLI ◦ Bash on steroids, scripted in YAML ▪ Setup, Run, Cleanup ▪ Shared state between sessions ▪ Signaling
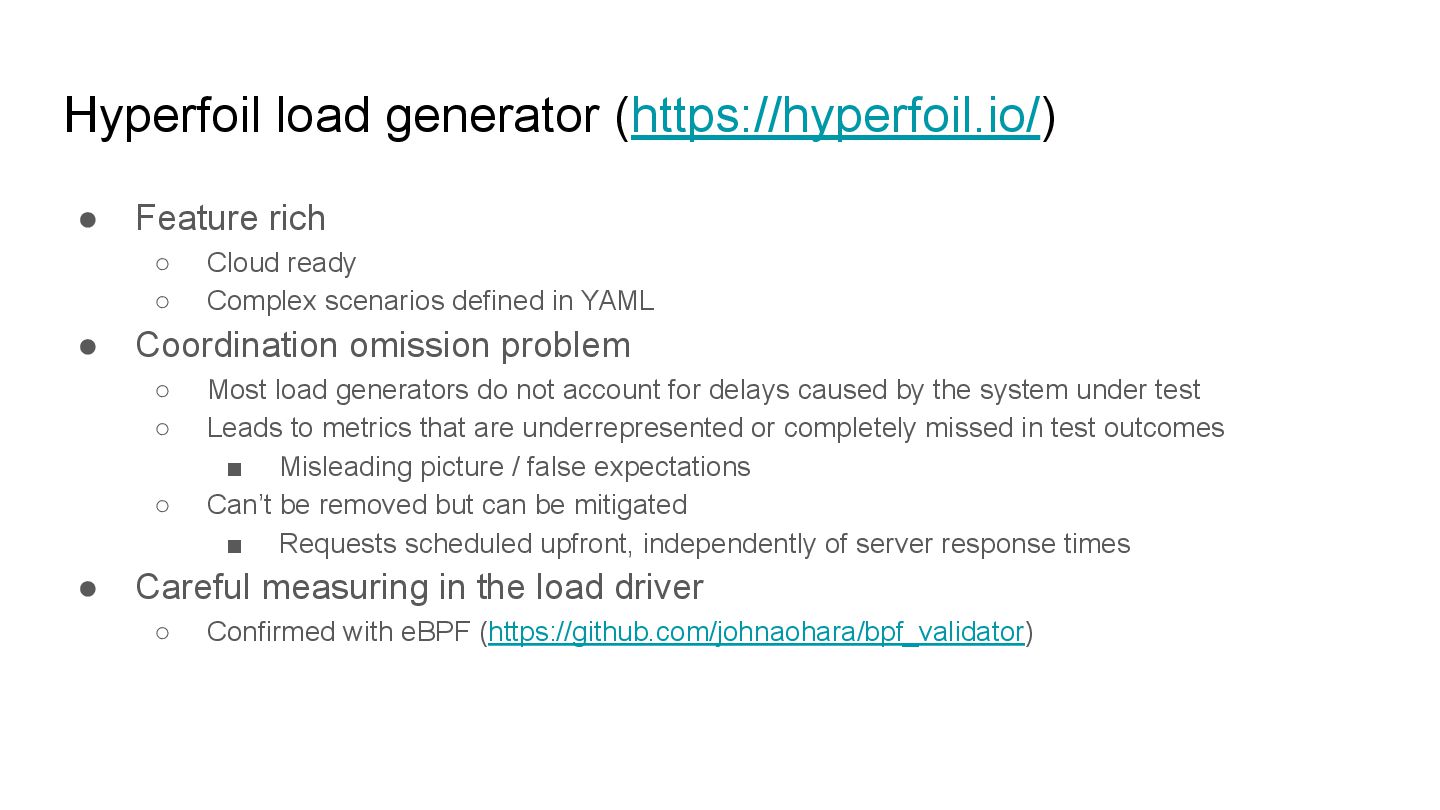
  17. Hyperfoil load generator (https://hyperfoil.io/) • Feature rich ◦ Cloud ready

    ◦ Complex scenarios defined in YAML • Coordination omission problem ◦ Most load generators do not account for delays caused by the system under test ◦ Leads to metrics that are underrepresented or completely missed in test outcomes ▪ Misleading picture / false expectations ◦ Can’t be removed but can be mitigated ▪ Requests scheduled upfront, independently of server response times • Careful measuring in the load driver ◦ Confirmed with eBPF (https://github.com/johnaohara/bpf_validator)
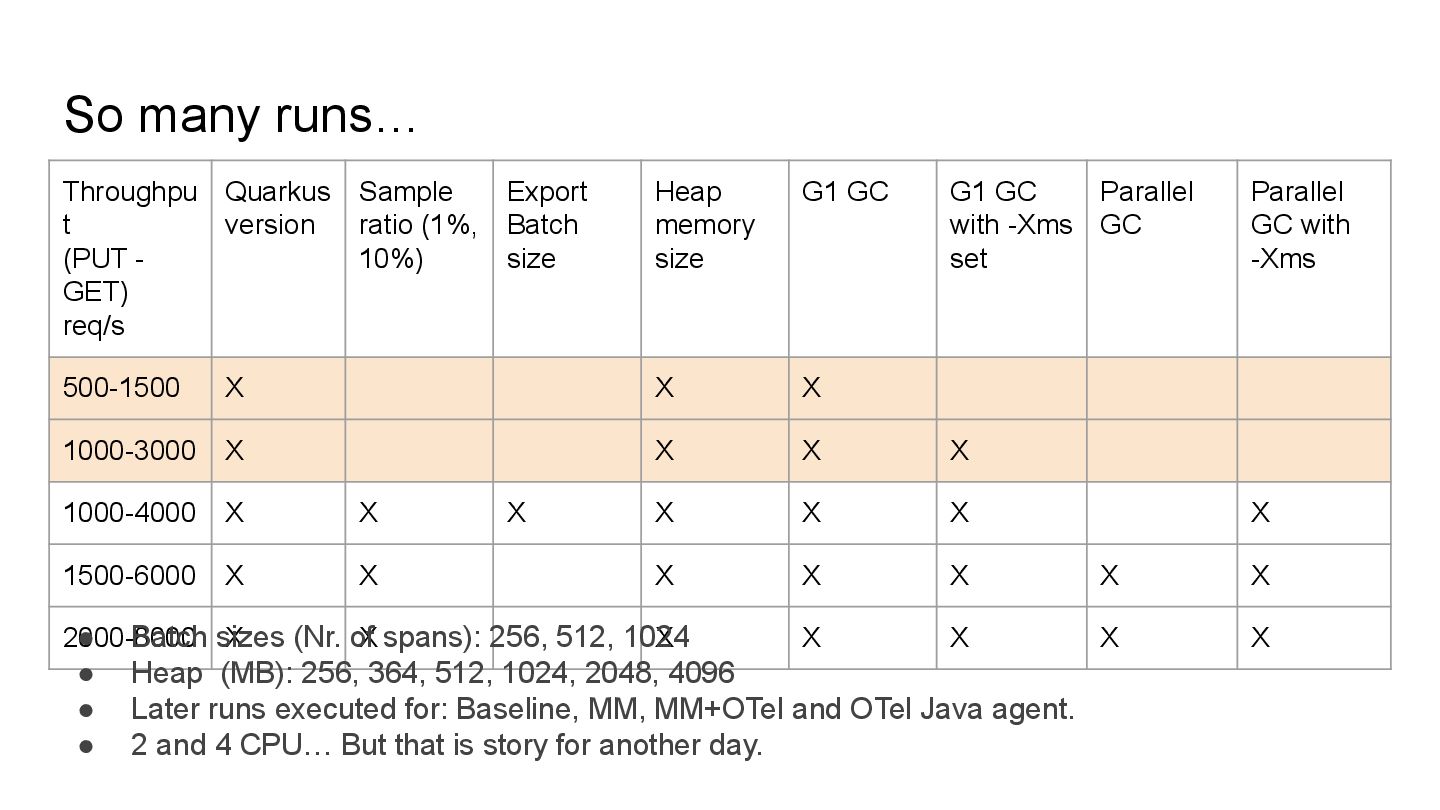
  18. So many runs… Throughpu t (PUT - GET) req/s Quarkus

    version Sample ratio (1%, 10%) Export Batch size Heap memory size G1 GC G1 GC with -Xms set Parallel GC Parallel GC with -Xms 500-1500 X X X 1000-3000 X X X X 1000-4000 X X X X X X X 1500-6000 X X X X X X X 2000-8000 X X X X X X X • Batch sizes (Nr. of spans): 256, 512, 1024 • Heap (MB): 256, 364, 512, 1024, 2048, 4096 • Later runs executed for: Baseline, MM, MM+OTel and OTel Java agent. • 2 and 4 CPU… But that is story for another day.
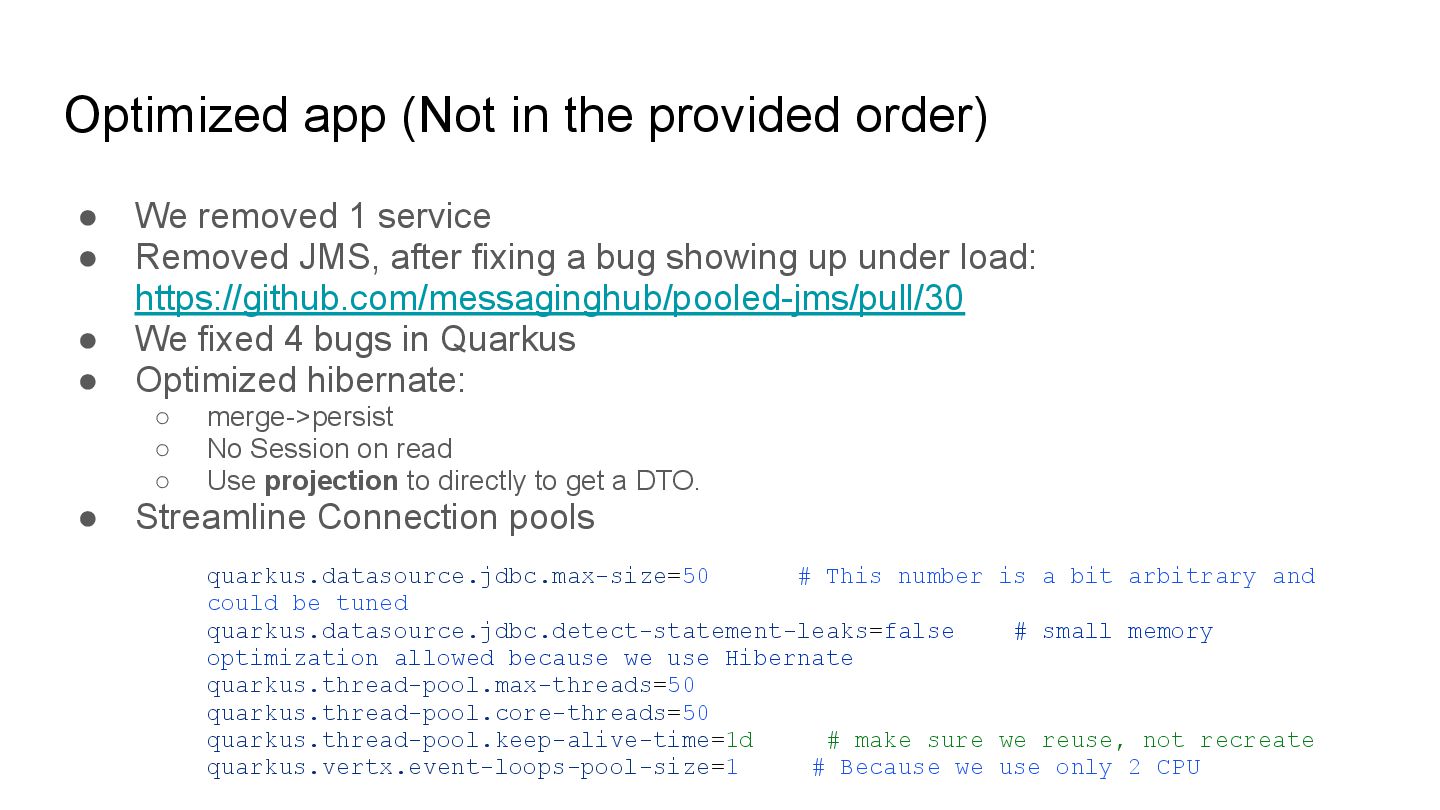
  19. Optimized app (Not in the provided order) • We removed

    1 service • Removed JMS, after fixing a bug showing up under load: https://github.com/messaginghub/pooled-jms/pull/30 • We fixed 4 bugs in Quarkus • Optimized hibernate: ◦ merge->persist ◦ No Session on read ◦ Use projection to directly to get a DTO. • Streamline Connection pools quarkus.datasource.jdbc.max-size=50 # This number is a bit arbitrary and could be tuned quarkus.datasource.jdbc.detect-statement-leaks=false # small memory optimization allowed because we use Hibernate quarkus.thread-pool.max-threads=50 quarkus.thread-pool.core-threads=50 quarkus.thread-pool.keep-alive-time=1d # make sure we reuse, not recreate quarkus.vertx.event-loops-pool-size=1 # Because we use only 2 CPU
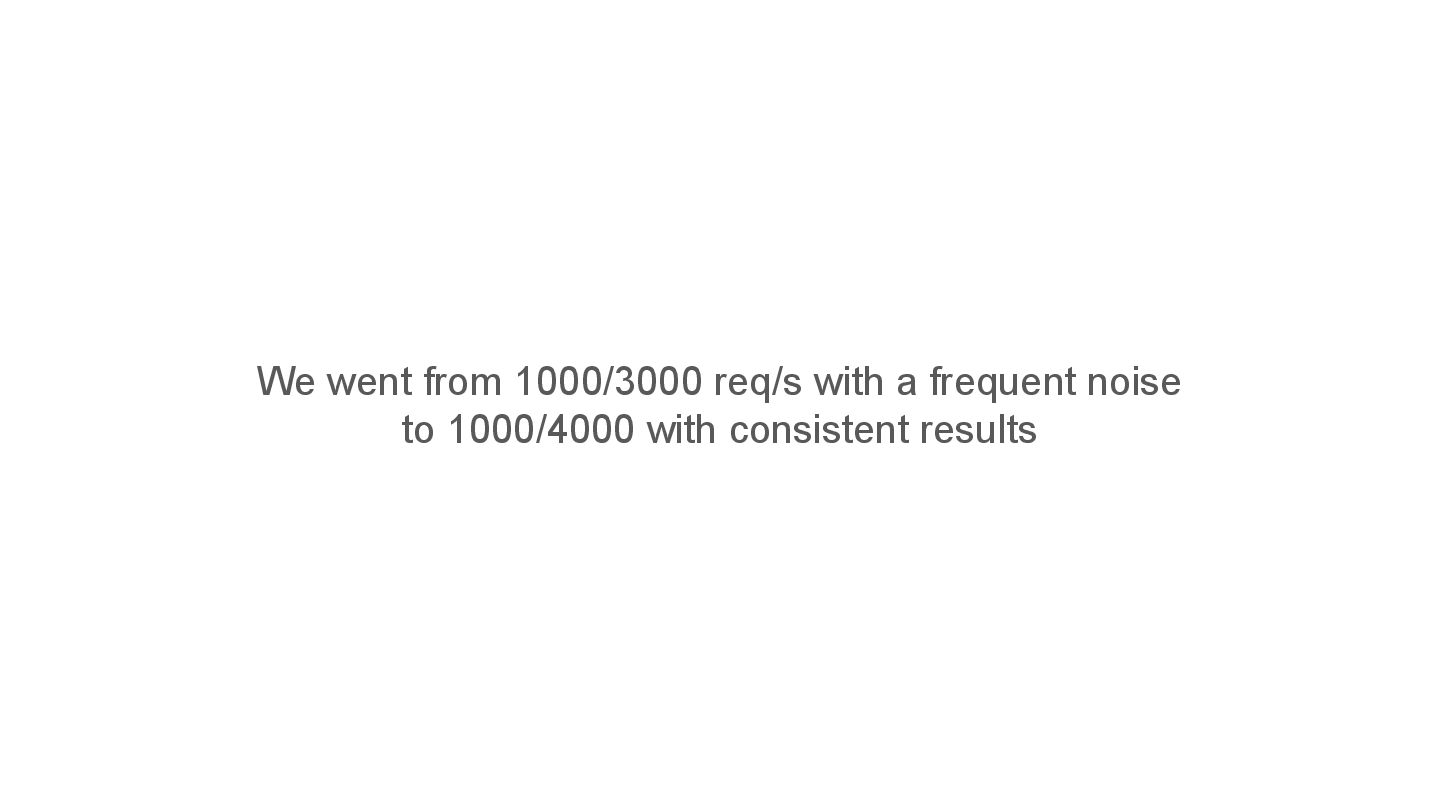
  20. We went from 1000/3000 req/s with a frequent noise to

    1000/4000 with consistent results
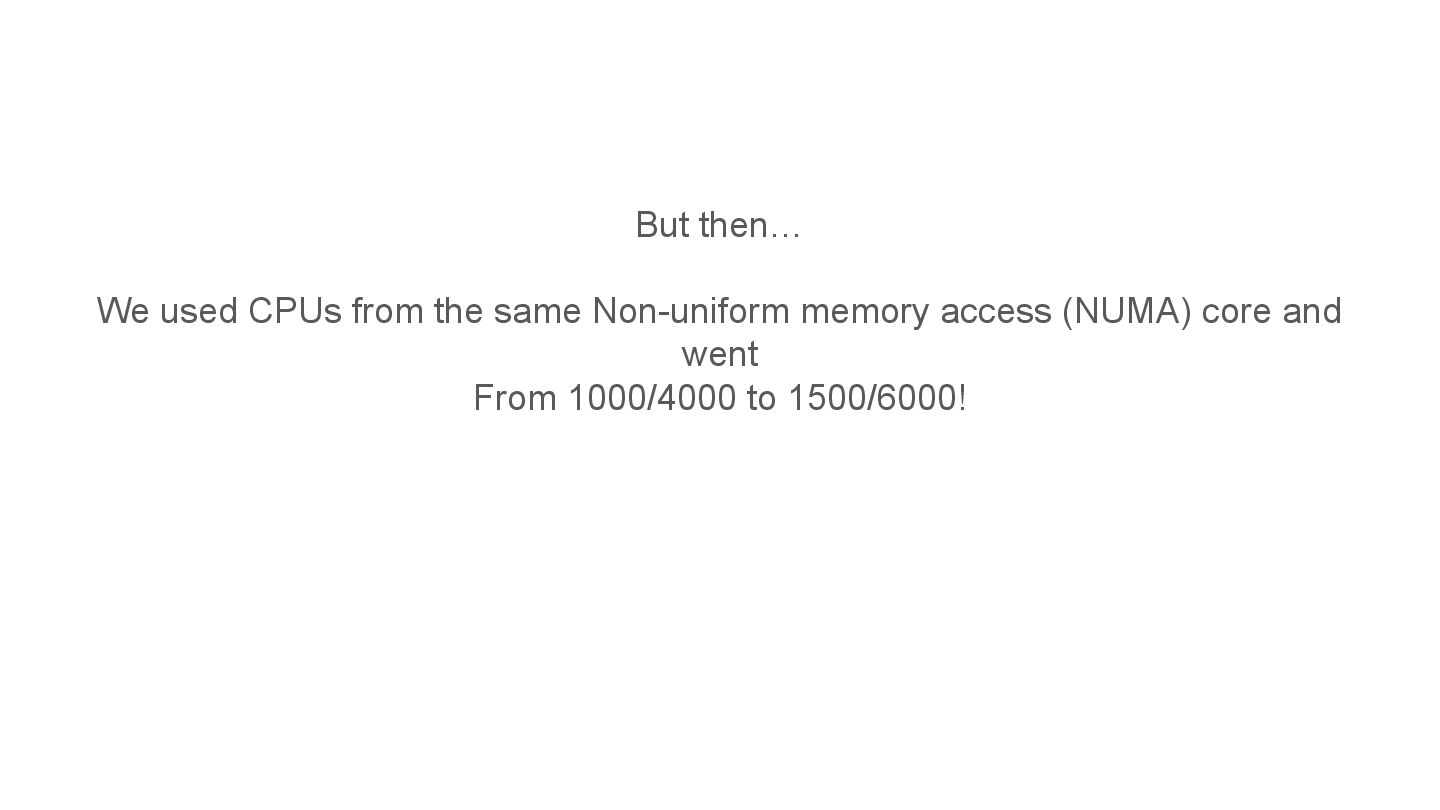
  21. But then… We used CPUs from the same Non-uniform memory

    access (NUMA) core and went From 1000/4000 to 1500/6000!
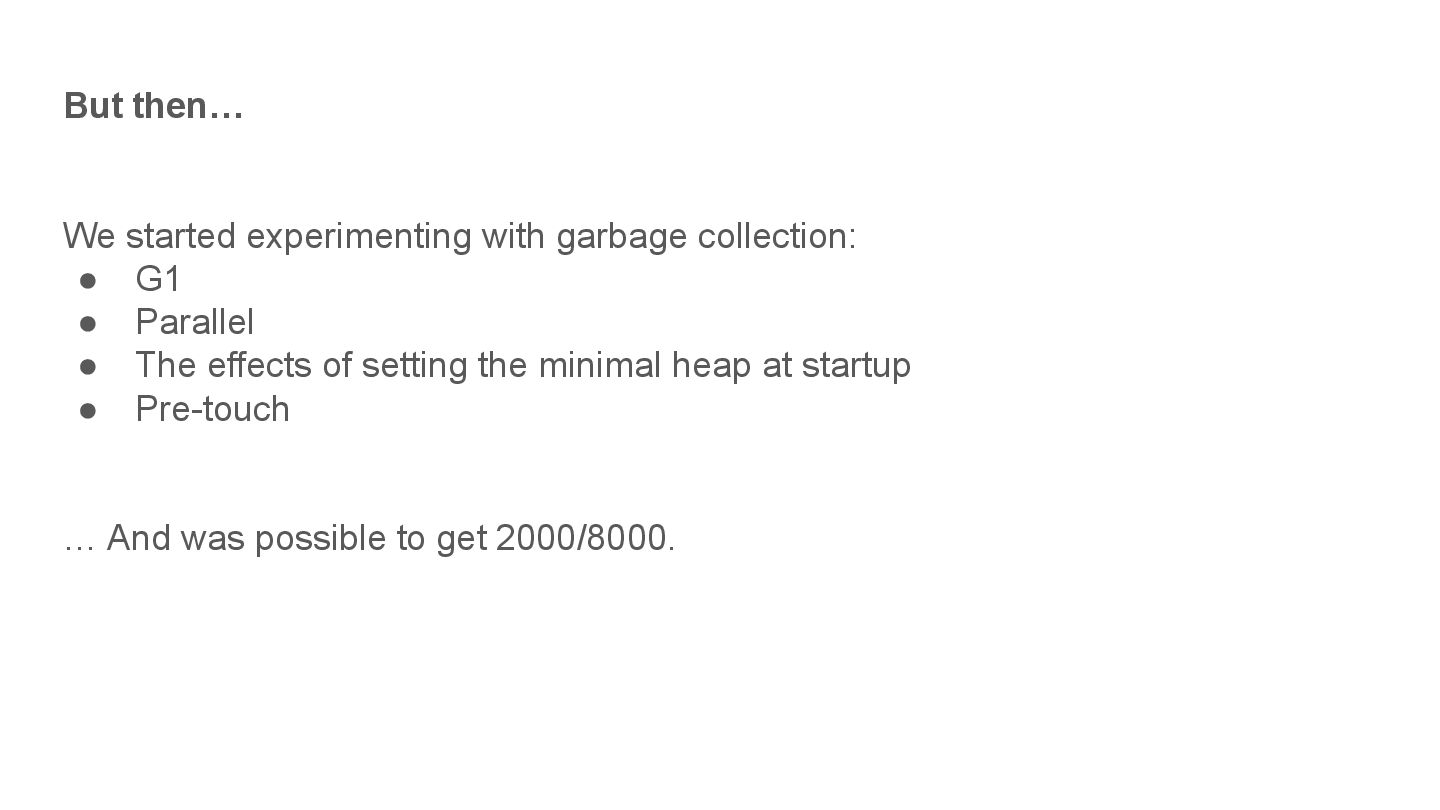
  22. But then… We started experimenting with garbage collection: • G1

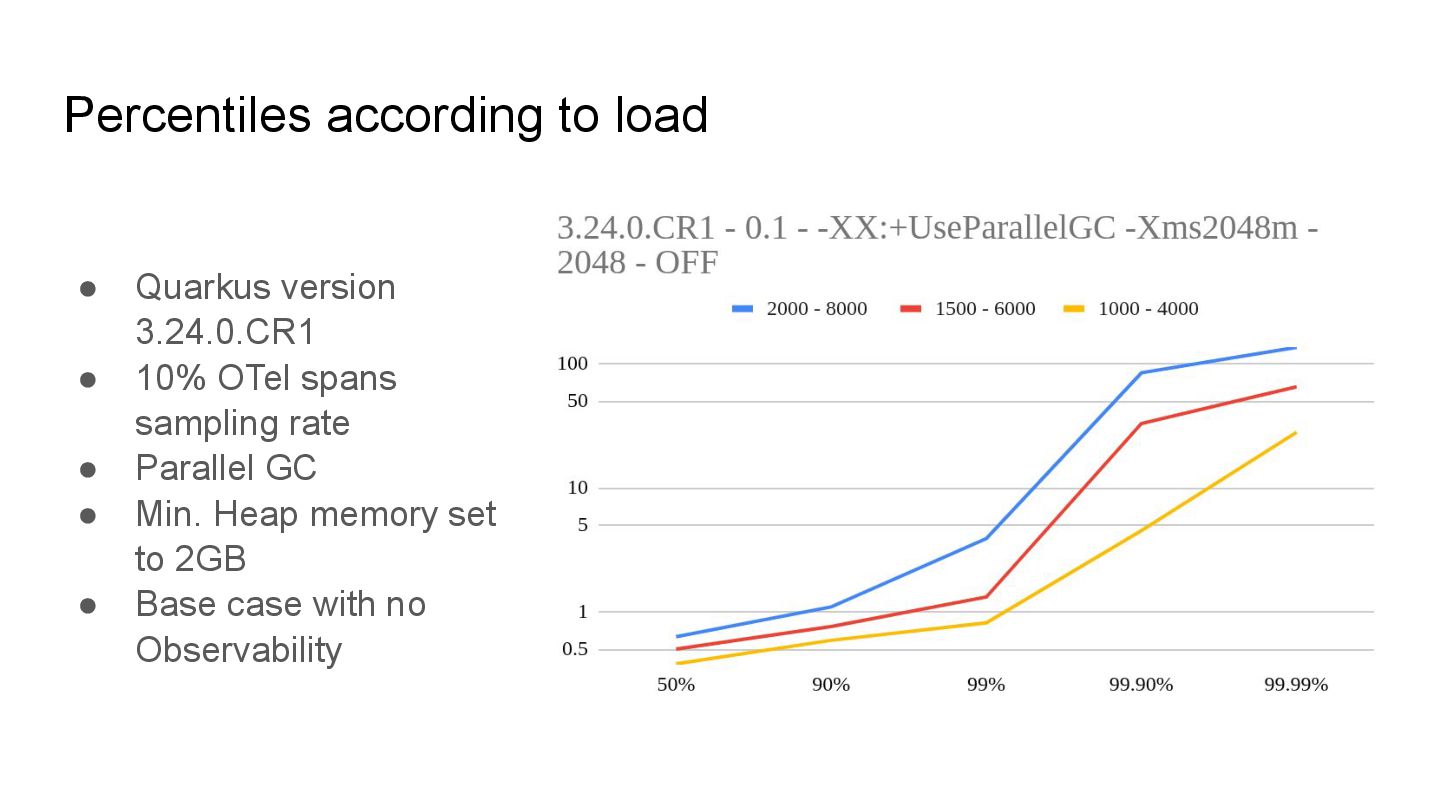
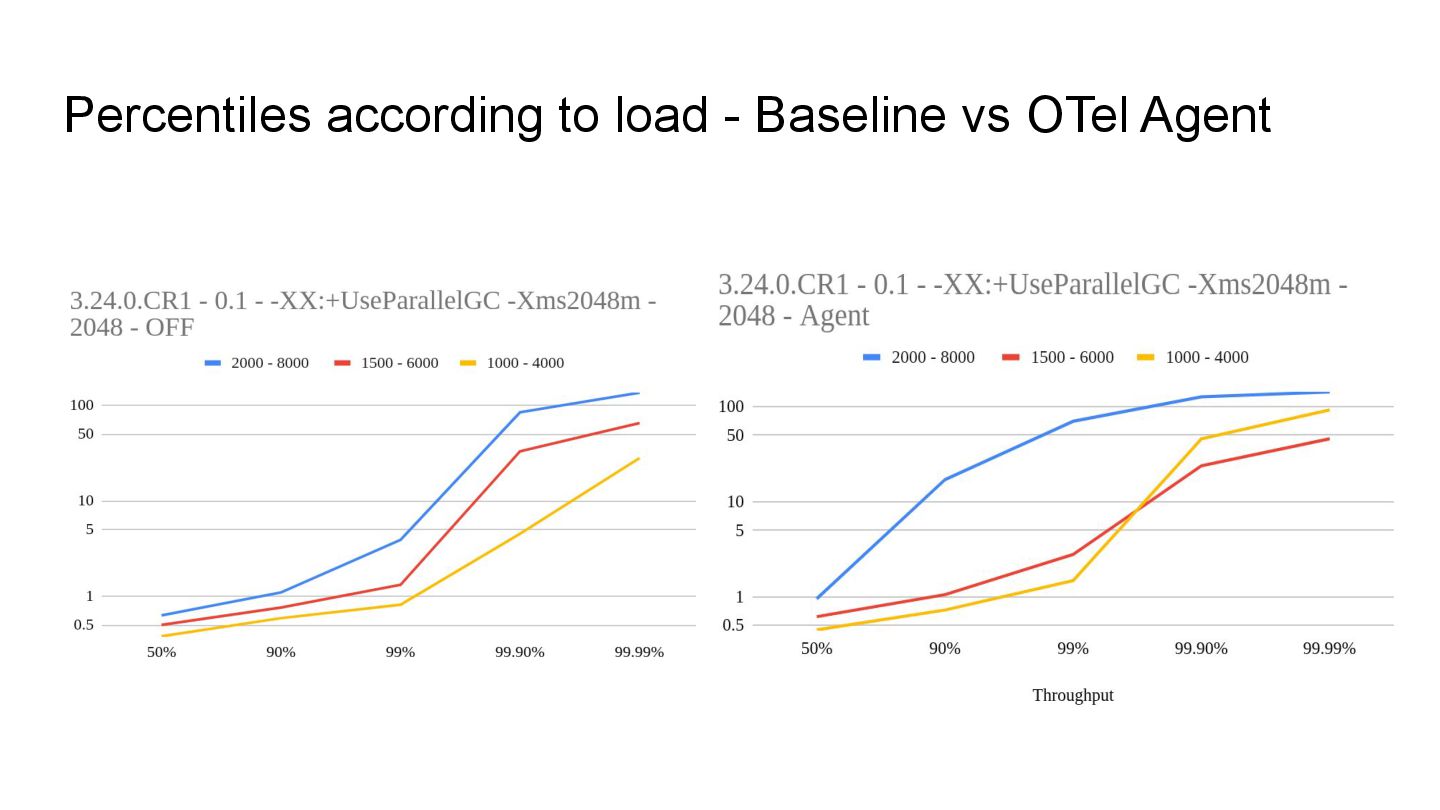
    • Parallel • The effects of setting the minimal heap at startup • Pre-touch … And was possible to get 2000/8000.
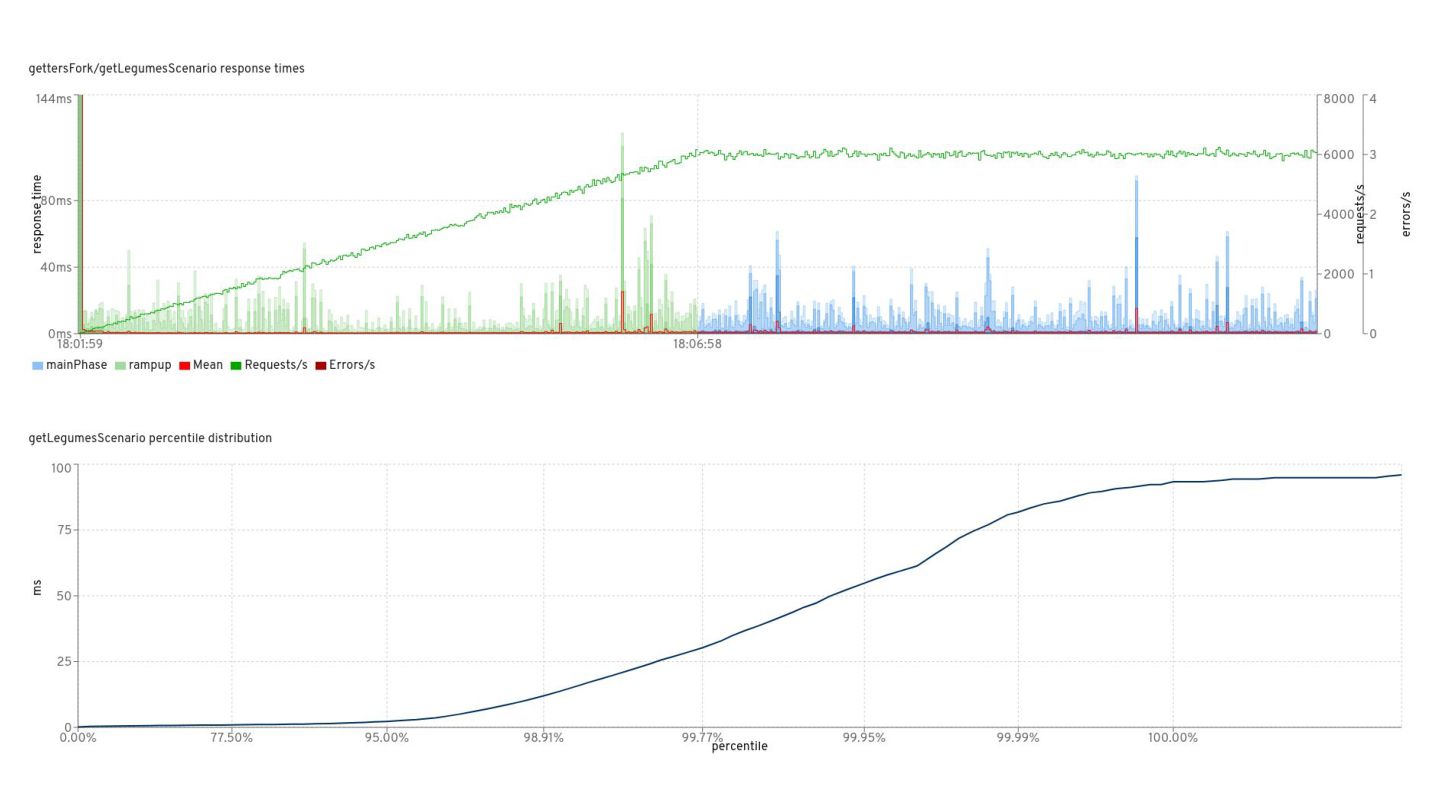
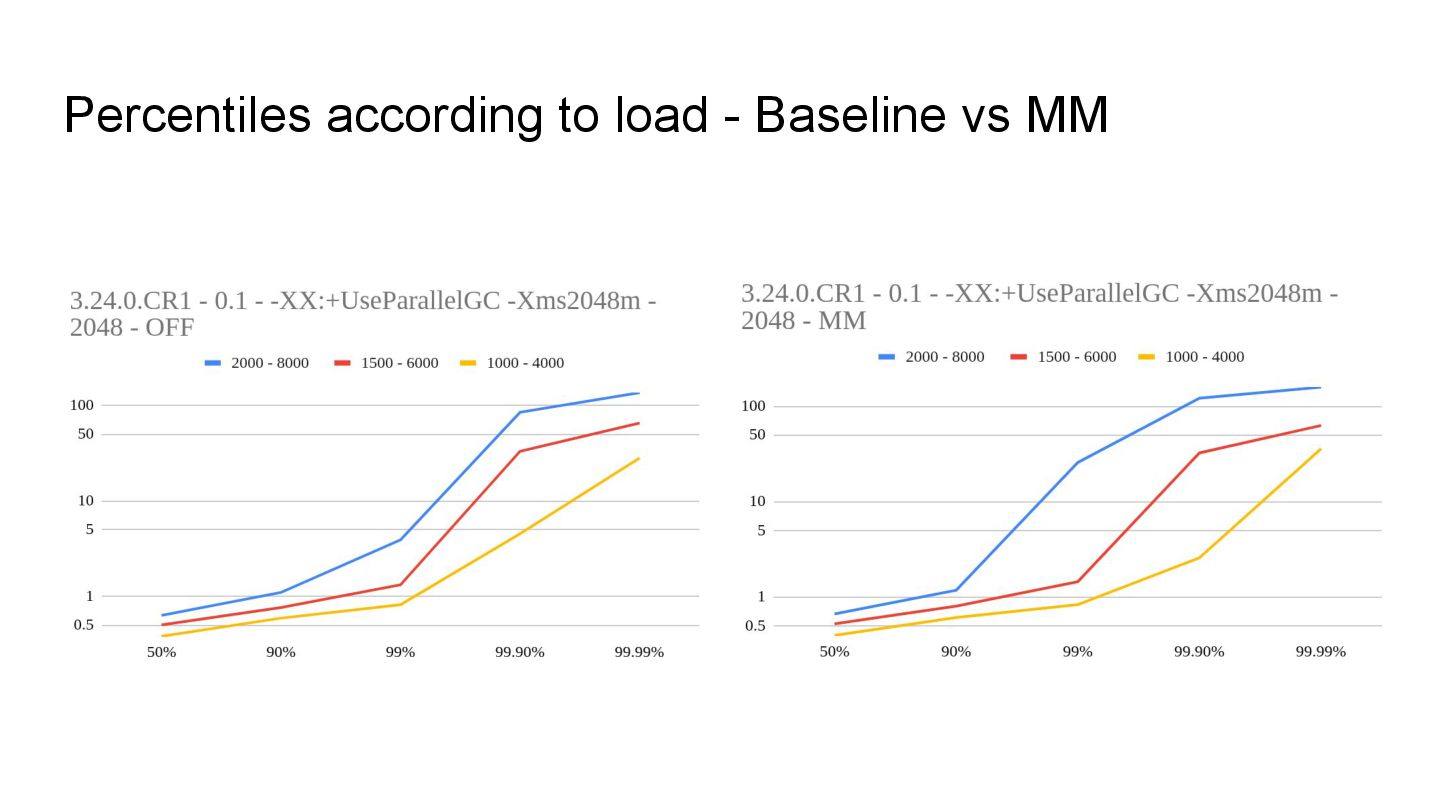
  23. Percentiles according to load • Quarkus version 3.24.0.CR1 • 10%

    OTel spans sampling rate • Parallel GC • Min. Heap memory set to 2GB • Base case with no Observability
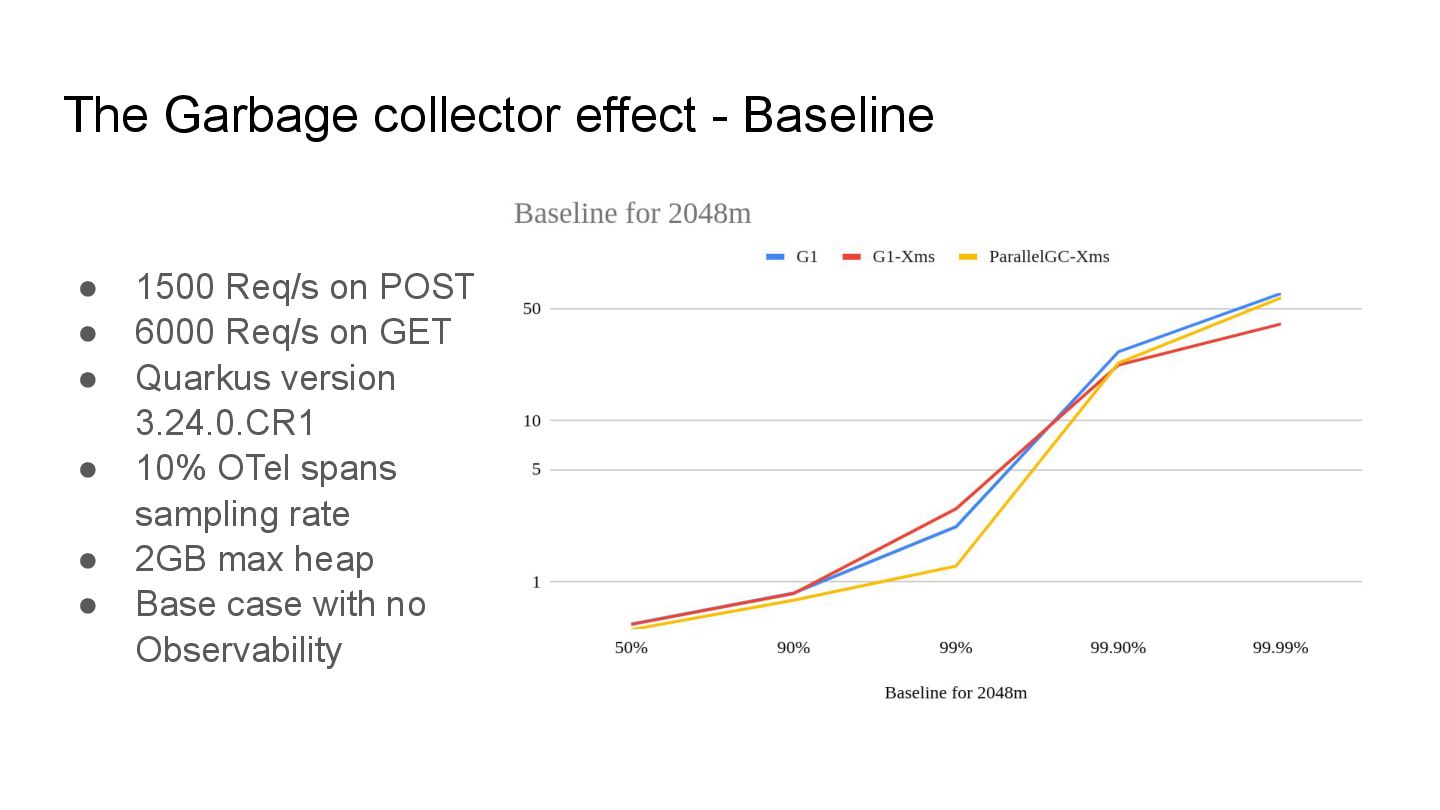
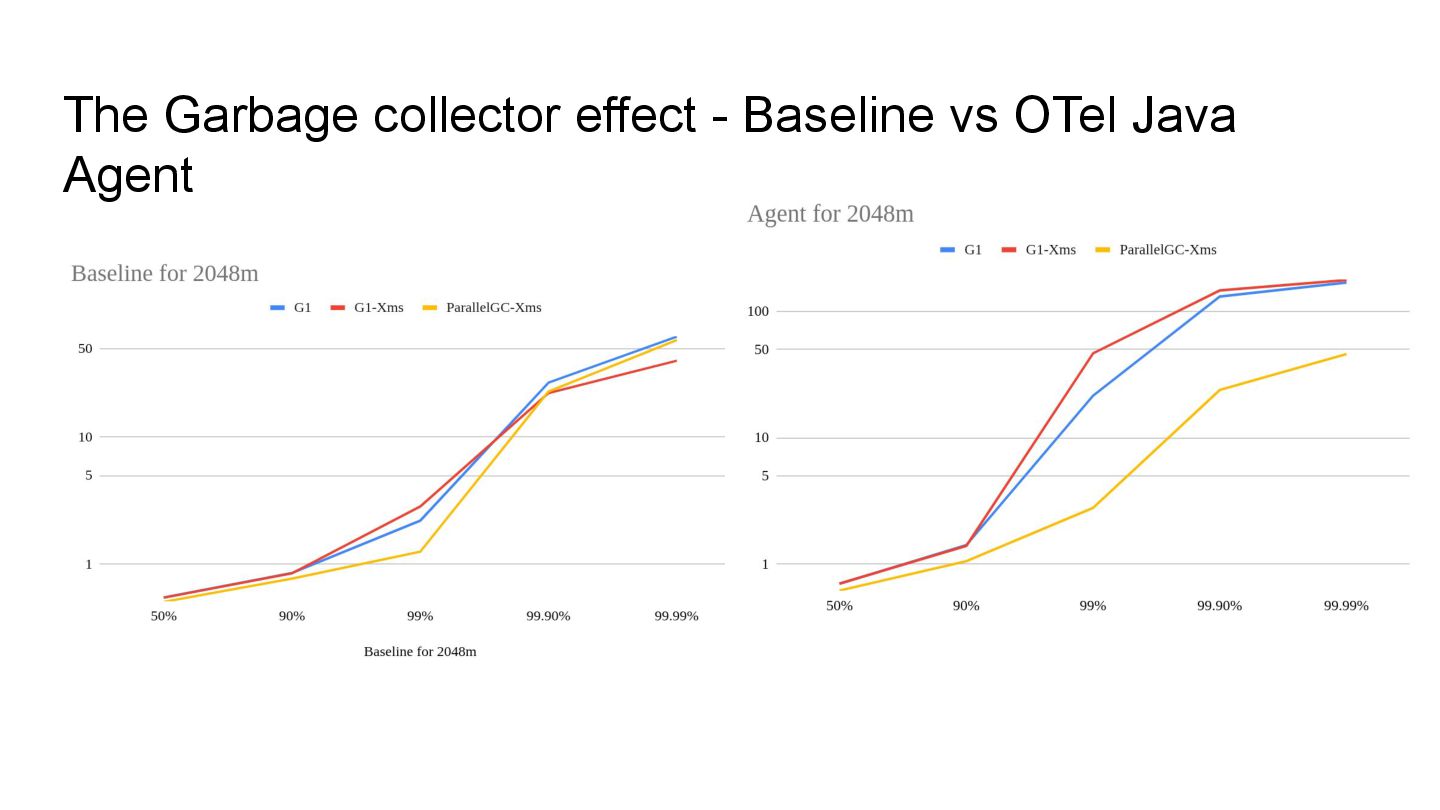
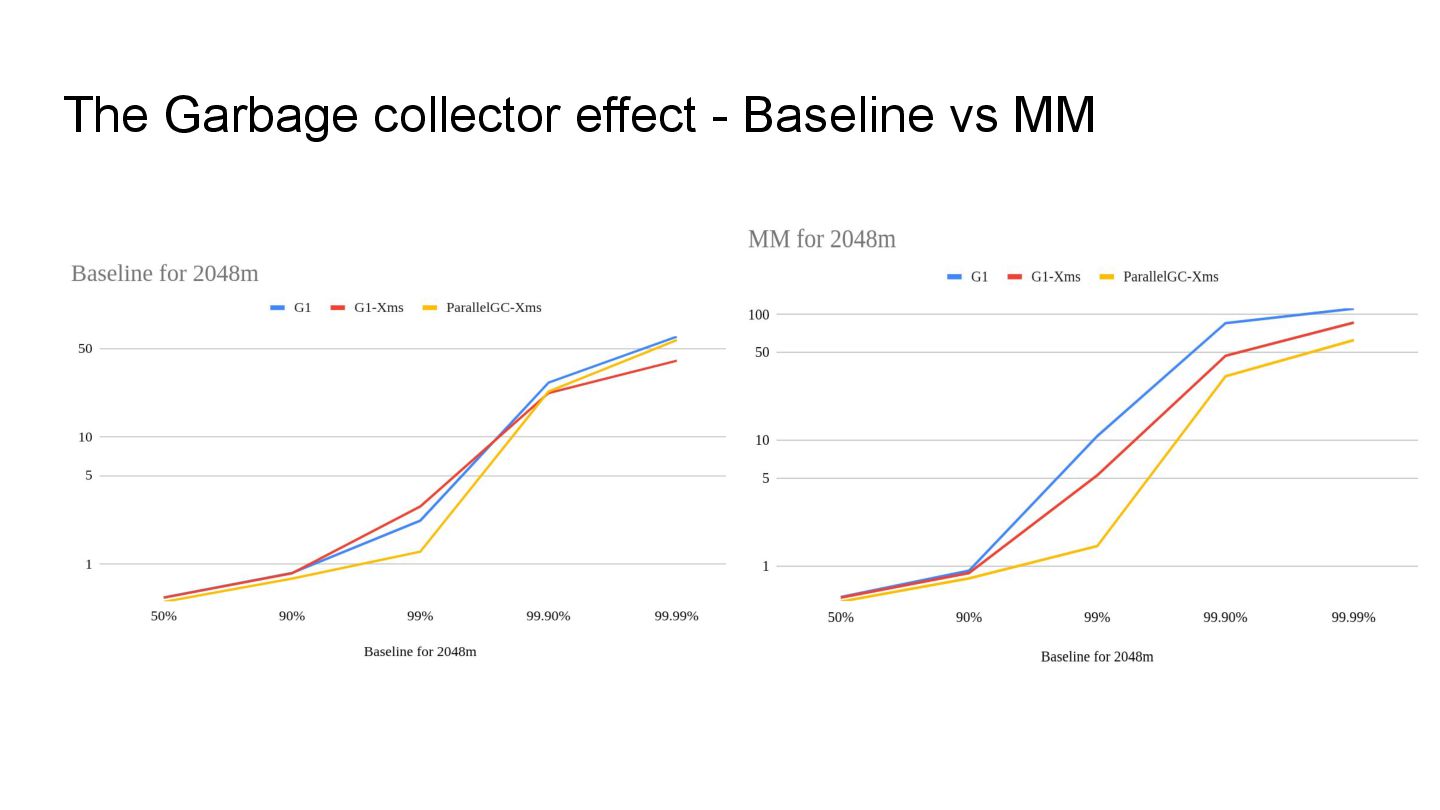
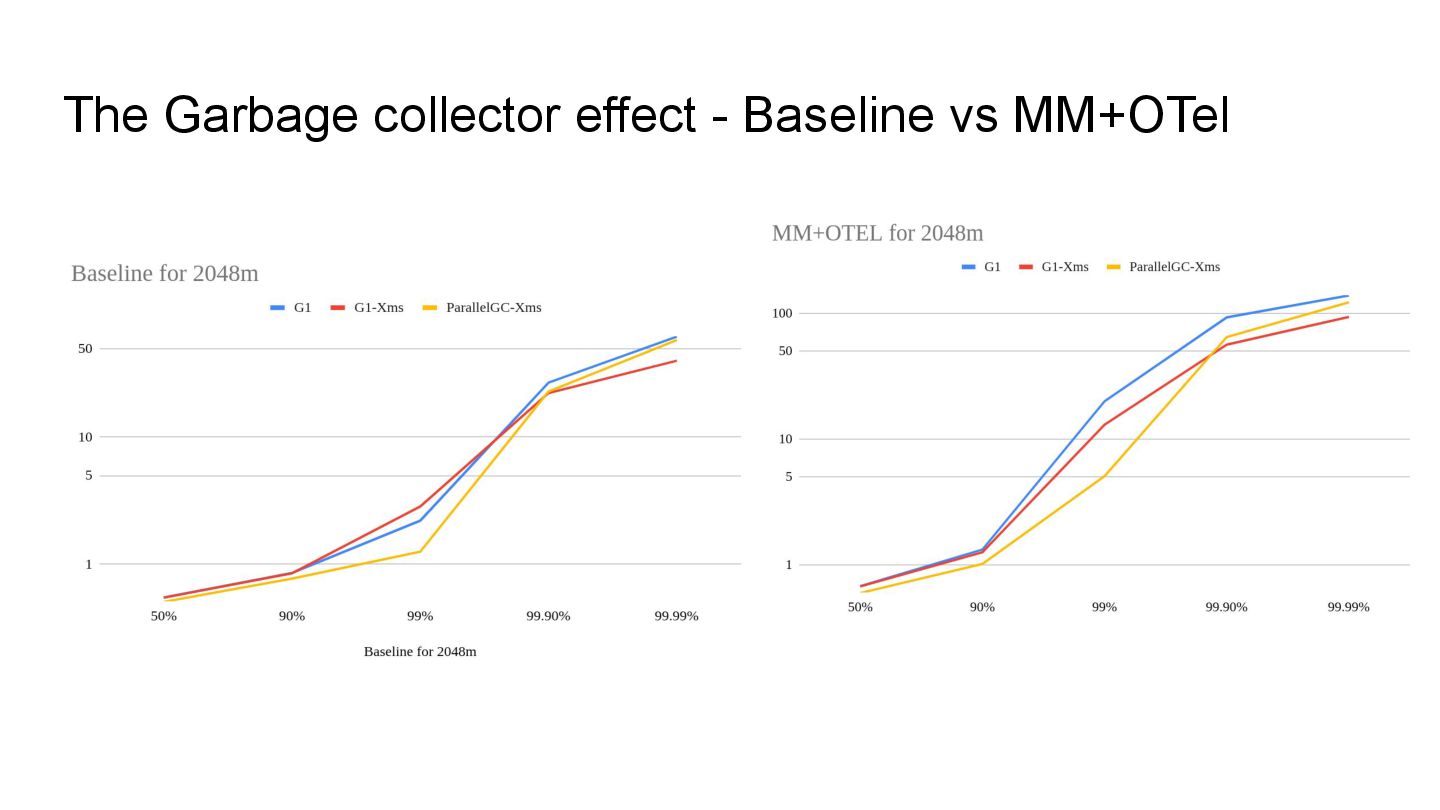
  24. The Garbage collector effect - Baseline • 1500 Req/s on

    POST • 6000 Req/s on GET • Quarkus version 3.24.0.CR1 • 10% OTel spans sampling rate • 2GB max heap • Base case with no Observability
  25. Why so much difference because of the GC? • G1

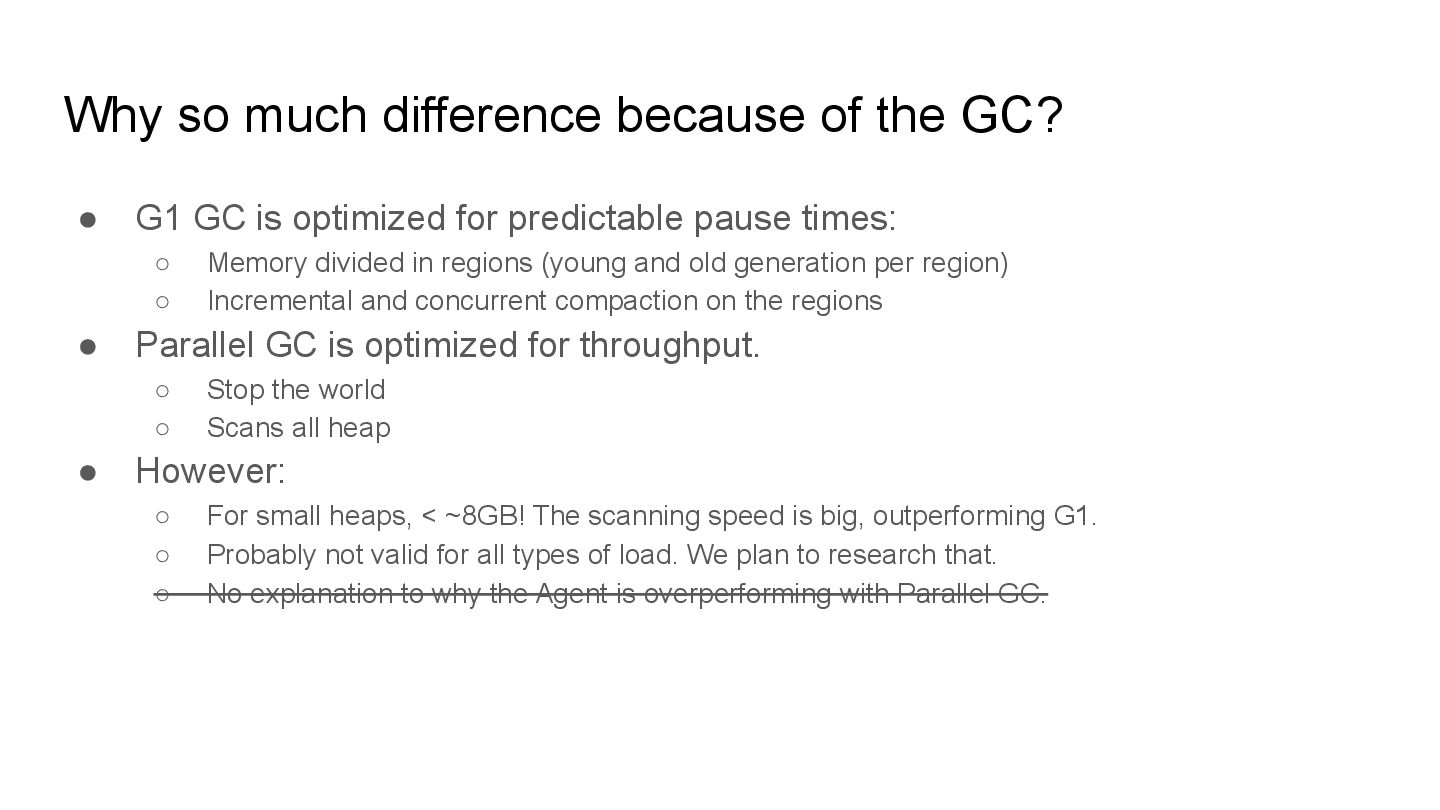
    GC is optimized for predictable pause times: ◦ Memory divided in regions (young and old generation per region) ◦ Incremental and concurrent compaction on the regions • Parallel GC is optimized for throughput. ◦ Stop the world ◦ Scans all heap • However: ◦ For small heaps, < ~8GB! The scanning speed is big, outperforming G1. ◦ Probably not valid for all types of load. We plan to research that. ◦ No explanation to why the Agent is overperforming with Parallel GC.
  26. Startup Time Startup Time (ms) Time to 1st Request(ms) Total

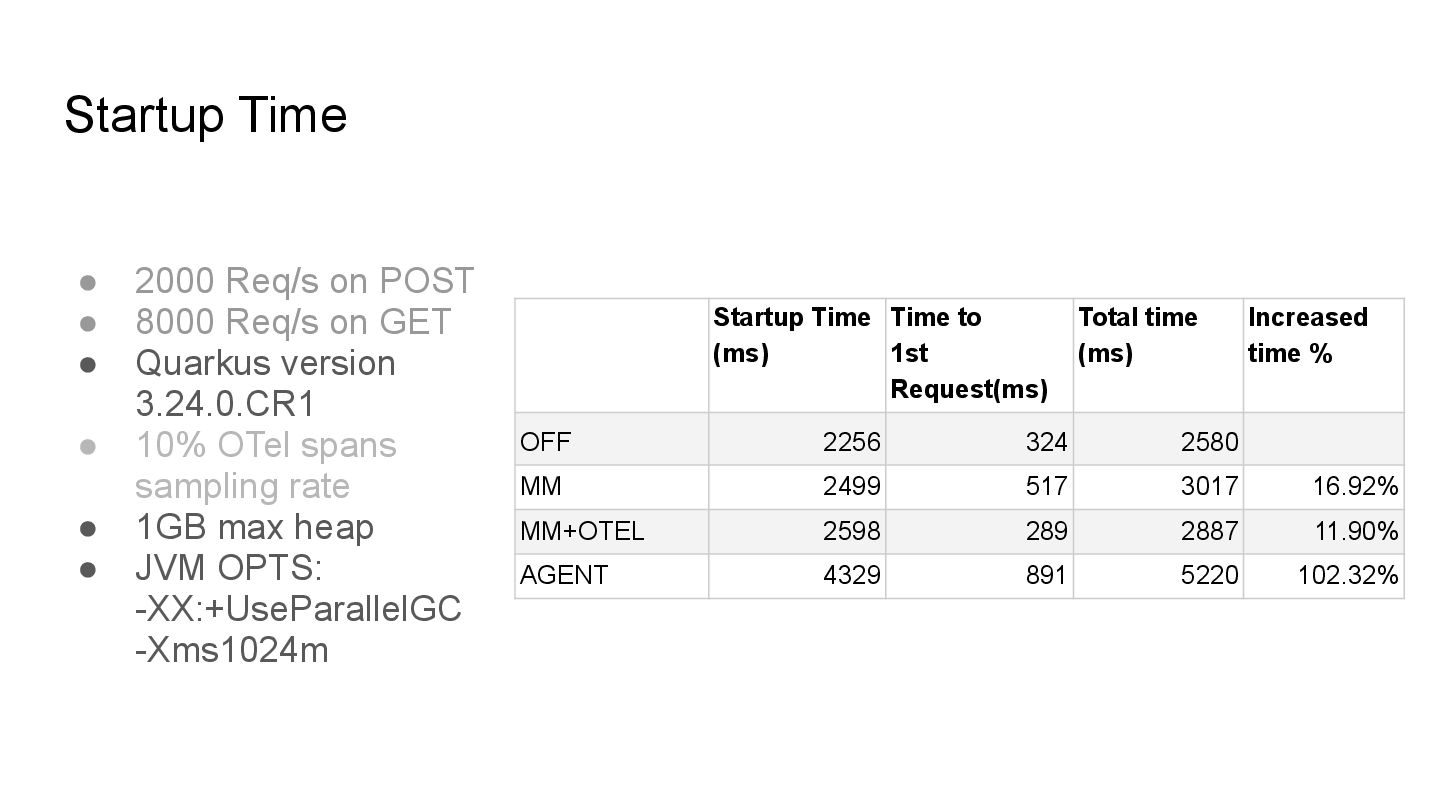
    time (ms) Increased time % OFF 2256 324 2580 MM 2499 517 3017 16.92% MM+OTEL 2598 289 2887 11.90% AGENT 4329 891 5220 102.32% • 2000 Req/s on POST • 8000 Req/s on GET • Quarkus version 3.24.0.CR1 • 10% OTel spans sampling rate • 1GB max heap • JVM OPTS: -XX:+UseParallelGC -Xms1024m
  27. Conclusions • Tuning the app's performance is important to notice

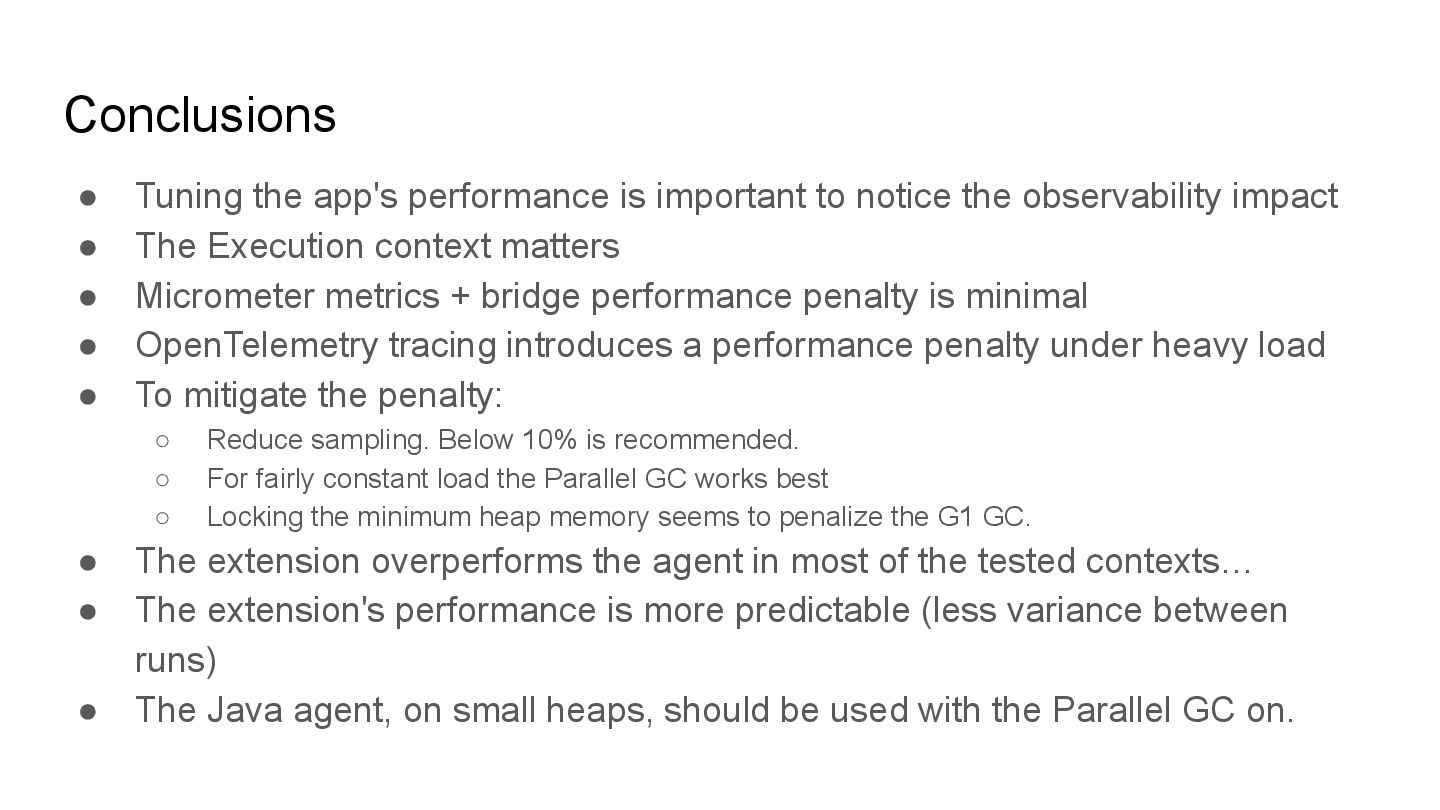
    the observability impact • The Execution context matters • Micrometer metrics + bridge performance penalty is minimal • OpenTelemetry tracing introduces a performance penalty under heavy load • To mitigate the penalty: ◦ Reduce sampling. Below 10% is recommended. ◦ For fairly constant load the Parallel GC works best ◦ Locking the minimum heap memory seems to penalize the G1 GC. • The extension overperforms the agent in most of the tested contexts… • The extension's performance is more predictable (less variance between runs) • The Java agent, on small heaps, should be used with the Parallel GC on.
  28. About performance tests… • A "real world" app is just

    an app that hasn't been optimized. • Performance tests results are very sensitive to context. Use critical thinking when reading them. • More important than the results, it's what you can learn and fix, along the way, on your app. Do them!