Share
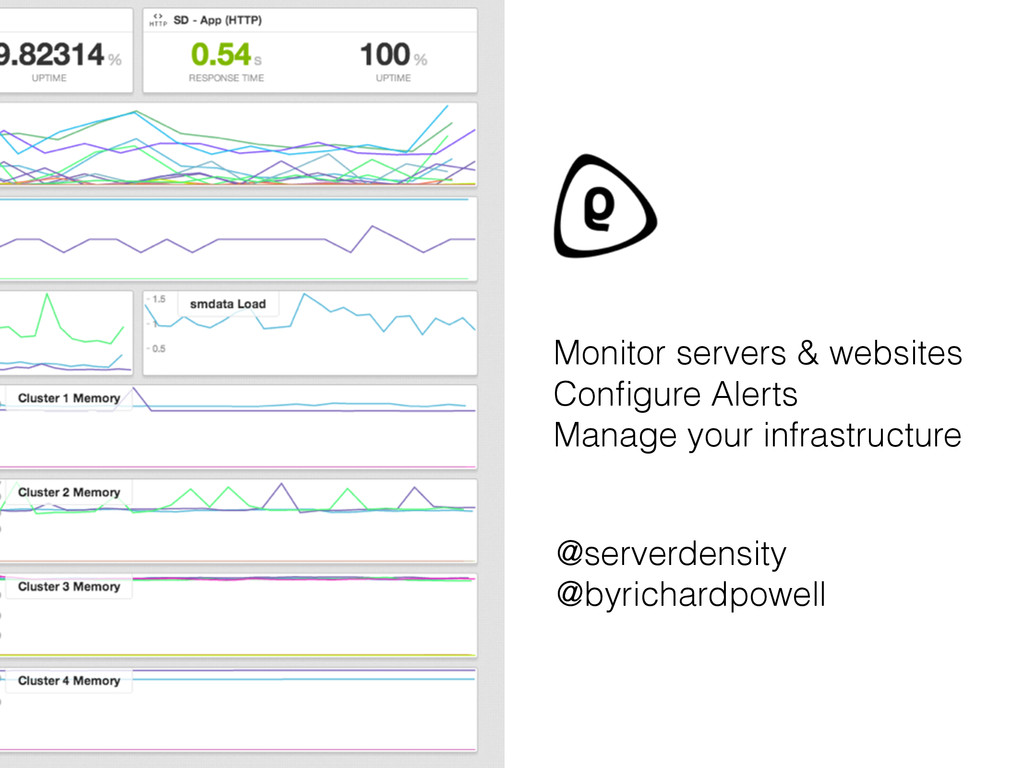
Why you shoudl care about Data Visualisation and lesson's we've learnt building Server Density's monitoring graphs.