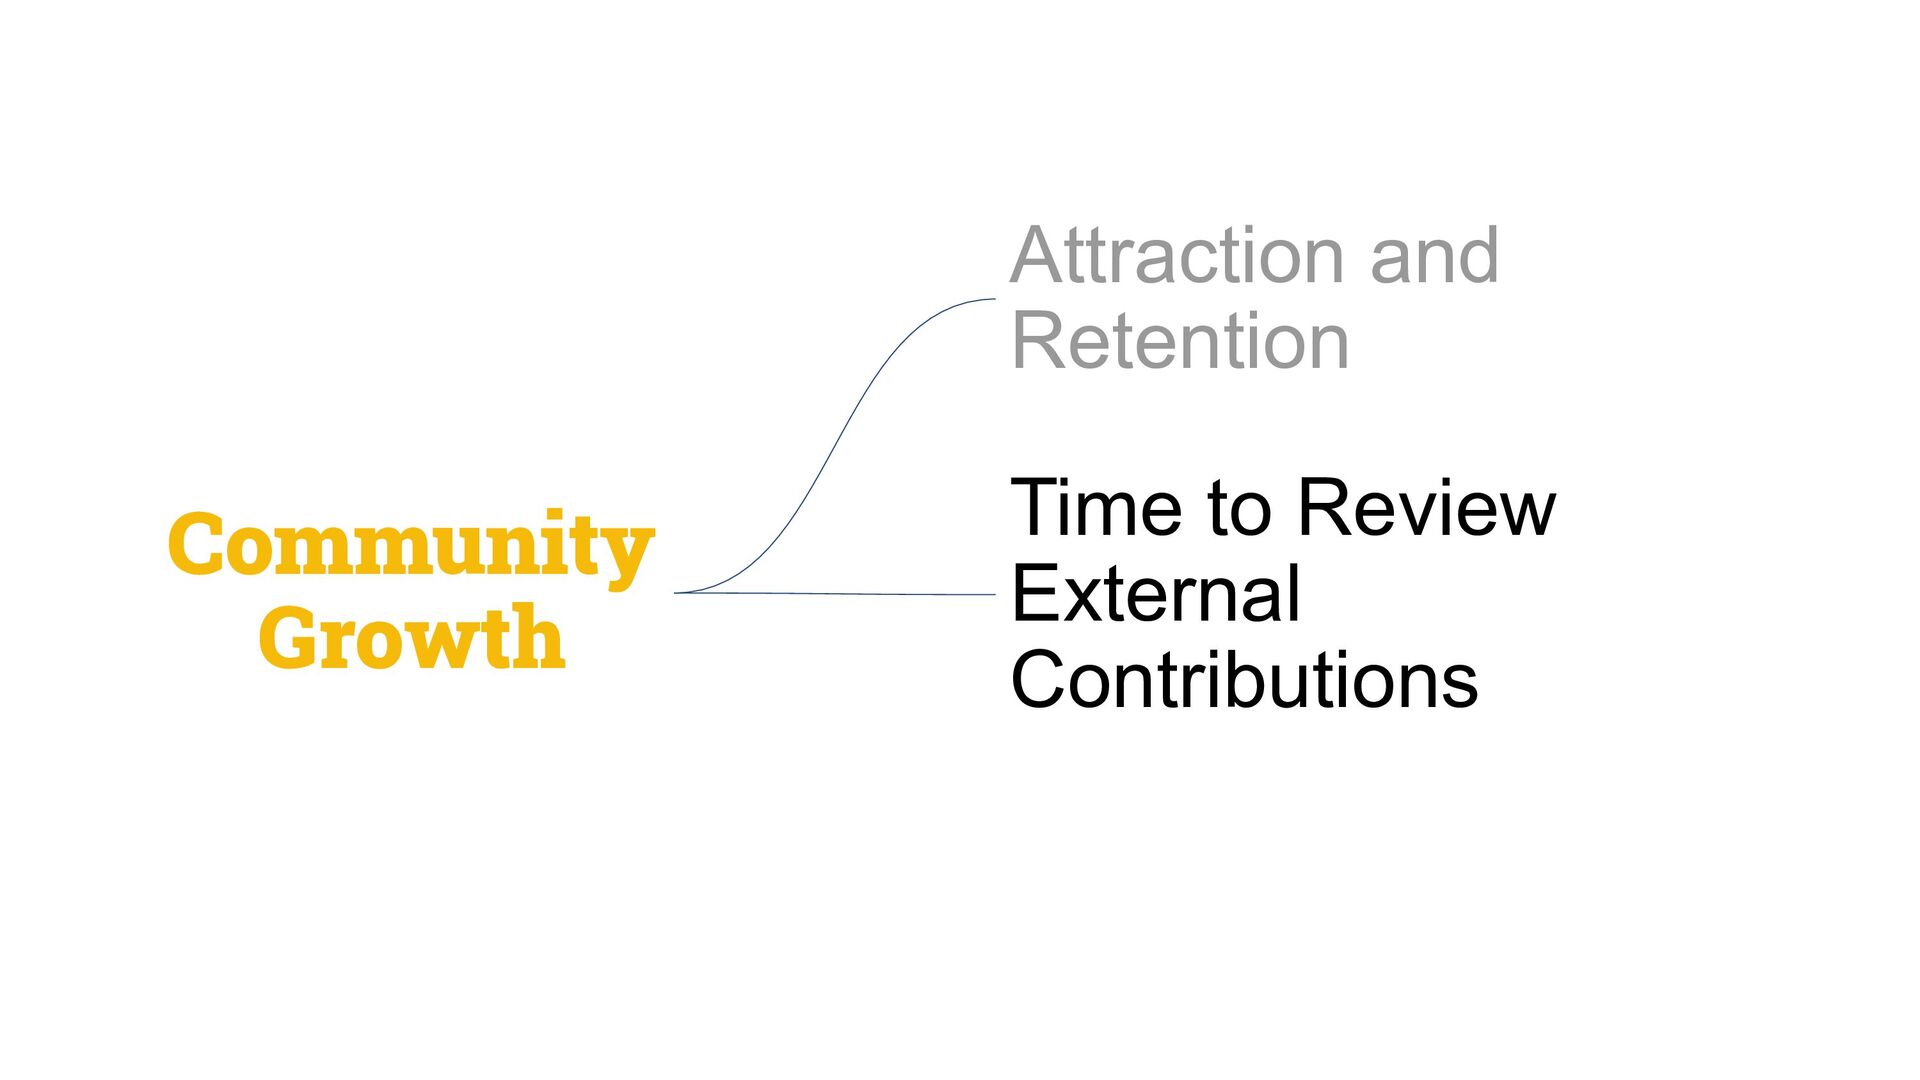
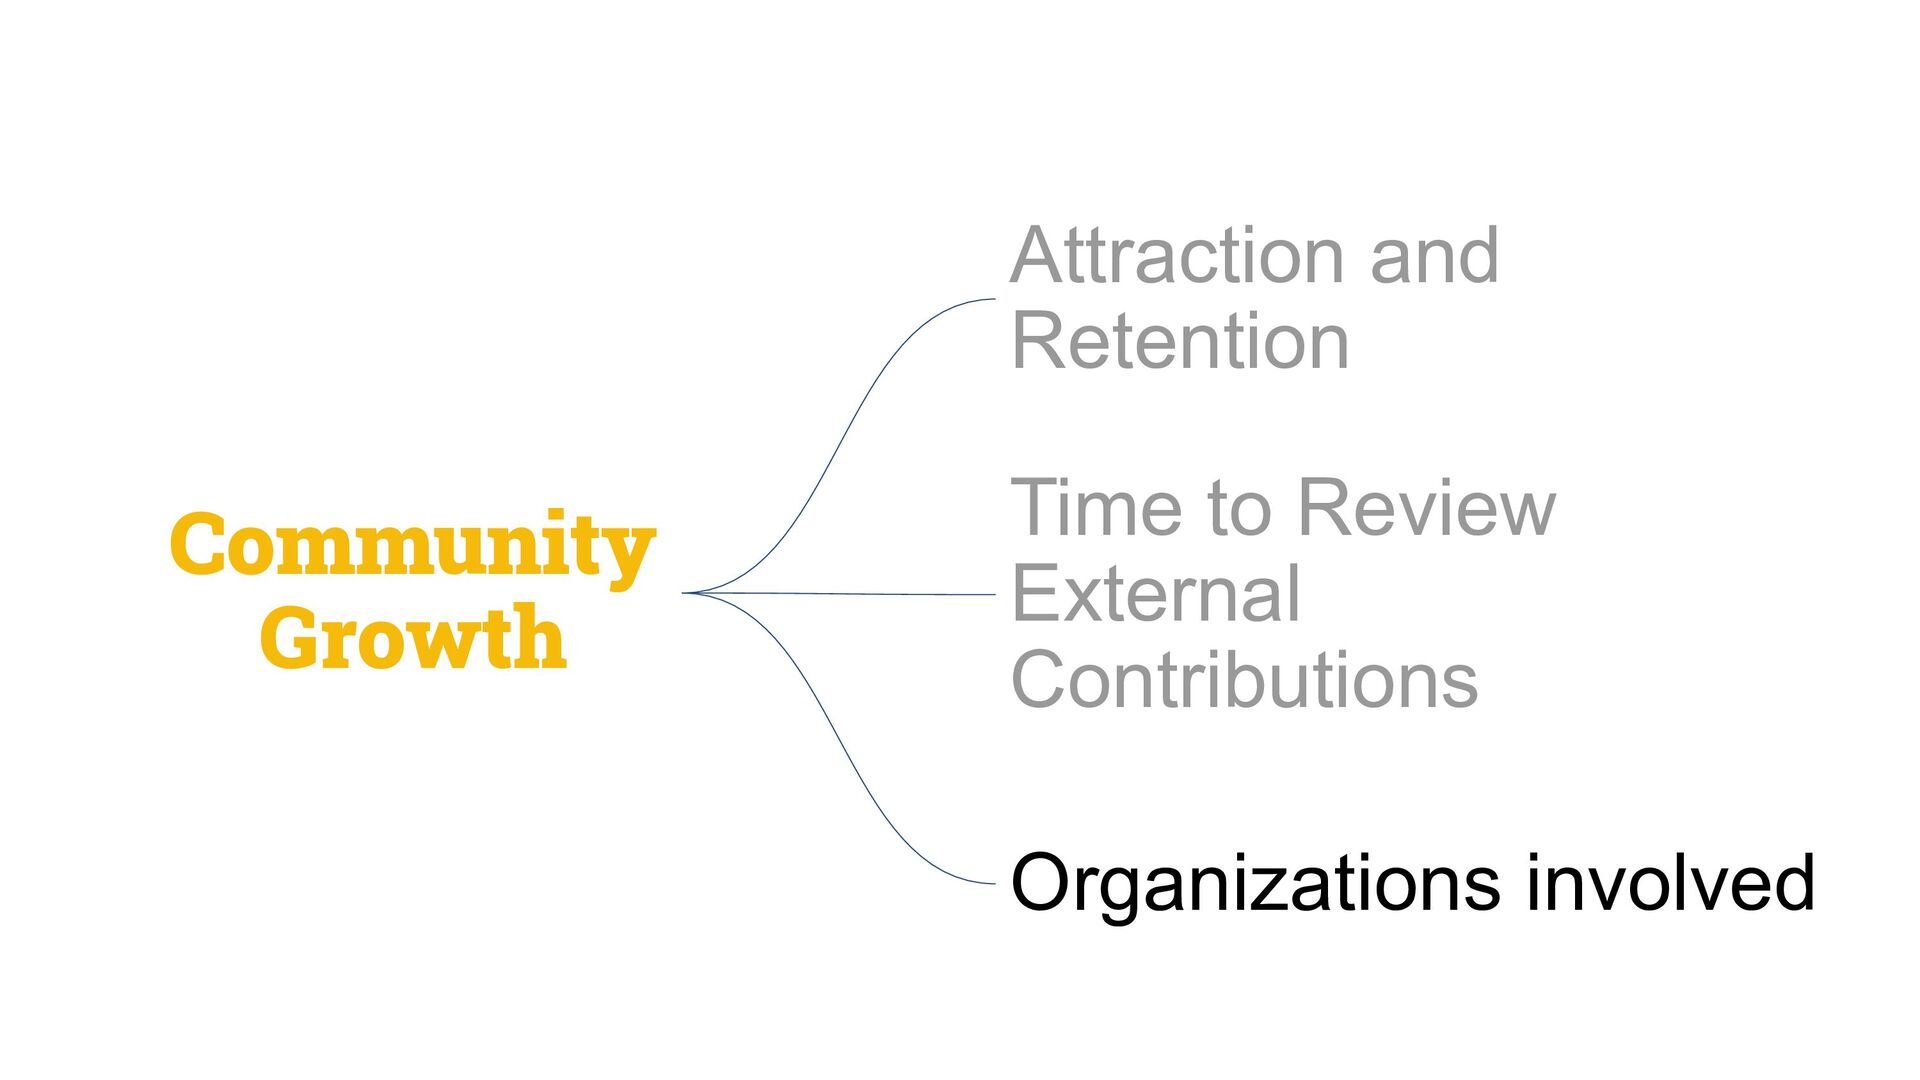
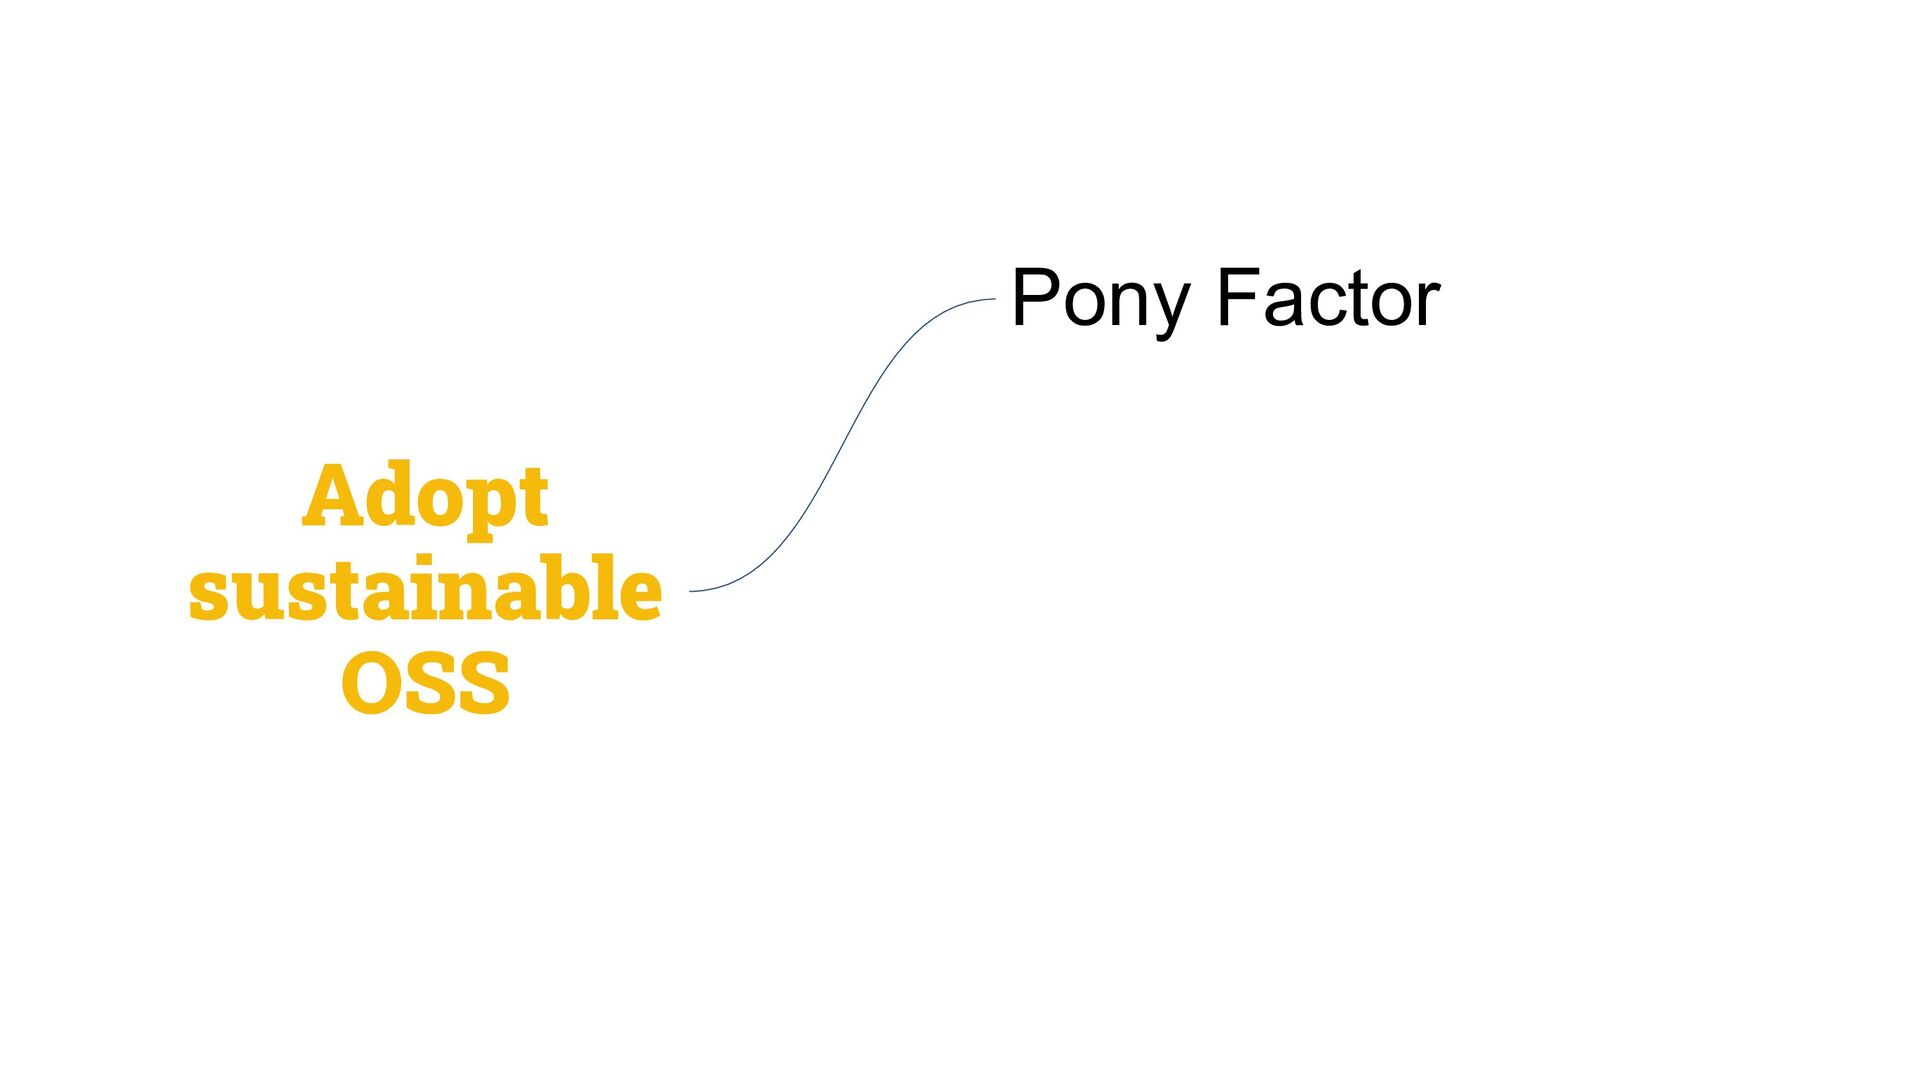
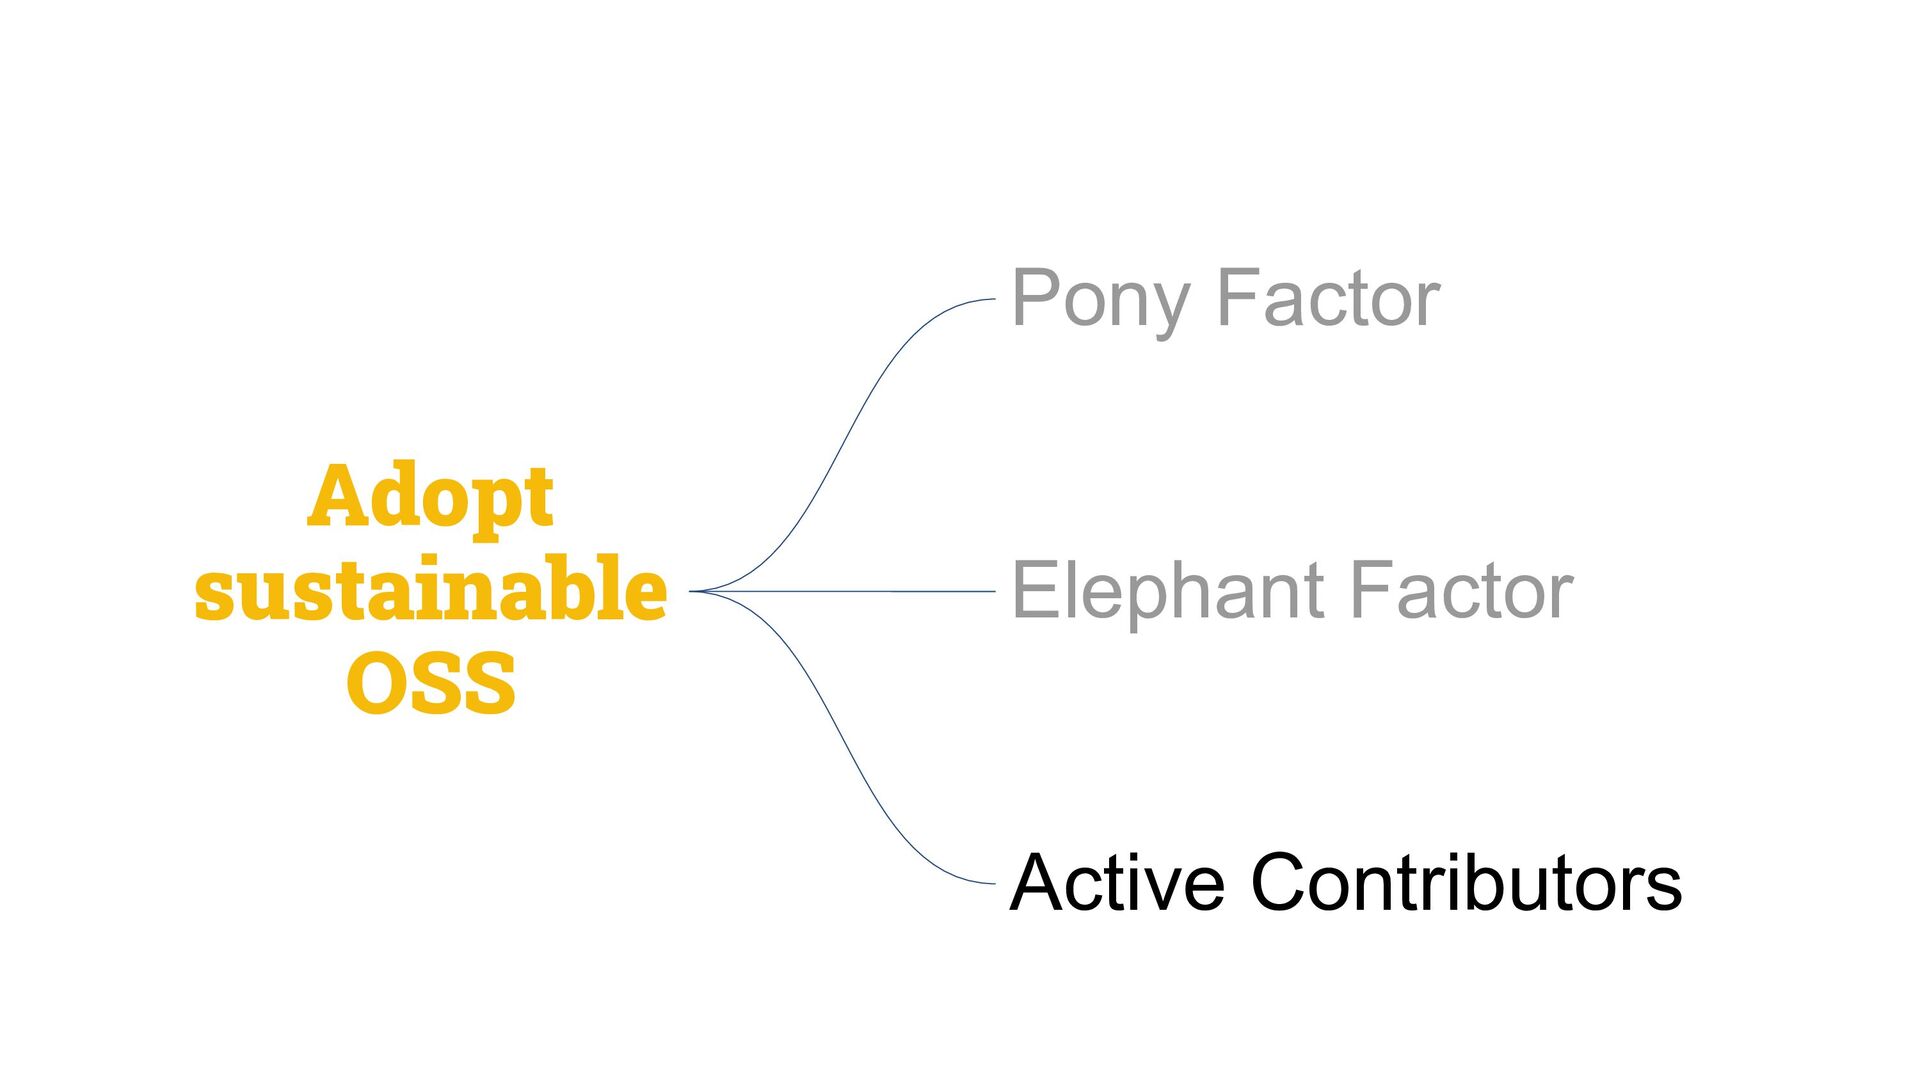
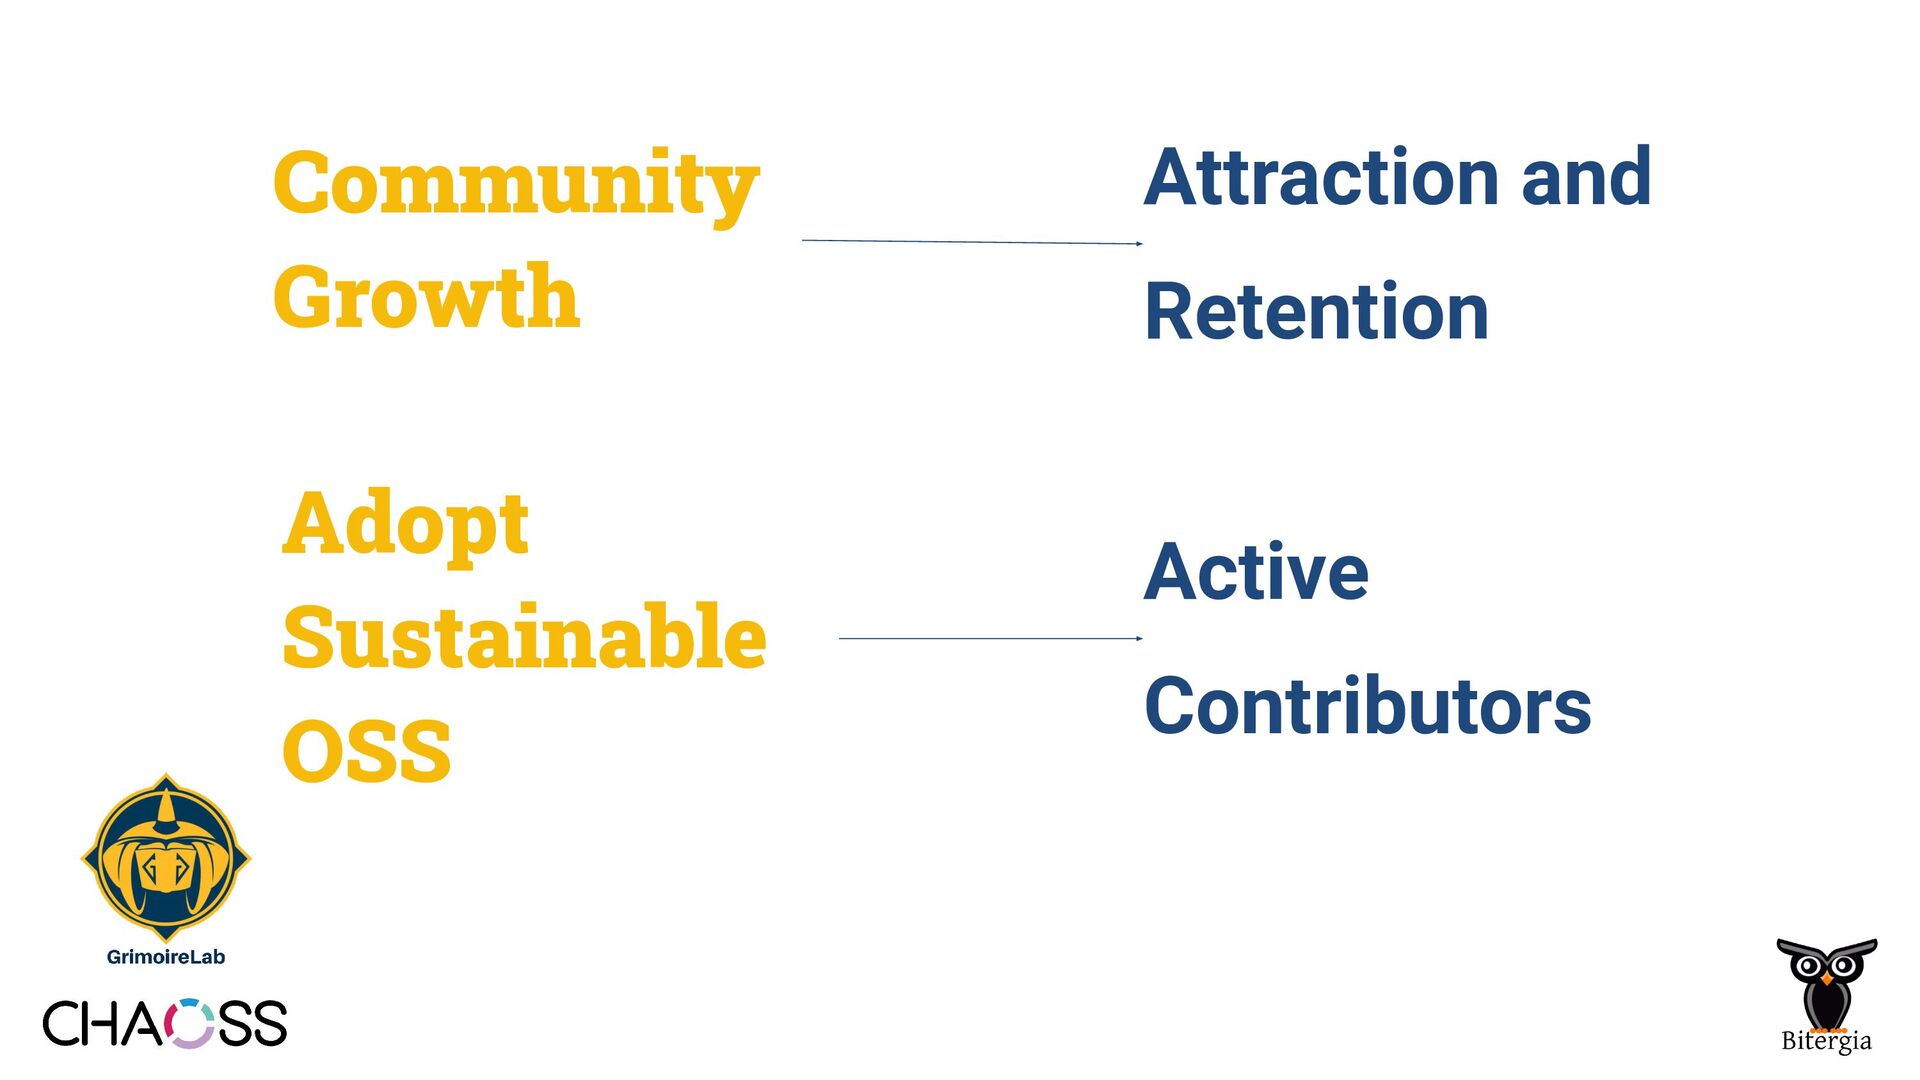
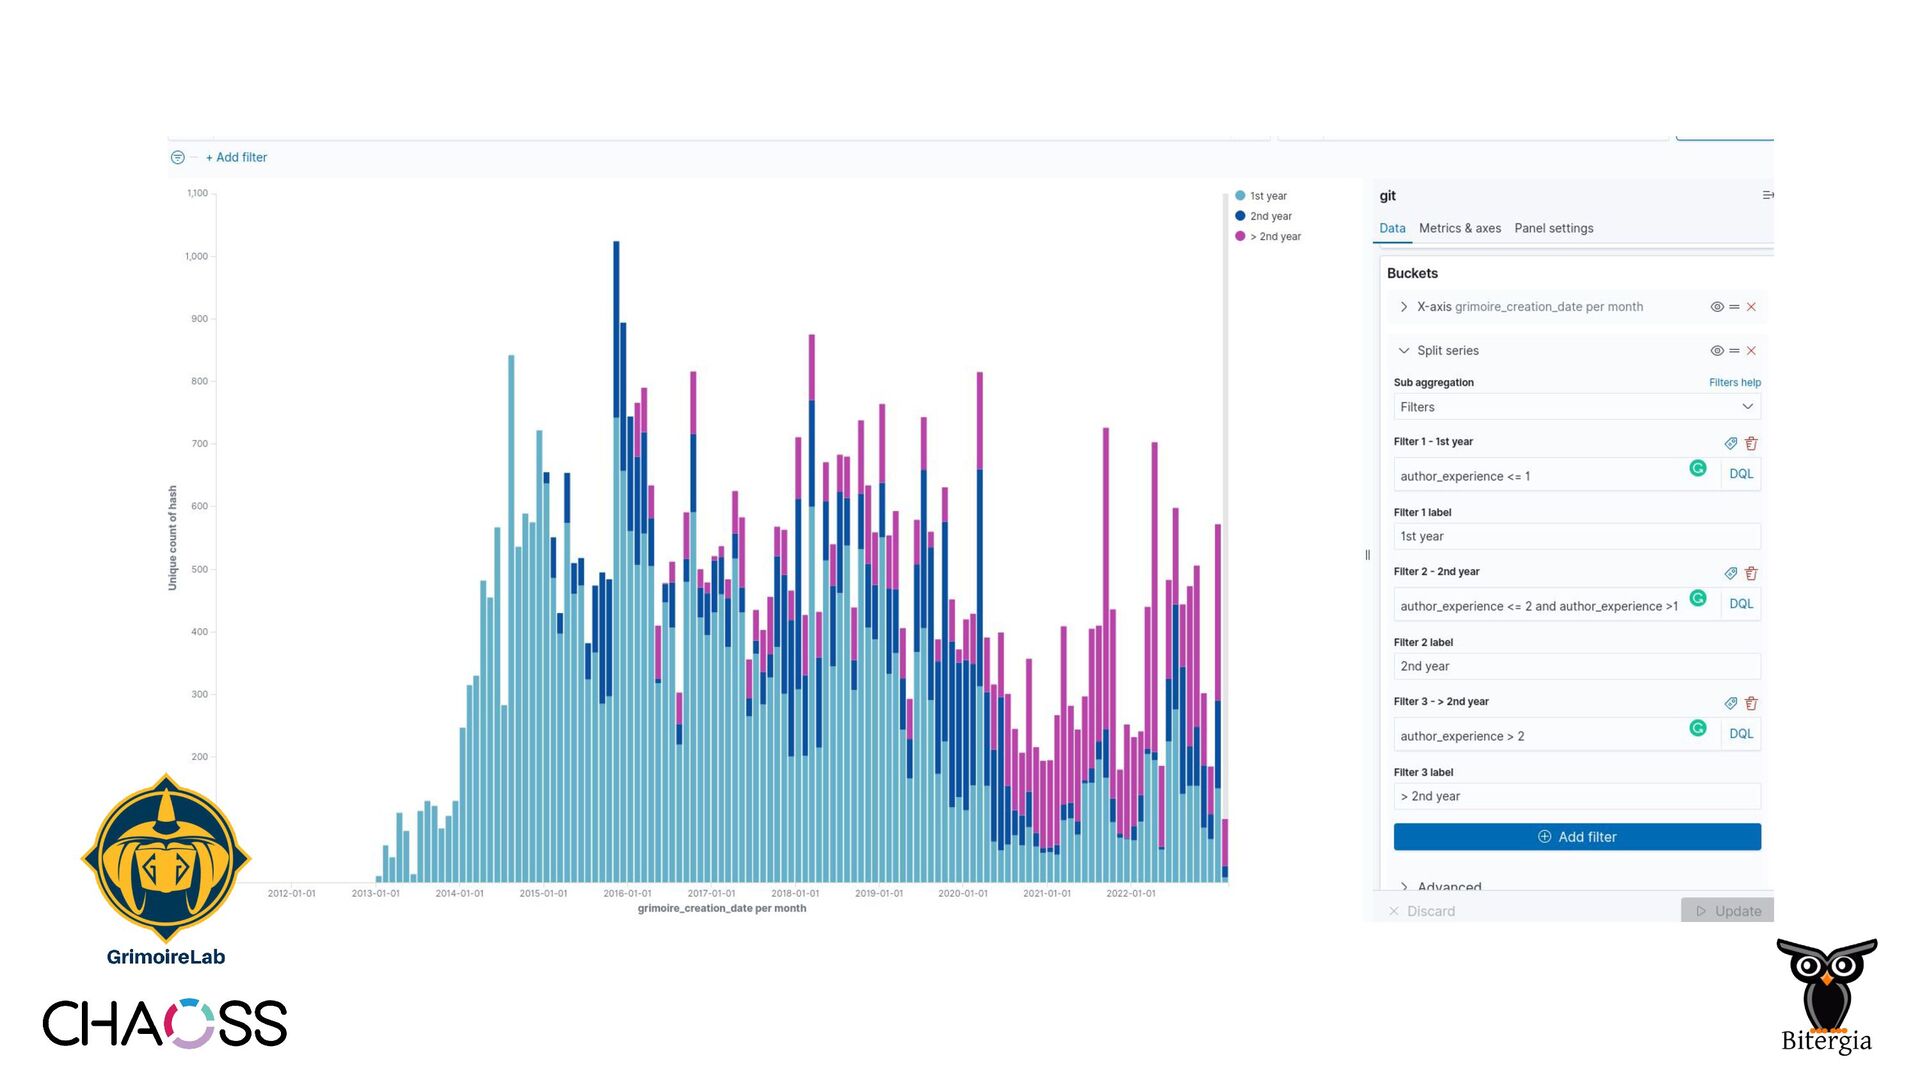
In this workshop, we introduced metrics related to the data we get from newcomers with GrimoireLab. The first part of the presentation presented two scenarios where this metric is relevant. In the second part of the workshop, we played with the dashboard and created several visualizations.
Slide #34 contains a link to create the visualizations, step by step, with the https://chaoss.biterg.io dashboard.
![Thank you! @sanacl TWITTER [email protected] EMAIL ADDRESS Questions? Let's Connect](https://files.speakerdeck.com/presentations/baf1156b2d5f476fb576f9d55fdeab1c/slide_34.jpg)