focusing on the next 6 months for short term planning and the next 2 years for longer term planning. This information could help small businesses hire back the people they had to lay off and stock up on goods for the return customers. PROBLEM Many small businesses across California depend heavily on tourist sales. When people travel, they support hotels, restaurants, transportation, and shops. In 2020, the COVID-19 pandemic has caused a sharp decrease in travel. People are eager to predict when travel will return to normal and tourist shops will regain their sales. Photo by Denys Nevozhai on UnSplash 2
as “movements that include a stay of longer than 10 minutes at an anonymized location away from home” (BTS.gov., 2020). Trips involve all varieties of transportation including cars, trains, public transportation, and flights. SOURCE The Bureau of Transportation Statistics (BTS) provides records from an “anonymized national panel of mobile device data” (BTS.gov., 2020). Mobility statistics are estimated by the Maryland Transportation Institute and Center for Advanced Transportation Technology Laboratory at the University of Maryland. Photo by NASA on UnSplash 4 Data source: https://catalog.data.gov/dataset/trips-by-distance OVERVIEW OF TRIP DATA
outliers - negative values within population not staying at home and the number of trips taken ╺ Cleaned up spelling discrepancies in the names of counties ╺ Limited data to California counties only 5 Photo by Tyler Casey on UnSplash
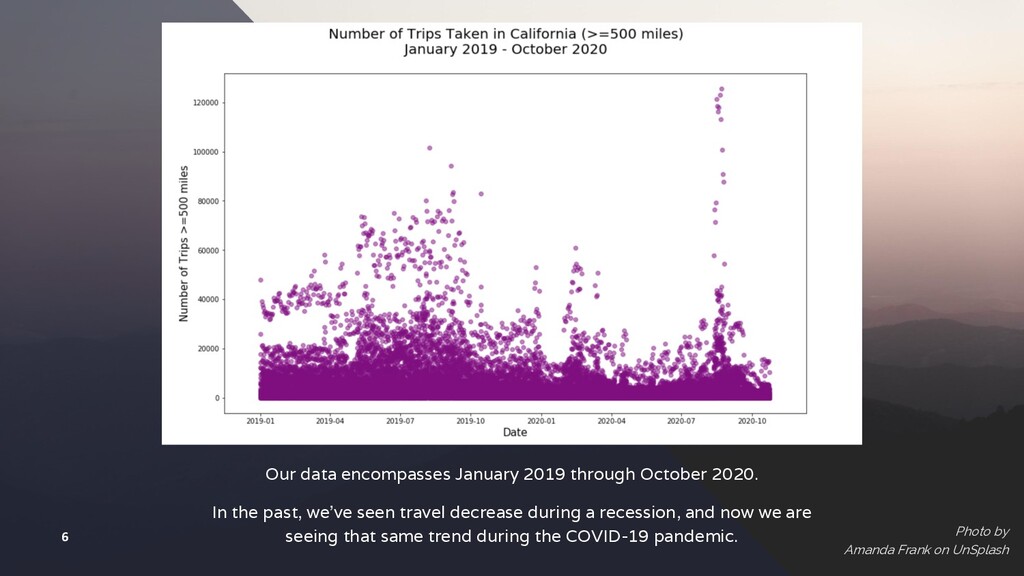
past, we’ve seen travel decrease during a recession, and now we are seeing that same trend during the COVID-19 pandemic. 6 Photo by Amanda Frank on UnSplash
as well as Covid- related deaths, per county, starting from March 19, 2020. SOURCE The California Department of Public Health (CDPH) Coronavirus Science Branch, through California Open Data, provides confirmed positive cases and deaths reported by local health departments in California and is updated daily. Photo by NASA on UnSplash 7 Data source: https://data.ca.gov/dataset/covid-19-cases/resource/926fd08f-cc91-4828-af38-bd45de97f8c3 OVERVIEW OF COVID-19 DATA
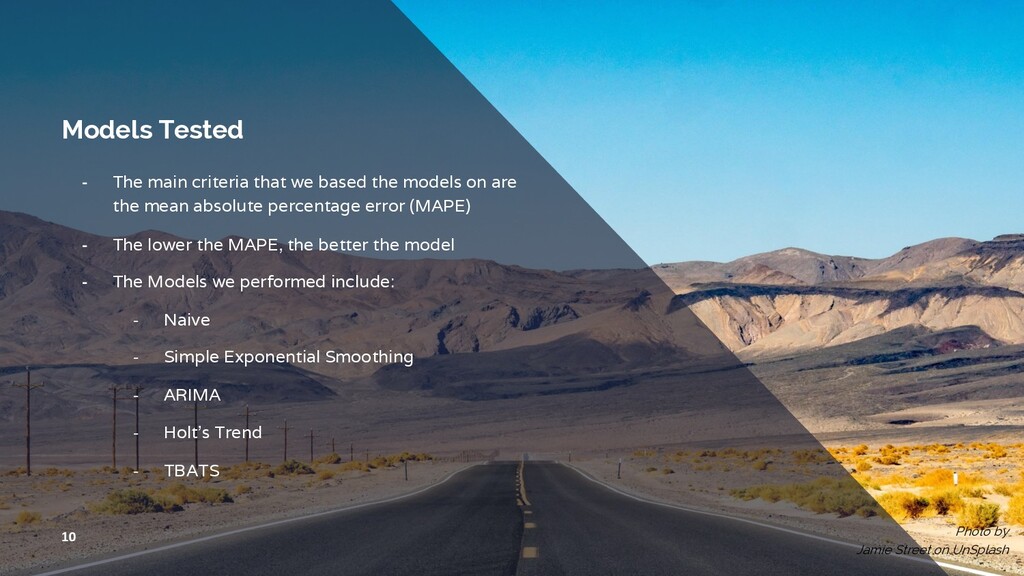
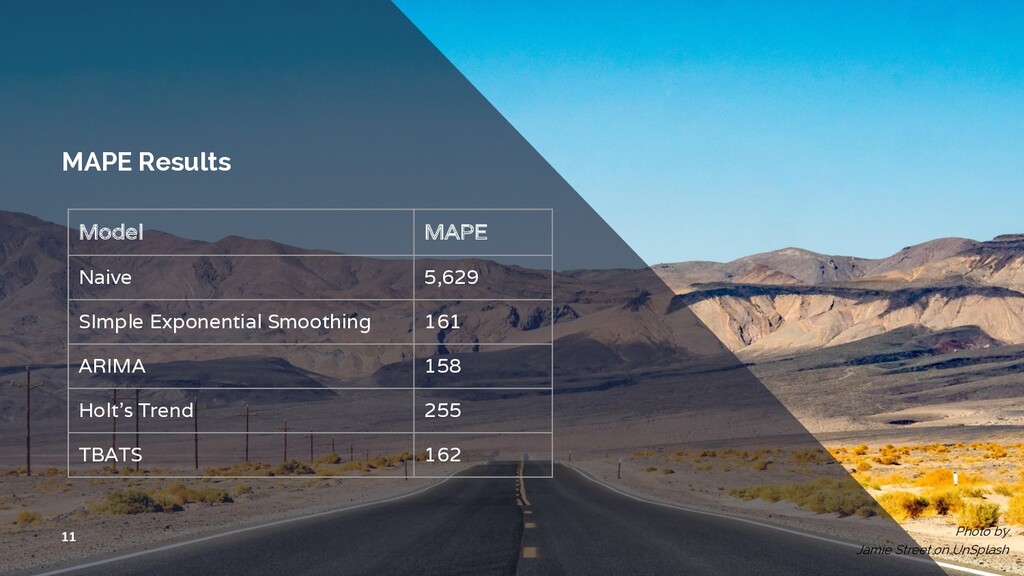
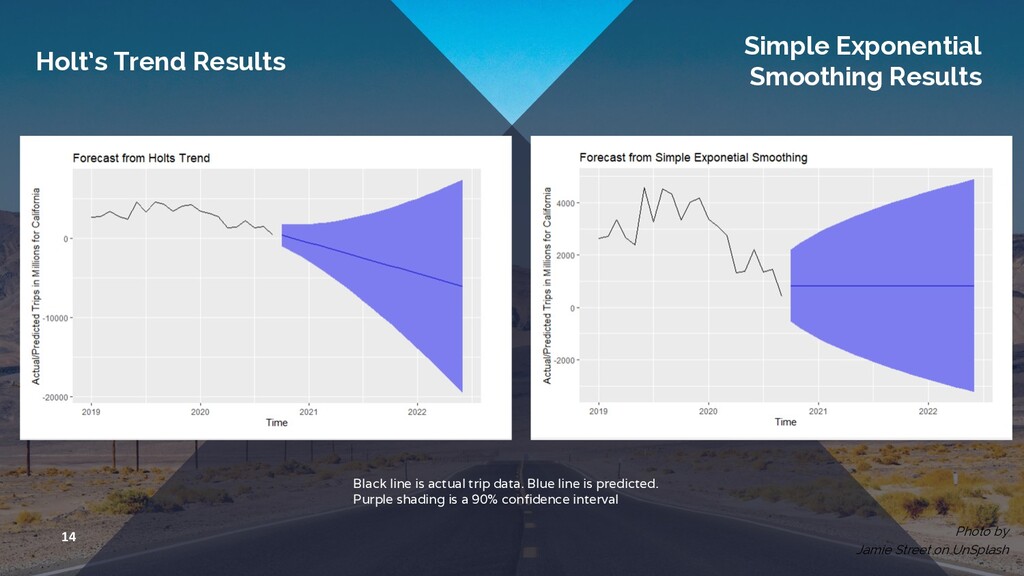
The main criteria that we based the models on are the mean absolute percentage error (MAPE) ╺ The lower the MAPE, the better the model ╺ The Models we performed include: ╶ Naive ╶ Simple Exponential Smoothing ╶ ARIMA ╶ Holt’s Trend ╶ TBATS
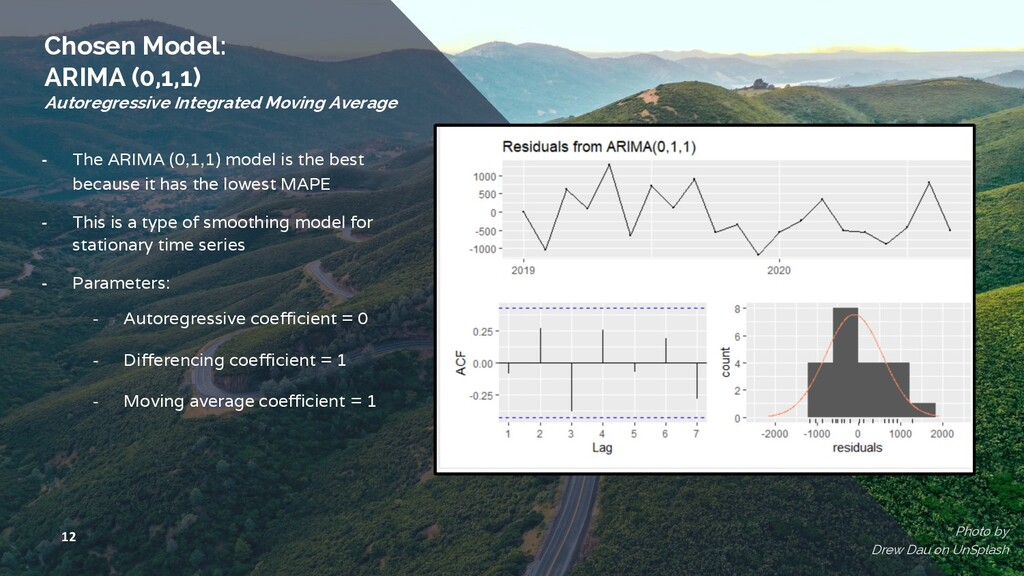
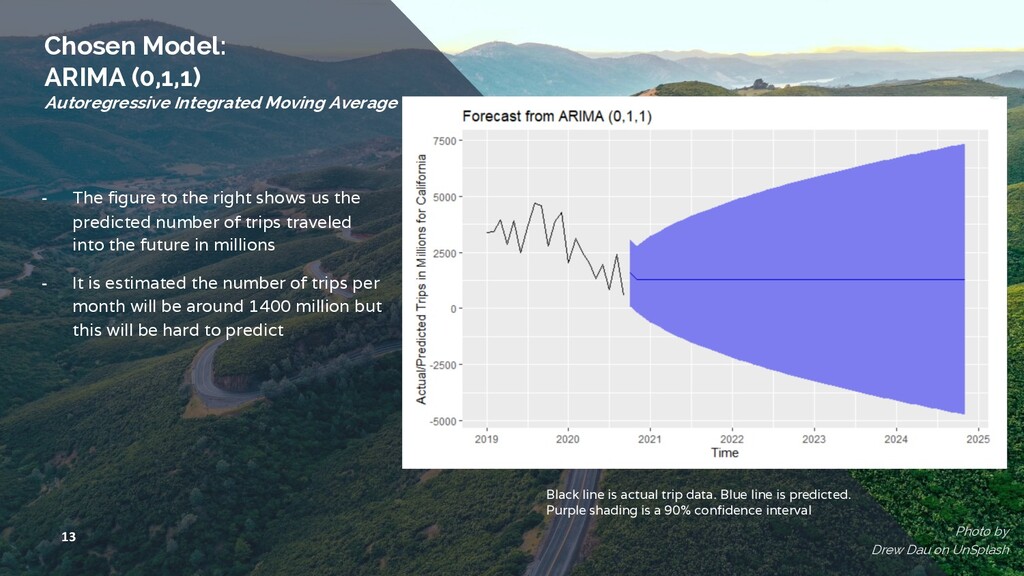
by Drew Dau on UnSplash ╺ The ARIMA (0,1,1) model is the best because it has the lowest MAPE ╺ This is a type of smoothing model for stationary time series ╺ Parameters: ╶ Autoregressive coefficient = 0 ╶ Differencing coefficient = 1 ╶ Moving average coefficient = 1
by Drew Dau on UnSplash ╺ The figure to the right shows us the predicted number of trips traveled into the future in millions ╺ It is estimated the number of trips per month will be around 1400 million but this will be hard to predict Black line is actual trip data. Blue line is predicted. Purple shading is a 90% confidence interval
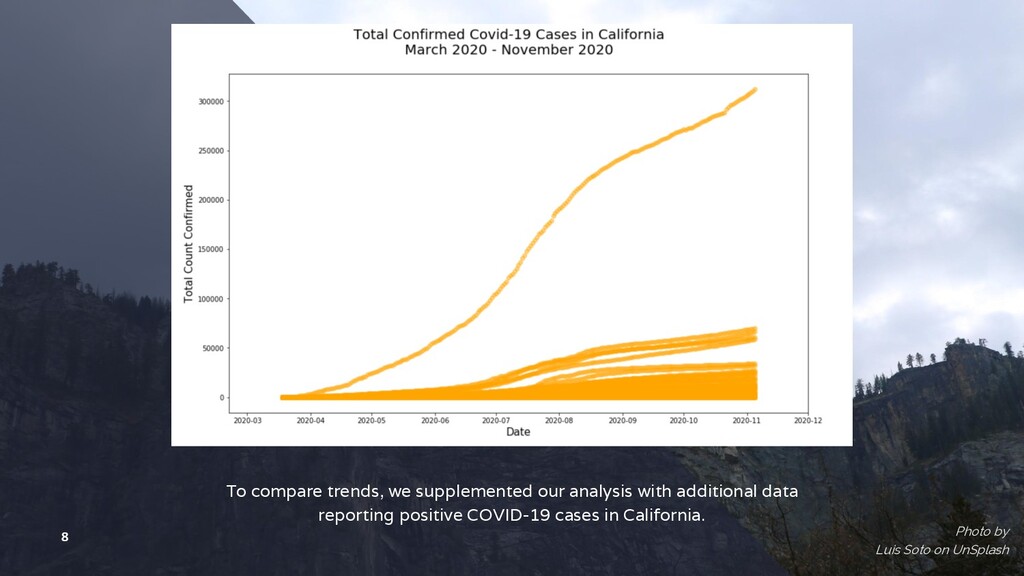
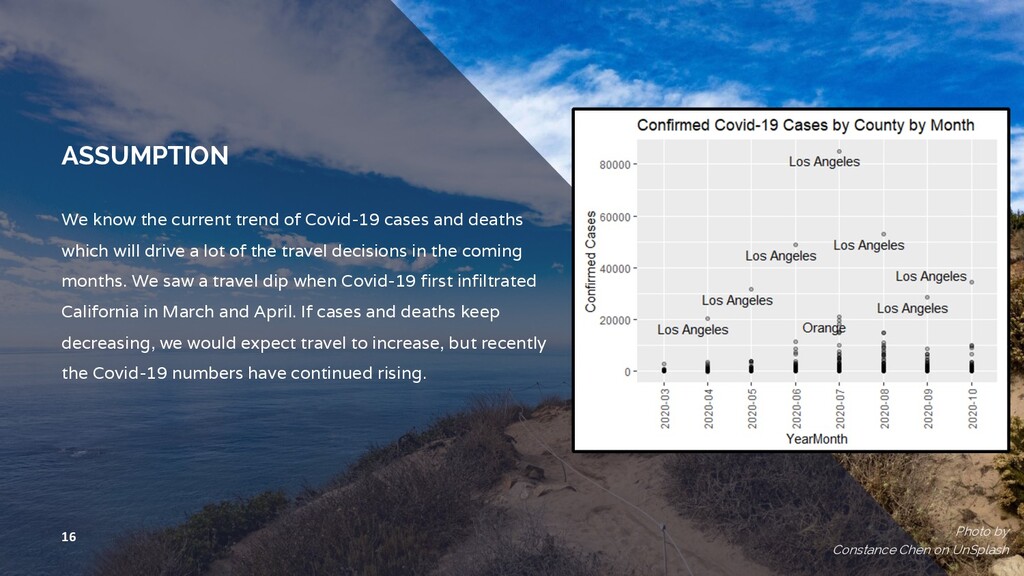
and deaths which will drive a lot of the travel decisions in the coming months. We saw a travel dip when Covid-19 first infiltrated California in March and April. If cases and deaths keep decreasing, we would expect travel to increase, but recently the Covid-19 numbers have continued rising. Photo by Constance Chen on UnSplash
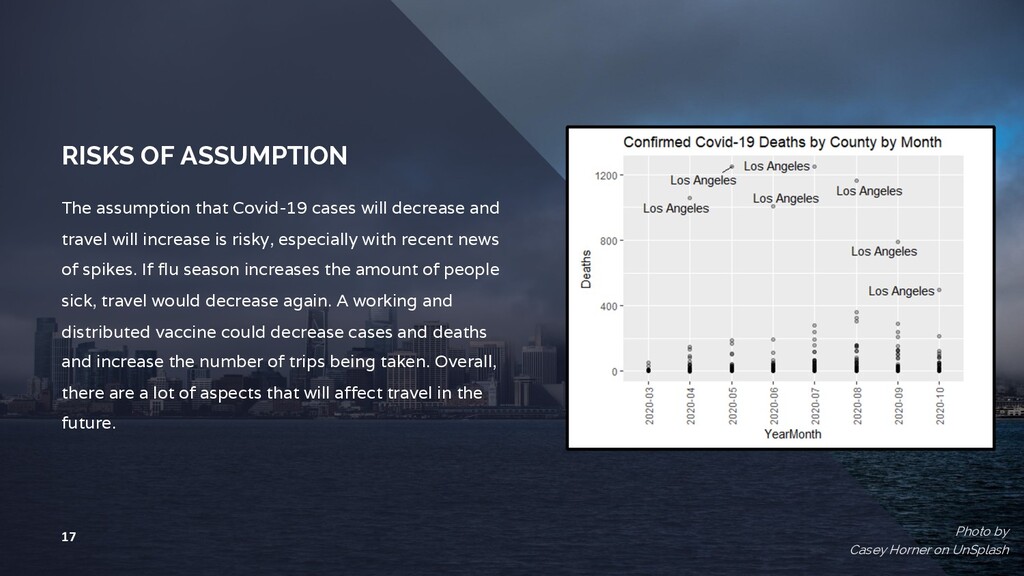
decrease and travel will increase is risky, especially with recent news of spikes. If flu season increases the amount of people sick, travel would decrease again. A working and distributed vaccine could decrease cases and deaths and increase the number of trips being taken. Overall, there are a lot of aspects that will affect travel in the future. Photo by Casey Horner on UnSplash
solely on past trip numbers ╺ Using Covid-19 data helped with comparisons between trends observed and confirming expectations ╺ Weather, school breaks, income, and profession could all come into play when people are deciding to take trips or not ╺ Differentiating what kind of trips people are taking such as road trips, air travel, or train travel could offer valuable information for the transportation industry and travel agencies Photo by Fabian Quintero on UnSplash
https://data.bts.gov/Research-and-Statistics/Trips-by- Distance/w96p-f2qv California ALL. (2020, November 9). Tracking COVID-19 in California. CA.gov. Retrieved from https://covid19.ca.gov/state- dashboard/ California Open Data. (2020). COVID-19 Cases. Retrieved from https://data.ca.gov/dataset/covid-19- cases/resource/926fd08f-cc91-4828-af38-bd45de97f8c3 Data.gov. (2020, September 29). Trips By Distance. Bureau of Transportation Statistics. Retrieved from https://catalog.data.gov/dataset/trips-by-distance 19 Photo by Julian Myles on UnSplash
from https://otexts.com/fpp2/arima-r.html Prabhakaran, S. (2020, September 17). ARIMA Model - Complete Guide to Time Series Forecasting in Python. Retrieved November 08, 2020, from https://www.machinelearningplus.com/time- series/arima-model-time-series-forecasting-python/ Singh, D. (2019, July 12). Deepika Singh. Retrieved September 29, 2020, from https://www.pluralsight.com/guides/time-series- forecasting-using-r Tourwriter. (2020). The travel industry is resilient: Historical events and how tourism has bounced back. Retrieved from https://www.tourwriter.com/travel-software-blog/covid-19-pt1/ 20 Photo by Julian Myles on UnSplash